© 2019, IRJET | Impact Factor value: 7.211 | ISO 9001:2008 Certified Journal
| Page 461
NOISE CANCELLATION
Kamali R
1, Keyne S Cleetus
2, Kanimozhi J
3, Prof Sharmila Hemanandh
41,2,3
Students, Dept of Electronics and Communication Engineering, Jeppiaar SRR Engineering College, Chennai,
Tamil Nadu
4
Assistant Professor, Dept of Electronics and Communication Engineering, Jeppiaar SRR Engineering College,
Chennai
---***---Abstract - Noise cancellation is nothing but removing anunwanted signal without affecting the original signal. Here we are going to remove noise both in image and sound. The information sent from the sender side may not be the same at the receiving side. The signal obtained after transmission is often corrupted with noise. The major reason that noise can occur during the image capture and transmission. In order to deliver proper and correct information to receiver, here we use some technique to remove noise. To restore the original signal at the receiver end is the challenging task. The main objective of our project is to compare which method or technique is better to remove noise without losing any information in both image and audio signal.
Key Words: In image-Denoise, filters, PSNR, MSE and In audio-Denoise-MFCC Algorithm
1. INTRODUCTION
The noise can be present everywhere. In image noise is represented as unwanted information which deteriorates image quality while in audio, noise is the unwanted disturbance present in a signal. To remove these noises and to receive the original signal to the receiver we use some methods. Let us discuss about the different types of noise which affects the signal and the techniques which are used to reduce them.
Digital image plays a vital role in research and technology which uses digital image processing to improve the image qualities. This process helps in maximizing the clarity and sharpness of image. It improves the details in areas of interest towards extraction of information and further process. Image noise means, pixels present in the picture contains different intensity values rather than the correct values and random variation in the brightness of image. Images can be used in fields like medical and education but images are often degraded by noise. Noise is defined as the process (v) which affects the acquired image or the original image(z) and is not part of the initial signal (c), and so noise can be written as
z (i, j) = c (i, j) + v (i, j)
Noise may come from the various sources. It may occur during image acquisition, image transmission, image reproduction etc. If the image is corrupted by noise then the quality of the image will be reduced and to retain the original
image from the noise corrupted image, various noise removal techniques are needed to be used. Denoise means removal of unwanted information from an image. The process can be done by using filters.
Human voice is a most commonly used tool and it is used to pass information(message) to each other. Now with the development of the times, mankind has entered the information age, with the modern means of speech signal study, people can generate, transmit, store, access, and apply voice messaging more effectively, which has a very important for the social development. So, in this thesis, we built a voice collection system, which can collect voice signal then analyze the signal, then filter the noise by using various type of filters.
The sources of noise in image and audio signal are:
1. Due to electronic transmission of image data can produce noise.
2. The noise may occur if the image sensor is affected by environmental conditions during image acquisition.
3. The film grain is the source of noise, if the image is scanned from a photograph made on film.
4. Due to the interference in the transmission channel may corrupt the signal.
5. The noise may occur, if installation process went wrong.
2. TYPES OF NOISES
2.1 Salt and Pepper Noise
© 2019, IRJET | Impact Factor value: 7.211 | ISO 9001:2008 Certified Journal
| Page 462
2.2 Gaussian noiseIt is also said to be additive noise and it is evenly distributed over signal. This says that each and every pixel in the noisy image is the sum of the true pixel value and a random gaussian distributed noise value where the noise is independent of intensity. This gaussian noise is caused due to the poor illumination during capture, high temperature and noise present in the electronic circuits.
2.3 Poisson noise
It is also said to be shot or photon noise. It is caused as a result of variation in the photons found at a given exposure level and when number of photons sensed by the sensor is not sufficient to determine the statistical information. Poisson noise exists because natural phenomenon such as light and electric current consists of the movement of discrete packets.
2.4 Speckle Noise
Speckle noise is a multiplicative noise and it causes any distribution to be multiplied by each pixel in the picture. This noise occurs in the images produced by ultrasounds, laser and sonar. It is caused by owing to random ups and downs in the signal coming from an object that is smaller than a signal
image component. This noise can be modeled by
P = I + q * I
Where P is the speckle noise distribution image,
I is the input image,
q is the uniform noise image by mean and variance.
Narrow and Broad Band Noise
Narrow band noise is a type of noise stimulus that is centered around a narrow range of frequencies. It is introduced by filtering a 1/3 octave range from the broad band noise. Narrow band noise is useful when masking during audiometric testing. Broadband noise is also said to be wideband noise whose energy is shared over a wide range of frequency
2.6 Crackle and Distortion noise
Crackling noises are coming from the speakers which can be annoying and it can be a sign that something is going on inside the speakers which is damaging them. Popping sounds are the result of the bad connection. This problem could lie in the cable, speakers, or another piece of equipment.
2.7 Noise in an image
[image:2.595.328.561.56.203.2]In the below image the salt and pepper noise are added to the noise density level of 0.1.
Fig -1: Salt and pepper Noise in an image
3. NOISE REMOVAL IN IMAGE
In modern world digital image processing for data de-noising is a well-known problem and it is the concern of diverse application areas. The denoising will be the first step in every image processing technique. Here we are using seven filters to remove the noise. Then by using the parameters such as PSNR and MSE for checking the quality of the filtered image. The values are then compared to find out which filter produces the good quality image.
3.1 Median filter
Median filter is said to be a nonlinear and order statistics filter. This filter removes the noise by smoothening the image. Here we calculate the median value of all the pixels by sorting them in ascending order and then replacing the middle value of pixel to the neighbouring pixels.
[image:2.595.361.501.448.516.2]
Fig -2: Filtered by median filter
3.2 Box filter
Box filter is said to be linear filter. It is form of low pass filter. In this filter, we need to calculate the mean value of all the pixel in the image and then replacing the pixel to the middle pixel value. It works on the spatial domain and in the frequency domain, the box filter has zeros and negative components.
[image:2.595.363.506.656.734.2]© 2019, IRJET | Impact Factor value: 7.211 | ISO 9001:2008 Certified Journal
| Page 463
3.3 Standard deviation filterStandard deviation filter is very useful for radar images. For each group of pixels in the input image, a standard deviation is found and assigns that value to the center pixel of the output image.
Fig-4: Filtered by standard deviation filter
3.4 Entropy filter
Entropy filter accentuates edges by brightening pixels which have dissimilar neighbors. Sets each pixel in the current image equal to the entropy of the pixel values in the specified neighborhood.
Fig-5: Filtered by entropy filter
3.5 Range filter
Range filter, filters the data by replacing every value by the difference of the maximum and minimum in its range to its neighbor.
Fig-6: Filtered by range filter
3.6 Gaussian filter
Gaussian filter is the linear filter. It reduces the noise by blurring the image. This filter will blur edges and reduce the contrast of the image. It is widely used in graphic software.
Fig-7: Filtered by gaussian filter
3.7 Wiener filter
Wiener filter is a linear filter is used to produce an estimate of desired process. In the wiener filter, from the list of neighbor pixels, the maximum or the minimum value is found and then stored in the resulting value. At last each pixel in the image is replaced by the resulting value in the neighborhood image.
Fig-8: Filtered by median filter
4. PERFORMANCE OF PARAMETER
4.1 Mean Square Error
Mean square error is used to measure the average of the square of the error. MSE is measured by the difference between the compressed and the original image. If the MSE value of the image is small then that filter will be the best filter.
4.2 Signal to Noise Ratio
The SNR is defined as the ratio between the signal and noise and then it is used to compare the desired signal level to the background noise level. The higher the ratio, less the background noise.
SNR = Psignal /Pnoise
4.3 Peak Signal to Noise Ratio
© 2019, IRJET | Impact Factor value: 7.211 | ISO 9001:2008 Certified Journal
| Page 464
5. IMLEMENTATION AND RESULTS [image:4.595.30.296.190.429.2]Here the salt and pepper noise are added to image and then the noise is filtered by using various filter and filters output is compared with the parameter such as MSE, PSNR, SNR to see which one will be the best filter to filter the noise.
Table -1: Comparism of filters using parameters
Parameters
Filters
Mean Square Error
Peak Signal to Noise Ratio
Signal to Noise Ratio
Range Filter 11945.71 7.35 1.85
Entropy Filter 1899.18 15.34 10.40
Standard
Deviation Filter 1898.03 15.29 10.33
Gaussian Filter 802.31 19.08 14.15
Weiner Filter 757.26 19.33 14.39
Box Filter 243.93 24.25 19.20
Median Filter 10.85 37.77 32.82
From the table it is clear that Median filter among the seven filters cancels the noise to a greater extent.
6. NOISE REMOVAL IN AUDIO
In audio signal the noise can be removed by various methods. If we use low pass or the high pass filters, only the noise up to a particular range of frequency is removed, so that makes it difficult to remove all noises present in the signal. Hence, we use MFCC algorithm and Chebyshev filter to reduce the noise in the audio signal.
6.1 Noise cancellation using MFCC
Mel Frequency Cepstral Coefficients (MFCC) are a feature widely used in automatic speech and speaker recognition. MFCC is preferred as a feature extraction technique, which will be easy to perform the operation.
6.1.1 Steps to remove the noise
1. First get the input as the audio signal and then read the signal of the voice to draw the graph.
2. Now add the noise signal and then analyze its frequency spectrum.
3. Design the filter to remove noise from the signal.
4. Playback the filtered voice signal which will be the original signal without noise.
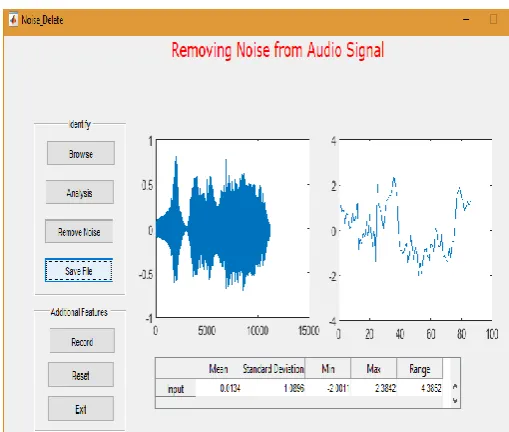
6.1.2 IMPLEMENTATION
To remove the noise in the audio signal, first we need to design the process with the help of Graphical user interference. Then the input signal is given to implement the process and after getting the input signal the process will begin by using the MFCC algorithm. The process carried out by MFCC algorithm includes dividing the signal into short frames and for each frame we need to calculate the estimated power spectrum. Then apply the Mel filter bank to the power spectra, sum the energy in each filter and take the logarithm of all filter bank energies. Take DCT of the log filter bank energies. After finding this the last step is to keep the DCT coefficients to discard the test. This process helps to remove the noise easily.
Fig-9: Software implementation of noise removal using MFFC
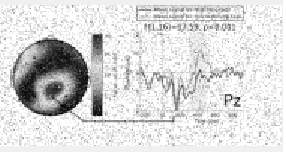
6.2 Noise cancellation using Chebyshev filter
Chebyshev filter is an analog or digital filter. The property of this filter is to reduce the error between the actual and idealized characteristics of a signal.
6.2.1 Steps involving in the cancellation of noise
1. The input noise signal is plotted in time domain and in frequency domain.
2. Chebyshev filter of order 2 is applied to the noisy signal.
[image:4.595.307.562.306.522.2]© 2019, IRJET | Impact Factor value: 7.211 | ISO 9001:2008 Certified Journal
| Page 465
6.2.2 ImplementationThe input noise signal is read and it is plotted in both time and in frequency domain. Chebyshev filter of second order is applied to the noisy signal. The filter calculates the sampling rate of the signal. It calculates the relative power, speed, pass band and stop band frequency with ripple factors of the noisy signal. The filter is found to be stable as the impulse response decays with time, thus reducing the noise.
Fig-10: Software implementation of noise removal using Chebyshev filter
In MFCC algorithm the graphical representation and the noiseless signal is found out whereas by using Chebyshev filter only the graphical representation of the filtered signal is found. This disadvantage of Chebyshev filter makes MFCC a better algorithm to reduce the noise in a signal.
7. CONCLUSION
In this paper, we have discussed about the types of noises and how it affects the signal during transmission of data. Here to remove noise in image and audio signal various techniques are used and compared to see which one is the best to remove the noise in the signal. In image we remove the noise by using various filters and on comparing them by using parameters such as MSE, SNR, PSNR, we conclude that median filter is the best among the seven other filters used here. In audio signal to remove noise MFCC will be better than Chebyshev Filter.
REFERENCES
[1] Asoke Nath ―Image Denoising algorithms: A comparative study of different filtration approaches used in image restoration‖, International conference on communication systems and network Technologies, 2013.
[2] Rohit verma and Jahid ali, ―A comparative study of various types of image noise and efficient noise removal techniques‖, International journal of advanced research in computer science and software engineering, volume 3, issue 10 October 2013.
[3] Raymond H. Chan, Chung-Wa Ho, and Mila Nikolova, ―Salt- and- pepper noise removal by median- type noise detector and detail- preserving regularization‖, IEEE Transaction on image processing, vol. 14, No. 10 October 2005.
[4] Mr. Salem Saleh Al-amri and et al. Comparative Study of Removal Noise from Remote Sensing Image. IJCSI International Journal of Computer Science Issues, Vol. 7, Issue. 1, No. 1, January 2010 32 ISSN (Online): 1694-0784 ISSN (Print): 1694-0814
[6] C. M. Harris, Handbook of Acoustical Measurements and Noise Control, 3rd ed. New York: McGraw-Hill, 1991.
[7] L. L. Beranek and I. L. Ver, Noise and Vibration Control Engineering: Principles and Applications. New York: Wiley,1992.
[8] Rafael C. Gonzalez,‖ Image Restoration Reconstruction‖, in Digital Image Processing, 3rdIndia: Pearson Prentice Hall, 2011, pp. 322-330 .
[9] Sarita Dangeti, ―Denoising Techniques: a ComparisM.S. Thesis, Louisiana State University, 2003.
[10] S.M. Kuo, D.R. Morgan, Active noise control: a tutorial review, Proc. IEEE 87 (6) (June 1999) 943-975.
Kamali R
Pursuing Degree in Electronics and Communication Engineering in Jeppiaar SRR Engineering College, Chennai, Tamil Nadu.
Keyne S Cleetus
Pursuing Degree in Electronics and Communication Engineering in Jeppiaar SRR Engineering College, Chennai, Tamil Nadu.
© 2019, IRJET | Impact Factor value: 7.211 | ISO 9001:2008 Certified Journal
| Page 466
Kanimozhi JPursuing Degree in Electronics and Communication Engineering in Jeppiaar SRR Engineering College, Chennai, Tamil Nadu.
Sharmila Hemanandh