Sophie Grenfell
Autobiographical
Memory and the
Default Mode
Network in Mild
Cognitive
Impairment
Submitted in partial fulfilment of the requirement for the degree of
Master of Science
Department of Psychology
University of Canterbury
Acknowledgements
Firstly, I would like to thank my primary supervisor Professor John Dalrymple-Alford for
his time, supervision and especially his patience throughout the duration of this project; your
input in this thesis has been invaluable. I would also like to thank Adjunct Professor Margaret
Mclagen for her input and for being my secondary supervisor.
I would like to thank the New Zealand Brain Research Institute for providing me with
space for the past 2 years so I could complete this thesis. A very big thank you to Tracy Melzer
for all the scanning and imaging work he has done for the project.
The volume of work that has gone into this project as a whole has been, and continues to
be, massive, so thank you to Amy Wang and Bob Young for their part in this project and my
thanks to Ann Jones and Simon Donaldson for their role at the beginning stages. Without you all
completing this thesis would not have been possible.
Thanks to Carrie, Nadia, Sarah and Jonathan (and the creator of morning tea) for letting
me rant, vent and moan when it seemed like this would never be finished. Thanks go to my
family for also supporting me and listening to my ideas even when they weren’t really that
interesting.
And finally, I would like to thank Pete McGinigal who has supported me through all of
the stressful, dark and twisty moments I’ve had during this thesis and for teaching me the value
| iii
Table of Contents
Chapter 1. Introduction... 1
1.1 Mild Cognitive Impairment ... 1
1.2 Autobiographical Memory in MCI ... 2
1.2.1 Neural Correlates of Autobiographical Memory ... 4
1.3 Source Memory... 5
1.4 Default Mode Network ... 6
1.4.1 Anatomy of the default mode network ... 6
1.4.2 The Default Mode Network in Mild Cognitive Impairment ... 7
1.5 The Neural Overlap between the DMN and Autobiographical Memory ... 8
1.6 The Current Study ... 9
Chapter 2. Method ... 9
2.1 Participants ... 9
Table 1 ... 11
Table 2 ... 15
Age, Education and Gender of Participants ... 15
2.2 Standard Neuropsychological Tests ... 15
2.2.2 Autobiographical Memory Interview (AMI) ... 17
2.2.3 Source Memory ... 18
2.3 Procedure ... 18
2.3.1 Neuropsychological Tests ... 18
2.3.2 Autobiographical and Source Memory ... 19
2.3.3 Imaging ... 19
Chapter 3. Results ... 23
3.1 Descriptive Statistics ... 23
Table 3 ... 23
3.2 Autobiographical Memory (AMI)... 28
Table 5 ... 28
Table 6 ... 30
3.3 Source Memory... 32
Table 7 ... 32
Means and Standard Deviations of Number of Correct Responses on Source Memory Measures for HC and MCI Participants ... 32
3.4 Default Mode Network ... 33
Chapter 4. Discussion ... 38
4.1 Limitation and Future Directions ... 42
4.2 Concluding Remarks ... 44
| v
ABBREVIATIONS
AD Alzheimer’s disease
ADAS-Cog Alzheimer’s disease assessment scale-cognitive subscale
aMCI amnesic mild cognitive impairment
AMI autobiographical memory interview
BVMT brief visual memory test
CDR clinical dementia rating scale
CVLT California verbal learning test
DMN default mode network
DRS dementia rating scale
FOV field of vision
GOF goodness of fit
ICA independent component analysis
IPC inferior parietal cortex
ITC inferior temporal cortex
JLO judgement of line orientation
LST Lesion segmentation toolbox
MCI mild cognitive impairment
MMSE mini mental state exam
MoCA Montreal cognitive assessment
mPFC medial prefrontal cortex
MRI magnetic resonance imaging
MTL medial temporal lobe
nMCI non-amnesic mild cognitive impairment
NP1 neuropsychological inventory 1
NP2 neuropsychological inventory 2
PCC posterior cingulate cortex
SDMT symbol digit modality test
SPM statistic parametric mapping
TOPF test of premorbid functioning
VAT visual association test
VSOP visual object and space perception
Individuals with mild cognitive impairment (MCI) show variable impairment in autobiographical
memory function, source memory function and reduced integrity in the brain’s default mode
network (DMN). There is overlap between the DMN, such as the medial posterior cortical hub,
and brain regions that are active when participants recall autobiographical memories. To assess
the association between autobiographical memory and the DMN, 14 MCI and eleven age and
education-matched healthy control participants were assessed using the autobiographical
memory interview (AMI) and underwent resting state fMRI scans. The same participants underwent a test of source memory which assessed both recognition and source memory. The
MCI group showed significantly increased semantic as well episodic memory impairments using
the AMI, evident across the lifespan for episodic memory but not for childhood semantic
memory. Significantly poorer DMN connectivity, using a goodness of fit index (GOF) of the
DMN template, was evident in the MCI group. MCI participants showed poorer performance on
both recognition and source memory relative to HC participants. A modest association between
AMI semantic memory (r=0.4) scores, but not episodic memory scores (r=0.09), and DMN
connectivity was found in these participants. For future study the predictive value of MR
Chapter 1.
Introduction
1.1 Mild Cognitive Impairment
Mild cognitive impairment (MCI) is a neurodegenerative disorder marked by a decline in
cognitive ability below that expected of someone of a similar age and is thought to be an
intermediate stage between normal aging and dementia (Ritchie, 2004). Recent work subdivides
MCI into two types, amnesic MCI (aMCI) and non-amnesic MCI (nMCI). Amnesic MCI affects
memory whereas a less common non-amnesic MCI (nMCI) affects any non-memory area of
cognitive functioning (Petersen, 2004). These MCI types are each subdivided into single domain
and multiple domain MCI (Gauthier et al., 2006), in terms of whether one domain or multiple
domains of cognitive function show impairments. A variety of diagnostic criteria have been used
when assessing individuals for MCI. The most commonly used diagnostic criteria, however, are
those derived from Petersen (2004). Petersen’s criteria are geared toward detecting aMCI as a
prodromal condition for Alzheimer’s disease (AD) where the individual must show a subjective
memory complaint, abnormal memory functioning for their age group, be relatively unimpaired
in other areas of cognition and not have significant impairment in activities of daily living so that
they do not meet criteria for dementia.
Worldwide prevalence rates of MCI vary, ranging from 3.1% to 35% (Ritchie, 2004;
Seeher, Low, Reppermund, & Brodaty, 2013). This range of prevalence is likely because of
differing terminology and therefore diagnostic criteria between studies. Individuals with MCI
convert to dementia at an annual rate of between 6 and 25%, which is up to 5 times greater than
the normally aging population who have an annual conversion rate of between 0.5% and 4% (Jin,
Pelak, & Cordes, 2012a; Knopman, Boeve, & Petersen, 2003). MCI can, however, stay stable
normal functioning (Buckner, Andrews-Hanna, & Schacter, 2008). Due to this ambiguity of
prognosis for MCI, opportunities exist to assess which factors contribute to the stabilizing and
reversal of symptoms. As a consequence, detailed neuropsychological testing beyond an initial
screen, as well as measures of one of more biomarker, is desirable to capture individuals who are
highly likely to progress (Petrella, Sheldon, Prince, Calhoun, & Doraiswamy, 2011).
1.2 Autobiographical Memory in MCI
There are two components of autobiographical memory, episodic memory and semantic
memory. Episodic memory requires mentally projecting back in time to reconstruct details about
personal events. This remembering is often accompanied with a feeling of re-experiencing
emotions (Spreng & Grady, 2010). Semantic memory, by contrast, is the recall of factual
information devoid of unique personal experiences. This disconnection between episodic and
semantic memory (Svoboda, McKinnon, & Levine, 2006) allows both components of
autobiographical memory to be assessed separately. Episodic autobiographical memory is
regarded as the first type of memory to become impaired in people with MCI. Typically memory
for the source of this information becomes impaired, which includes dates and times of the
personal events experienced. Semantic memory is thought to stay relatively unimpaired in MCI,
at least until the later stages and progression to dementia.
There have been very few studies investigating the status of autobiographical memory in
MCI and these studies have reported inconsistent results. Healthy controls have been found to
recall significantly more details when episodic memory retrieval is tested compared to aMCI
| 3 Eschweiler, & Saur, 2009), highlighting MCI as an intermediate stage between normal aging and
dementia.
When examining semantic memories healthy control participants and aMCI participants
were both significantly better than AD participants at recalling details, but there was no
significant difference between the performance of healthy controls and aMCI (Murphy et al.,
2008). This result shows a relative sparing of semantic memory in aMCI. In one study, aMCI
participants actually recalled more semantic details than healthy controls (Gamboz et al., 2010),
which could indicate a compensatory mechanism for the loss of episodic memory. Contrary to
this finding, Tramoni et al (2012) found MCI participants recalled fewer semantic details than
healthy controls, although the pattern of details recalled across time was similar in both groups;
recall for recent semantic details was better for recent time than for childhood or early adulthood.
Recall of recent episodic events was also poorer for aMCI participants than that for
events in childhood and early adulthood (Irish, Lawlor, O'Mara, & Coen, 2010; Leyhe et al.,
2009). This is the same pattern found in dementia, where recent memory shows the greatest
deficits (Leyhe et al., 2009). A greater deficit of episodic memory recall in middle adulthood has
been found in MCI (Irish et al., 2010). This is contrary to the normally aging population where
an increase in detail has been found (Janssen, Chessa, & Murre, 2005).
The differences found in level of recall of semantic and episodic memory might be
attributed to the particular autobiographical memory test used. A range of different tests are used
to assess autobiographical memory that may influence the pattern of results. With the
autobiographical memory interview (AMI) (Kopelman, Wilson, & Baddeley, 1989), recall of
2012). The AMI requires participants to recall episodic and semantic memories separately, in
comparison other studies that required participants to recall a memory and assessment of the
semantic and episodic components was later done when scoring (Kopelman et al., 1989; Levine,
Svoboda, Hay, Winocur, & Moscovitch, 2002; Piolino, Desgranges, & Eustache, 2000). The
scoring for the AMI is, therefore, more objective and consistent for comparison across
individuals and groups.
1.2.1 Neural Correlates of Autobiographical Memory
Reviews of fMRI activation patterns in autobiographical memory have reported that prefrontal cortex, medial temporal lobes, temporal cortex, temporoparietal junction, retrosplenial/posterior
cingulate cortex and cerebellum were consistent areas of activation across studies (Milton,
Butler, Benattayallah, & Zeman, 2012; Svoboda et al., 2006). It is thought that prefrontal
involvement is necessary for the conscious re-experience of episodic memory (Tulving, Kapur,
Craik, Moscovitch, & Houle, 1994). The activation in the prefrontal lobe is predominantly
left-lateralized in the ventrolateral prefrontal region, and is associated with strategic retrieval and
verification (Fletcher & Henson, 2001). The medial temporal lobe (MTL) includes the
hippocampus, parahippocampus, perirhinal and entorhinal cortex. The MTL shows the most
consistent activation across studies of autobiographical memory, with the hippocampus showing
activation in the majority of studies (Svoboda et al., 2006). As is well known the MTL are
affected early in AD and damage to the MTL is associated with memory deficits (Clark &
Squire, 2010), therefore it is expected there may be some deficit in autobiographical memory
| 5
1.3 Source Memory
Source memory is the ability to recall when and where information was learnt or an event
experienced. Deciding what the source of a given memory can be unconscious and made without
any intentional thought. When this process is made with intentional thought it becomes more
strategic. Inferences can be made about the source of the memory based on other information,
because of this the source can be misattributed (Johnson, Hashtroudi, & Lindsay, 1993). For
source memory to be accurately and successfully recalled the quality of an individual memory
must be of a higher quality than one where the source is not recalled accurately.
Source memory can be divided into three different types. The first is reality, where there
is differentiation between self-generated and other-generated sources. The second is external,
where there is differentiation between two separate external sources. The third is internal, where
the differentiation is between two separate self-generated sources (El Haj, Fasotti, & Allain,
2012). The most commonly tested source memory is external, where individuals are presented
with external stimuli and at a later point in time are asked what the source of those stimuli was.
Evidence from studies examining AD patients has shown both recognition memory and
external source memory to be impaired, which is found when the stimulus presented is visually
as pictures or printed words and verbally as different voices reading sentences aloud (Dalla
Barba, Nedjam, & Dubois, 1999; Dodson et al., 2011). In addition Dodson et al. (2011) also
measured participants’ confidence of both their recognition and source judgements and found
that participants with AD lacked awareness of the accuracy of their decisions. A comparison
group of healthy controls showed more confidence in accurate decisions than incorrect
While still impaired, internal source memory tends to be less impaired than external
source memory in AD (El Haj et al., 2012). This implies that AD participants will be more
impaired on tests of source memory than tests of autobiographical memory which examines
internal source memory as opposed to external source memory.
Although no studies have directly investigated source memory in MCI, evidence shows
when recalling an autobiographical memory, individuals with MCI have an impairment recalling
the dates and places of events (or internal source memory) (Kopelman, Wilson, & Baddeley,
1990). Therefore it is possible to infer that within the MCI population source memory will be
poorer than for normally aging individuals. Confidence in accuracy of recognition and source
decisions should also show a deficit.
1.4 Default Mode Network
As explained below, one potentially important neural system in this regard is the default mode
network (DMN). The default mode network is a network in the brain that shows high resting
state activity when an individual is not engaged in any specific cognitive task (Wu et al., 2011).
Activities such as future thinking, past remembering, mental imagery and mind wandering are all
associated with the DMN (Buckner et al., 2008; Kim, 2012). The DMN is the primary network
associated with spontaneous cognition, as seen in the strong correlation between stimulus
independent thought and DMN activity (Buckner et al., 2008).
1.4.1 Anatomy of the default mode network
| 7 2011). In individuals with MCI a reduction of grey matter volume is seen bilaterally in the
medial temporal cortex, hippocampus, thalamus, insular cortex and in parts of the inferior
parietal lobe (Sorg et al., 2007).
1.4.2 The Default Mode Network in Mild Cognitive Impairment
A range of differences are found in the DMN in people with mild cognitive impairment, which
include reduced activity, changes in connectivity between different areas (Wu et al., 2011) and
reduced white and grey matter (Sorg et al., 2007). There is a progressive deterioration when
comparing the DMN of healthy aging, aMCI and demented participants (Hafkemeijer, van der
Grond, & Rombouts, 2012). Healthy aging individuals have more activation of the DMN than
MCI and demented participants and MCI have more activation of the DMN than demented
participants. This appears to mirror the cognitive deterioration during the progression towards
dementia and again highlights MCI as an intermediate stage between normal aging and dementia.
1.4.2.1 Reduced Activity
In individuals with MCI, reduced activity is found in the PCC, medial prefrontal cortex
(Rombouts, Barkhof, Goekoop, Stam, & Scheltens, 2005), superior parietal lobe and the right
prefrontal cortex (Sorg et al., 2007). The reduced activity and profusion abnormalities in the
posterior cingulate cortex even before the onset of dementia may be related to impairment in
episodic memory (Wu et al., 2011). One study, however, reported an increase in activity is also
found in the superior left frontal gyrus, dorsal medial prefrontal cortex, left parietal lobe and
medial temporal gyrus, which suggests a possible compensation for the decreased activity in the
DMN can be viewed on a continuum with healthy aging individuals showing the most integrity,
MCI participants showing lower integrity and AD participants showing the lowest integrity,
moreover, MCI participants showing lower integrity in the DMN were found to be more likely to
convert to AD (Petrella et al., 2011).
1.4.2.2 Disrupted Functional Connectivity
Studies with MCI participants have shown decreased connectivity between the hippocampus and
the prefrontal cortex and a change in connection direction between the right and left
hippocampus and the right and left IPC (Wu et al., 2011). This evidence suggests a
reorganisation between the prefrontal cortex and the posterior cingulate cortex in the DMN in
MCI.
The posterior cingulate cortex is a crucial node in the default mode network. Studies have
shown a disruption between the connection of the PCC and the temporal lobe in MCI
participants (Wang et al., 2012). A positive association has also been found between scores on
the Mini Mental State Exam (MMSE) and functional connectivity in between precuneus and the
posterior cingulate cortex in MCI participants (Wang et al., 2012). That is, higher MMSE scores
are indicative of stronger functional connectivity between the precuneus and PCC.
1.5 The Neural Overlap between the DMN and Autobiographical Memory
There is overlap between crucial nodes of the DMN and the neural correlates of autobiographic
memory. As discussed above the MTL is essential for memory and is an important component in
| 9 in the DMN (Buckner et al., 2008) and is also implicated in autobiographical memory (Milton et
al., 2012).
1.6 The Current Study
The current study examined both autobiographical and source memory in individuals with MCI
and in healthy controls (HC). The AMI was used to more objectively assess semantic and
episodic components of autobiographical memory. It was expected individuals with MCI would
show deficits in both autobiographical and source memory. It was also expected there would be a
positive correlation between scores on the AMI and source memory tests. The neural correlates
of autobiographical memory within the default mode network were examined using resting state
fMRI in a 3 T scanner at the New Zealand Brain Research Institute. It was expected that there would be a decrease in the integrity of the DMN in participants with MCI relative to HC
participants and the integrity of this system would be associated with episodic autobiographical
memory scores.
Chapter 2.
Method
2.1 Participants
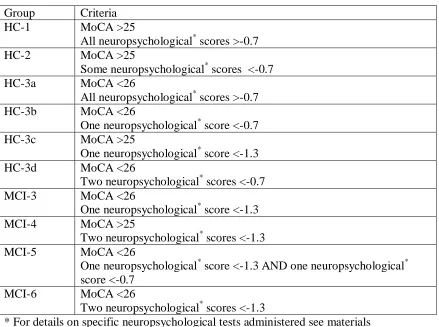
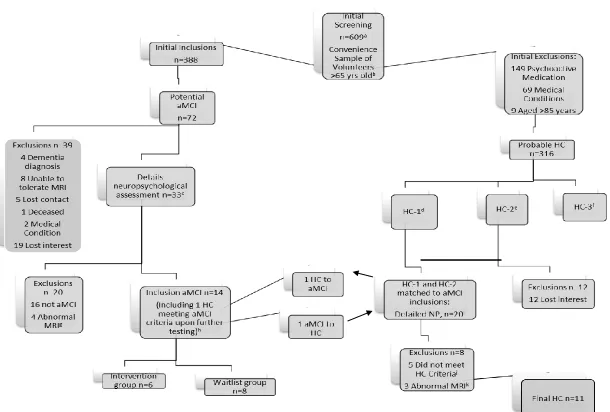
Previous research has experienced difficulty finding MCI participants. Here, a screening
study first assessed 609 older volunteers on various cognitive measures (figure 1). Two
hundred and twenty one participants were excluded due to medications, medical disorders
and very old age. Participants were then divided into 10 different groups, ranging from
“MCI-6” (likely to have MCI) to “HC-1” (likely to be aging normally) based on scores on
the initial screening neuropsychological tests. Those classified 3, 4, 5,
healthy controls (see table 1 for specific criteria). Eighty six potential MCI participants were
then contacted, 47 participants of whom were not suitable, leaving 39 that were assessed, of
the latter, 14 participants met the criteria for MCI (see figure 1). Twenty healthy controls
(HC) were contacted who were matched to these MCI participants, based on age, gender and
education (see table 2 for summary of participants), and assessed on the same
neuropsychological tests as the MCI participants. Eleven of these HC met the study criteria
| 11 Table 1
Groups and Criteria of Participants after Initial Screening
Group Criteria
HC-1 MoCA >25
All neuropsychological* scores >-0.7
HC-2 MoCA >25
Some neuropsychological* scores <-0.7
HC-3a MoCA <26
All neuropsychological* scores >-0.7
HC-3b MoCA <26
One neuropsychological* score <-0.7
HC-3c MoCA >25
One neuropsychological* score <-1.3
HC-3d MoCA <26
Two neuropsychological* scores <-0.7
MCI-3 MoCA <26
One neuropsychological* score <-1.3
MCI-4 MoCA >25
Two neuropsychological* scores <-1.3
MCI-5 MoCA <26
One neuropsychological* score <-1.3 AND one neuropsychological* score <-0.7
MCI-6 MoCA <26
Two neuropsychological* scores <-1.3
* For details on specific neuropsychological tests administered see materials
Inclusion criteria for participants in the final MCI group were objective memory loss
measured by neuropsychological test scores at -1.5 SD below the age and education adjusted
norms. Where Z scores were unavailable (for example the Rivermead story recall test), a profile
score of 1 (borderline) or a score of <19 on delayed recall IR31 (Selective Reminding Test) were
used as inclusion criteria. These participants also were required to have (a) one global score from
<26 on the Montreal cognitive assessment (MoCA), a scaled score of 7 or 8 on the Dementia
rating scale (DRS-2) or a score of >9 on the ADAS-cog; (b) a subjective memory complaint by
screening test; a score of 0 or 0.5 on the Clinical dementia rating scale (CDR) and essentially
a Using MoCA, Rey Complex Copy, Rey Complex Immediate Recall, Trails A. b Response to local newspapers, NZBRI website.
c Based on further screening (NP1) using MoCA, Rey complex copy, immediate and delayed recall, trails A and B, digit span, clinical dementia scale, dementia rating scale (DRS-2), judgement of line orientation (JLO), D-KEFS stroop test, letter fluency, category fluency and switching, action fluency, SDMT, CVLT and BVMT. Confirmatory tests (NP2) included ADAS-Cog, Rivermead story recall, design fluency, visual association test (VAT) and RI-48 selective reminding test (see method for further detail).
d HC-1, MoCA > 25 and all NP test scores > -0.7 (25th percentile). e HC-2, MoCA > 25 and all NP test scores >-1.3 but one score < -0.7
f HC-3, MoCA < 26 but no NP test scores < -1.3 or MoCA > 25 but one NP test score < -1.3. g Three had evidence of vascular disease; one had a non-vascular cyst.
h Final aMCI criteria: (1) Objective memory impairment on two or more memory tests, using either > -1.5SD (7th percentile) below standardised age-corrected normative data or a profile score of 1 on Rivermead Story Recall (immediate or delayed counted once) or a recall score < 19 on the Adams Selective Reminding Test (delayed recall); (2) at least one impaired one global mental status score from MoCA (<26), DRS-2 (scaled score of <9) and ADAS-Cog (>9); (3) subjective memory complaints by participant or informant on the Clinical Dementia Rating scale; and (4) exclusion of dementia based on CDR < 1.0 plus essentially preserved activities of daily living judged by significant other and / or the researcher interview. Stratified random allocation to intervention or waitlist was based on memory scores, age, plus availability for the initial phase of enrichment.
i HC selected from HC-1 and HC-2 who matched the final aMCI for age, sex and education
j Final HC criteria, MoCA >25, no memory score >-1.5 in sessions 1 and 2 of detailed NP testing, but any single score at -1.5SD on any other test permitted (n = 14 for latter).
k One had a non-vascular cyst; One had evidence of atrophy in the precuneus;
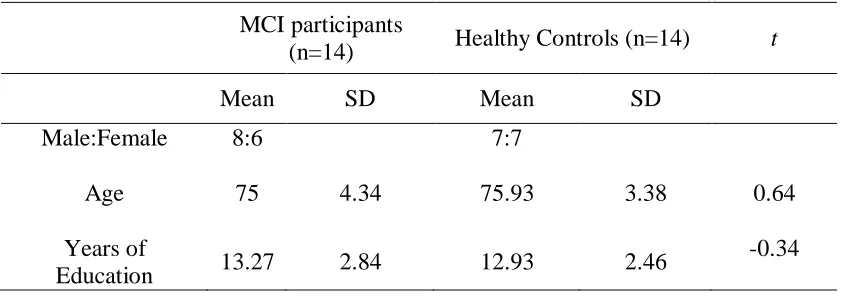
Table 2
Age, Education and Gender of Participants
MCI participants
(n=14) Healthy Controls (n=14) t
Mean SD Mean SD
Male:Female 8:6 7:7
Age 75 4.34 75.93 3.38 0.64
Years of
Education 13.27 2.84 12.93 2.46
-0.34
2.2 Standard Neuropsychological Tests
Before participants completed the AMI they underwent a battery of neuropsychological tests to
assess their cognitive status. As outlined below the battery included tests for global functioning,
tests of learning and memory, executive functioning, attention (including processing speed and
working memory), visuospatial functioning, and language function. Several different tests were
administered for each domain (see fig 1). The tests were administered by a trained member of the
project team in a quiet room at the New Zealand Brain Research Institute (NZBRI).
2.2.1.1 Global Functioning
The Montreal cognitive assessment (MoCA) (Nasreddine et al., 2005), the ADAS-Cog (Sano et
al., 2011), the dementia rating scale (DRS) (Greenaway, Duncan, Hanna, & Smith, 2012), the
clinical dementia rating scale (CDR) (Hughes, Berg, Danziger, Coben, & Martin, 1982) and the
Advanced clinical solutions test of premorbid functioning (TOPF) (Pearson, 2009) were also
2.2.1.2 Learning and Memory
Learning and memory was examined using the short form of the California verbal learning test
(CVLT) (Delis, Kramer, Kaplan, & Ober, 2000), Brief visual memory test (BVMT) (Benedict,
1988), Rey-Osterrieth complex figure (Meyers & Meyers, 1995), Rivermead story recall (Baek
et al., 2011), RI-48 selective reminding test (Hanseeuw & Ivanoiu, 2011), and the visual
association test (VAT).
2.2.1.3 Executive Function
To assess executive function participants completed Trails B , D-KEFS letter fluency test,
category fluency, fluency switching, action fluency (Piatt, Fields, Paolo, & Troster, 2004), colour
word interference (Delis, Kaplan, & Kramer, 2001) and the D-KEFS design fluency (switching).
2.2.1.4 Attention, Processing Speed and Working Memory
This domain included Trails A, Symbol Digit Modality Test (written and oral versions),
Delis-Kaplan stroop task (colour and word naming) (Delis et al., 2001), number cancellation
(ADAS-Cog) and digit span (Wechsler, 2008a, 2008b).
2.2.1.5 Visuospatial Function
Visuospatial functioning was tested using matrix reasoning, the Rey-Osterrieth complex figure
| 17 1975), pentagons and the copy section of the Brief visuospatial memory test (BVMT)(Benedict,
1988).
2.2.1.6 Language
Language was assessed using the Boston naming test (Kaplan, Goodglass, & Weintraub, 1983)
and the token test (Snitz et al., 2009).
2.2.2 Autobiographical Memory Interview (AMI)
Participants were tested using the AMI (Kopelman et al., 1989) after assessment at baseline just
prior to the intended enrichment programme (not part of this master’s thesis). The AMI requires
participants to recall semantic details and autobiographical incidents from three different periods
of time (childhood, early adult life and recent life).Each period is divided into three sub
categories of events that are common to the time period. For example the ‘childhood’ period is
divided into three categories: before school begins, primary school and secondary school’.
Each (sub) section begins with semantic questioning, participants are asked questions
such as the name of the first school the participant attended, dates of children’s birthdays and
where the previous Christmas was spent. Each section contains a question asking for three names
of people present during the period of time, for example names of friends or teachers during
secondary school. Prompts, such as ‘your form teacher?’ were provided if the participant is
unable to answer.
Participants were then asked to provide a specific, detailed autobiographical memory
related to the particular time frame. Prompts such as ‘Involving a teacher?’ were given if the
2.2.3 Source Memory
Source memory was tested using a procedure adapted from (Dodson et al., 2011). During an
encoding phase participants were presented with 30 random trivia sentences both visually (on a
computer screen) and verbally (through speakers) spoken by a male voice or a female voice.
Participants were instructed to pay careful attention to the statement and the voice reading it.
Immediately following the encoding phase participants were tested with 60 sentences, the 30
from the encoding phase and 30 new distractor sentences. After each presentation participants
were given a forced choice recognition new or old. If old was selected, participants were asked if
a male voice or a female voice read the sentence; if new was selected, the next sentence was
presented. After each old/new and male/female decision participants were asked to rate their
confidence level of a scale from 1 to 5, participants were instructed to make full use of the scale.
Five different versions, each with different statements but the same male and female voices, were
created to remove any potential bias created by statements.
2.3 Procedure
This study was approved by the Upper South A Ethics Committee of the New Zealand
Ministry of Health and informed consent was obtained from participants prior to the screening
session.
2.3.1 Neuropsychological Tests
In order to further determine participants’ cognitive status neuropsychological tests were
| 19 Contamination of the memory tests was taken into consideration when the order of test
administration was decided. NP1 and NP2 were held prior to a baseline testing session that
included addition neuropsychological tests. The testing and data collection were performed by
three of the group’s investigators.
2.3.2 Autobiographical and Source Memory
The autobiographical memory interview (AMI) was administered in each participants’ home.
Answers were recorded as close to verbatim as possible and with the permission of each
participant interviews were recorded using a Zoom H4N voice recorder. Each interview lasted
approximately 30 minutes.
The test of source memory was assessed twice, once during NP 2 in a quiet room at the
New Zealand Brain Research Institute and once in participant’s homes during baseline testing.
Participants were randomly assigned one version of the test for NP2 and one of four different
versions of the test (containing different statements) for baseline assessment. Each source
memory assessment took approximately 20 minutes to complete.
2.3.3 Imaging
Participants had an MRI after NP2 and prior to baseline at the NZBRI. Anatomic (T1- and
T2-weighted), functional resting state, and field map images were acquired on a 3 tesla General
Electric HDx scanner with an eight channel head coil. Structural MR images included a
T1-weighted, three-dimensional spoiled gradient echo recalled (SPGR) acquisition (TE/TR=2.8/6.6
ms, TI=400 ms, flip angle=150, acquisition matrix=256×256×170, FOV=250 mm, slice
thickness=1 mm, voxel size=0.98×0.98×1.0 mm3) and a T2-weighted fluid-attenuated inversion
105/9000/2250 ms, 3 mm slices with 1.5 mm gap, 33 slices, FOV = 220 mm, acquisition matrix
= 320 × 320). Resting state functional images were acquired using a two-dimensional gradient
echo, echo planar imaging (EPI) sequence (TE/TR=35/3000ms, flip angle 900,acquisition
matrix=64×64×44, FOV=220mm, slice thickness=3mm, number of slices=44, space between
slices=0mm, voxel size=3.4×3.4×3mm3, interleaved, bottom-top, planned 200 above the anterior
commissure-posterior commissure line). A field map was acquired using two 2D gradient
recalled echo images (TE1/TE2=5.3/7.6ms, TR=475ms) to assist the correction for distortion due
to susceptibility inhomogeneity.
The resting state images are the focus of this thesis. These images were acquired over
8:12 minutes as part of a longer, 1.5-hour scanning session in which several other types of
images were also acquired. During the functional resting state acquisition, participants were
instructed to close their eyes and keep as still as possible throughout the scanning procedure.
2.3.3.1 Preprocessing
In each subject, white matter lesions were quantified using the Lesion Segmentation
Toolbox (LST) (Schmidt et al., 2012). This technique allows automatic detection of T2
hyperintensities based on a T2 FLAIR and T1-weighted image, resulting in a total white matter
lesion (WML) load for each subject (measured in ml). WMLs (which appear hypointense on
T1-weighted SPGR images) were then automatically filled (using LST) on the T1-T1-weighted SPGR
image with intensities of normal appearing white matter to minimize grey matter
| 21
(www.fil.ion.ucl.ca.uk/spm), in Matlab 7.10.0 (R2010a, Mathworks, Massachusetts, USA). After
lesion filling, structural images were intensity bias corrected, tissue classified and registered
using linear and non-linear transformations (DARTEL), within a unified model (Ashburner &
Friston, 2005). GM segments for each subject were modulated using non-linear components of
the normalisation only, thereby preserving actual tissue values locally in order to account for
individual brain size globally.
Using a field map produced using the Fieldmap toolbox in SPM8, functional images were
then realigned (motion-corrected to the first functional volume) and unwarped (to minimise
susceptibility distortions), and a mean functional image was produced. This was followed by
slice timing correction. All functional images for each subject were coregistered the T1-weighted
image using the mean functional image as the source image. Coregistered functional images
were then normalised using the deformation fields generated from the structural registration and
warping process. Finally, normalised resting state images were smoothed with an 8 mm
isotropic Gaussian kernel.
2.3.3.2 Identifying the Default Mode Network
Independent component analysis (ICA) was used to decompose the imaging dataset into a
number of statistically independent spatial maps, each with its own time course (McKeown et al.,
1998). As a result of ICA, the sum of the statistically independent spatial maps, multiplied by the
time courses of each component, approximates the original signal. Group ICA and subsequent
processing were performed following methods set out in Petrella et al. (2011). In short,
preprocessed images were analysed with software for group independent component analysis
http://icatb.sourceforge.net/gift/gift_startup.php). The number of components estimated for each
subject was 25.
To sort which of the 25 components from the ICA represented the DMN, group
components were sorted in GIFT using correlations across voxels with “ref_default_mode”, a
standard DMN template included with the GIFT package. The component with the closest
match to the DMN, that is the highest spatial correlation, was selected. The individual DMN
component maps were then z scored using the following formula:
where are the component weightings, is the mean and is the z scored component
weighting.
To quantify the similarity between the DMN of subjects with MCI and healthy
individuals, a Goodness-of-Fit (GOF) index was calculated. This GOF index was based on a
DMN template derived from the group of healthy controls. First, a one-sample t test of the healthy control subjects’ default mode component was run in SPM8, and results were corrected
for multiple comparisons using a false discovery rate correction (p<0.05) and cluster extent
threshold of 10. Positive values that survived correction for multiple comparisons defined the
DMN template; this healthy template was used to make a binary mask that was in turn used to
| 23 component) outside the mask, among all voxels inside the brain. (Greicius, Srivastava, Reiss, &
Menon, 2004). For display purposes, a similar DMN template for the MCI group was also
created, using a one-sample t test of the MCI subjects’ default mode component.
Chapter 3.
Results
3.1 Descriptive Statistics
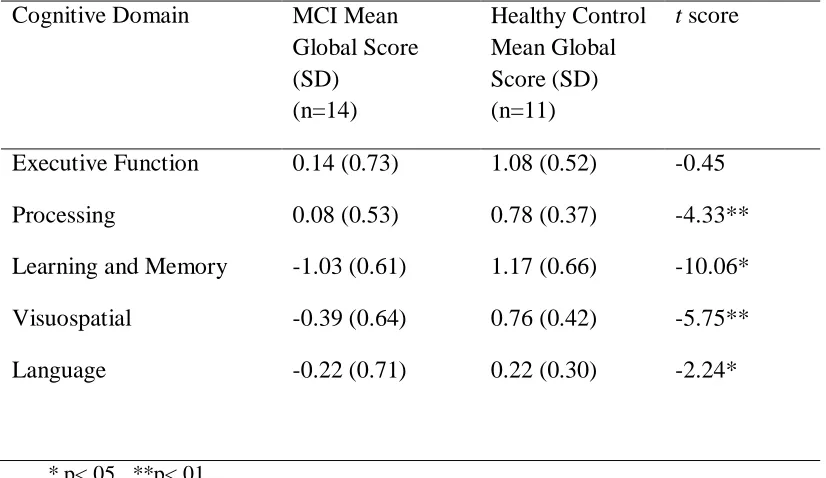
Means (and standard deviation) for various domains (based on aggregate scores within each
domain) of neuropsychological tests for healthy controls and MCI group are shown in table 3.
The healthy control group performed significantly better for the domains of processing speed,
learning and memory, visuospatial ability and language, but not executive function. As expected
[image:29.612.66.479.458.697.2]based on the selection criteria, learning and memory showed the largest between group effect.
Table 3
Means and Standard Deviations of Global Domain Scores for MCI and Healthy Control Participants
Cognitive Domain MCI Mean
Global Score (SD)
(n=14)
Healthy Control Mean Global Score (SD) (n=11)
t score
Executive Function 0.14 (0.73) 1.08 (0.52) -0.45
Processing 0.08 (0.53) 0.78 (0.37) -4.33**
Learning and Memory -1.03 (0.61) 1.17 (0.66) -10.06*
Visuospatial -0.39 (0.64) 0.76 (0.42) -5.75**
Language -0.22 (0.71) 0.22 (0.30) -2.24*
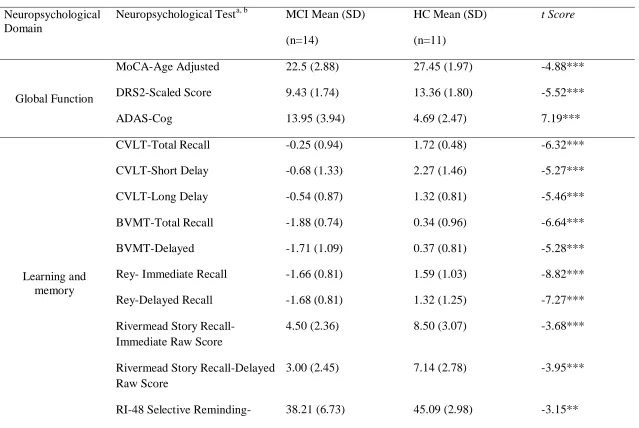
Means and standard deviations for individual neuropsychological tests are displayed in
table 4. Additional assessments were undertaken but the assessments shown are the ones that
Table 4
Means and Standard Deviation of Neuropsychological Test Scores that Determined Cognitive Status for MCI and HC Participants
Neuropsychological Domain
Neuropsychological Testa, b MCI Mean (SD)
(n=14)
HC Mean (SD)
(n=11)
t Score
Global Function
MoCA-Age Adjusted 22.5 (2.88) 27.45 (1.97) -4.88***
DRS2-Scaled Score 9.43 (1.74) 13.36 (1.80) -5.52***
ADAS-Cog 13.95 (3.94) 4.69 (2.47) 7.19***
Learning and memory
CVLT-Total Recall -0.25 (0.94) 1.72 (0.48) -6.32***
CVLT-Short Delay -0.68 (1.33) 2.27 (1.46) -5.27***
CVLT-Long Delay -0.54 (0.87) 1.32 (0.81) -5.46***
BVMT-Total Recall -1.88 (0.74) 0.34 (0.96) -6.64***
BVMT-Delayed -1.71 (1.09) 0.37 (0.81) -5.28***
Rey- Immediate Recall -1.66 (0.81) 1.59 (1.03) -8.82***
Rey-Delayed Recall -1.68 (0.81) 1.32 (1.25) -7.27***
Rivermead Story Recall-Immediate Raw Score
4.50 (2.36) 8.50 (3.07) -3.68***
Rivermead Story Recall-Delayed Raw Score
3.00 (2.45) 7.14 (2.78) -3.95***
Immediate
RI-48 Selective Reminding- Delayed
17.86 (5.95) 30.27 (5.37) -5.40***
VAT -0.93 (0.97) 0 (0) -3.57**
Executive function
Trails B 0.54 (1.16) 1.11 (0.51) -1.54
Letter Fluency 0.19 (1.25) 1.00 (1.78) -1.33
Category Fluency 0.62 (1.23) 2.00 (0.88) -3.15**
Category Fluency-Switching 0.07 (0.88) 1.12 (0.85) -3.01**
Action Fluency 0.02 (0.84) 0.73 (0.47) -2.48*
Stroop-Colour Word Interference
0.21 (1.29) 1.12 (0.45) -2.46*
Design Fluency-Switching 0.19 (1.34) 1.15 (0.89) -2.05
Attention, Processing Speed
and Working Memory
Trails A 0.75 (0.60) 1.34 (0.28) -3.27**
SDMT-Written -0.36 (0.82) 1.09 (0.97) -4.05***
SDMT-Oral -0.50 (0.62) 0.91 (0.80) -4.97***
Stroop-Colour Naming -0.22 (1.09) 0.69 (0.57) -2.51*
| 27
Design Fluency-Empty Dots 0.31 (1.19) 0.64 (0.80) -.078
Visuospatial Function
Matrix Reasoning 0.17 (1.13) 1.12 (1.16) -2.07*
Rey-Copy -1.42 (0.83) 0.09 (0.48) -5.31***
VSOP-Raw Score 18.21 (4.87) 23.55 (3.70) -3.01**
JLO 0.49 (0.58) 0.82 (0.46) -1.52
Pentagons-Raw Score 9.36 (1.34) 9.91 (0.30) -1.34
BVMT-Copy Raw Score 10.93 (1.07) 11.45 (0.52) -1.49
*p<.05, **p<.01, ***p<.001 a For abbreviations see section 2.2
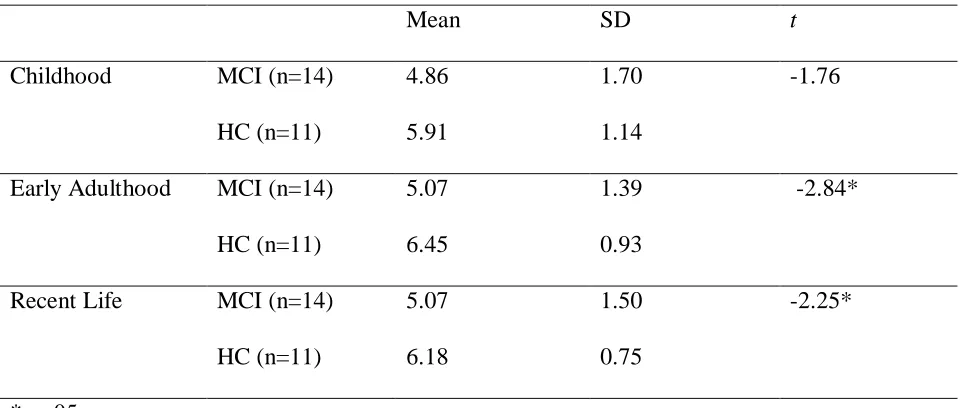
3.2 Autobiographical Memory (AMI)
Table 5
Means, Standard Deviations and t-scores of AMI Episodic scores for MCI and Healthy Control Participants at Each Time Period
Mean SD t
Childhood MCI (n=14) 4.86 1.70 -1.76
HC (n=11) 5.91 1.14
Early Adulthood MCI (n=14) 5.07 1.39 -2.84*
HC (n=11) 6.45 0.93
Recent Life MCI (n=14) 5.07 1.50 -2.25*
HC (n=11) 6.18 0.75
*p<.05
Means (and standard deviation) for episodic autobiographical memory are described in
Table 4. Factorial ANCOVA controlling for age and education showed a main effect of group
with HC participants recalling significantly more detail on episodic autobiographical memory,
F (1,21) = 9.78, p<.01 (Figure 2). There was no significant effect of time period, age or
education on episodic autobiographical memory. There were no significant interactions between
| 29
Fig 2. AVCOVA Showing Differences between Means of Childhood, Early Adulthood
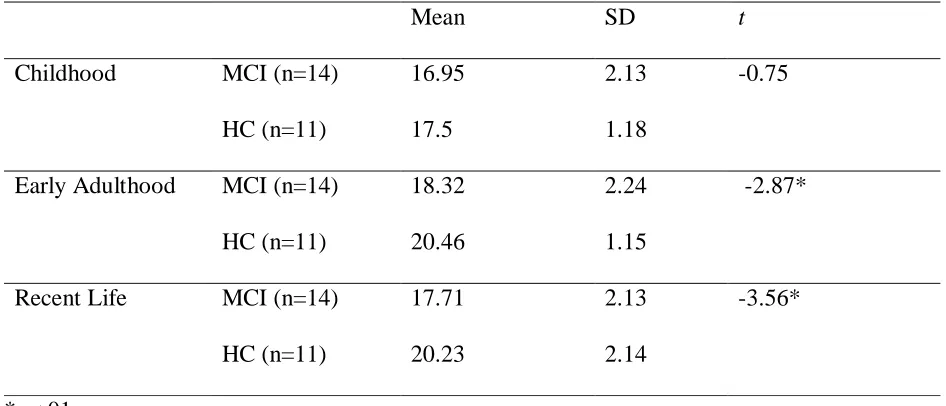
[image:35.612.87.456.149.478.2]Table 6
Means, Standard Deviations and t-scores of AMI Semantic scores for MCI and Healthy Control Participants at Each Time Period
Mean SD t
Childhood MCI (n=14) 16.95 2.13 -0.75
HC (n=11) 17.5 1.18
Early Adulthood MCI (n=14) 18.32 2.24 -2.87*
HC (n=11) 20.46 1.15
Recent Life MCI (n=14) 17.71 2.13 -3.56*
HC (n=11) 20.23 2.14
*p<.01
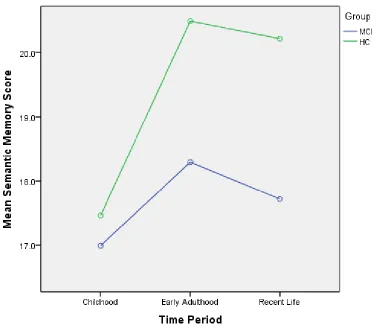
Means (and standard deviations) for semantic memory are described in Table 5. Factorial
ANCOVA was carried out to assess the difference between HC and MCI at each time period for
semantic memory. Results show, controlling for age and education, a main effect of group and
HC participants recalled significantly more detail on semantic autobiographical memory recall
scores, F (1,21) = 9.77, p<.01 (Figure 3). There was no significant effect of time period, age or education on semantic autobiographical memory. A significant interaction was found between
| 31
Fig 3. ANCOVA Showing Differences between Childhood, Early Adulthood and
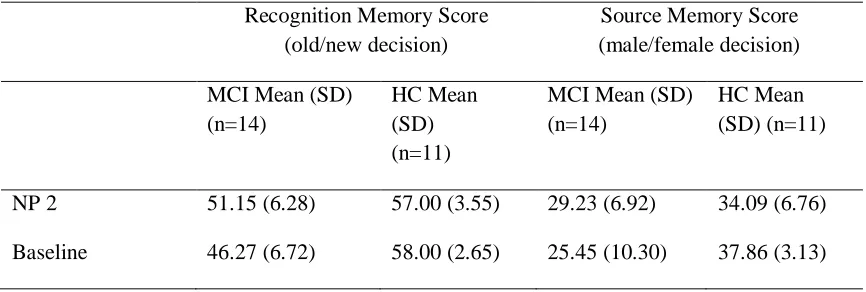
[image:37.612.83.463.148.477.2]3.3 Source Memory
Table 7
Means and Standard Deviations of Number of Correct Responses on Source Memory Measures for HC and MCI Participants
Recognition Memory Score (old/new decision)
Source Memory Score (male/female decision) MCI Mean (SD)
(n=14)
HC Mean (SD) (n=11)
MCI Mean (SD) (n=14)
HC Mean (SD) (n=11)
NP 2 51.15 (6.28) 57.00 (3.55) 29.23 (6.92) 34.09 (6.76)
Baseline 46.27 (6.72) 58.00 (2.65) 25.45 (10.30) 37.86 (3.13)
Means and standard deviations for recognition memory (old/new statement) and source memory
(male/female voice) are presented in table 6. A two tailed t-test for independent means was carried out to determine if HC and MCI differed in their performance of recognition (accuracy of
old/new decision) memory on source memory. Homogeneity of variance was violated, when this
was corrected for a significant difference was found between HC and MCI groups, t=-2.86,
p<.01. A two tailed t-test for independent means was conducted to determine whether there was a difference between HC and MCI performance on recalling if a male or female voice had
previously spoken the statement. Results showed MCI participants performed significantly
poorer at recalling the source of information, t=-2.86, p<.01.
| 33 effect of group was found on both recognition (F(1,16)=19.05, p<.001) and source memory (F(1,16)=7.90, p<.05) showing HC performed significantly better at recalling statements already
seen and if a male or female spoke the statement.
To determine if participants’ performance changed between NP2 and baseline assessment
a one way ANOVA was performed. Results showed participants did not show a change in the
recognition task between NP2 and baseline assessment, F(1,16)=.42, p=.53, n.s. Participants also did not show a difference with identifying the source of information, i.e. the male or female
accuracy, F(1,16)=3.52, p=.08,n.s.
3.4 Default Mode Network
Goodness of fit was used to assess resting state activation of participants default mode network.
D e fa u lt M o d e N e tw o rk G o o d n e ss o f F it I n d e x 0.0 0.5 1.0 1.5 2.0
aMCI Healthy Contols
An ANCOVA with age and education as covariates produced the same results (group,
F(1,24)=5.66, p<.05). Age and education did not show significant correlations with GOF. Voxel-wise differences were evident in all regions of the DMN (Figure 4).
[image:40.612.75.519.124.458.2]| 35
Healthy Control MCI
Posterior
Cingulate Cortex
Medial prefrontal
Right Lateral Temporal Lobe
[image:41.612.97.514.111.644.2]Left Lateral Temporal Lobe
Parahippocampal Gyrus
| 37 Left Angular
[image:43.612.123.508.68.236.2]gyrus
Figure 5. The Default Mode Network (DMN) template identified in the healthy elderly controls derived from the resting state fMRI component that most closely resembled a standard default mode template, following the analytic procedures of Petrella et al (2011). Colour overlay represents regions in the healthy control group that met the criterion of a one-sample t-test corrected for multiple comparisons using the false discovery rate (FDR) error correction (p<0.05) and cluster extent threshold of 10. The cross-hairs display local regions of interest. Right: By contrast, areas of DMN activity in the aMCI group, as defined by a one-sample t-test, FDR-corrected p<0.05, were markedly restricted throughout the brain and evident only in the retrosplenial cortex and parts of the precuneus. In summary, substantially reduced DMN was evident in the aMCI group. A Goodness of Fit Index (GOF) was derived for each individual, expressed by the mean z-score of all voxels within the healthy control DMN template minus the mean z-score of all voxels outside the this mask. Group differences between the GOF index are displayed in Figure 4.
Correlations between the GOF measure and global cognitive domain scores were carried
out. A significant correlation was found between GOF and global learning and memory, r=.41,
p<.05. No significant correlations were found between GOF and global visuospatial (r=.319,
p=.120, n.s.), global executive function (r=.24, p=.26, n.s.), globalprocessing speed (r=.22,
and GOF was preformed, results were not significant (r=.09, p=.67, n.s.) showing no association between recall of episodic memory and default mode network GOF. A correlation between AMI
semantic memory and GOF was performed and a significant result (r=.44, p<.05) showing a moderate association between semantic memory recall and default mode network GOF was
found. Correlations between source memory (male/female voice decision) and GOF for NP2
(r=.24, p=.26, n.s.) and baseline (r=.43, p=.08, n.s. and r=.37, p=.14, n.s. respectively) were all found to be non-significant. The correlation of recognition memory (old/new statement
decision) and GOF was found to be significant, r=.44, p<.05.
Chapter 4.
Discussion
Episodic and semantic autobiographical memory was assessed in both HC and MCI participants
and a significant difference was found between the groups on both measures. The difference
found in episodic autobiographical memory was expected and supports the hypothesis that MCI
participants would have poorer scores relative to HC participants. MCI participants also showed
lower semantic autobiographical memory. As expected, MCI participants also showed
significantly poorer recognition memory for old/new statements as well as poorer source
memory (male/female voice identification). A GOF measure taken of DMN also showed that the
DMN of the MCI has poorer functional connectivity than was evident in the HC participants.
Nonetheless, no significant correlations were found between the GOF measure of the DMN and
episodic or semantic autobiographical memory scores.
| 39 2012), even when more lenient criterion are used. (Leyhe et al., 2009) used a weaker cutoff score
to classify MCI participants and using the AMI found HC participants to be significantly better
at recalling episodic memory. Only two other studies have used the AMI to assess episodic
memory in MCI (Leyhe et al., 2009), these both found similar results to the current study. One of
these studies found a temporal gradient, where more remote events are recalled with greater
detail than recent memories (Leyhe et al., 2009; Tramoni et al., 2012). The hippocampus is
implicated in the consolidation of new memories (Squire, Cohen, & Nadel, 1984), therefore,
deficits in recent memory could be reflective of the hippocampal degeneration found in MCI and
to a greater extent in AD (Celone et al., 2006). An increase in recall is evident in early adulthood
compared with childhood and recent life, an effect called the reminiscence bump, which is a
common finding in other studies examining autobiographical memory (Janssen et al., 2005). The
current study did not find an interaction between group and time showing no significant evidence
of either a temporal gradient or a reminiscence bump, rather the MCI group showed a general
lowering of scores of episodic autobiographical memory recall. The current study did not find
significant effects of time, however, the HC group are following the general trend of the
reminiscence bump and it is possible with more statistical power that this could be a significant
finding. Similar to the current study, neither Leyhe et al. (2009) or Tramoni et al. (2012) found
an effect of a reminiscence bump in their studies, it is possible that this effect does not exist in
MCI groups.
Semantic autobiographical memory was also found to be significantly better in the HC
group than in the MCI group. Results from previous studies have been varied, some show a
relative sparing (Gamboz et al., 2010; Murphy et al., 2008) of semantic memory in aMCI while
studies that examined semantic autobiographical memory function used different tests and it
could be this factor that is producing the inconsistent results. Where the AMI has been used,
studies have shown a decrease in both semantic and episodic memory functioning in MCI groups
(Tramoni et al., 2012), implying that perhaps the AMI is a more sensitive measure of semantic
autobiographical memory. Levine et al. (2002) argues it is not possible to separate episodic from
semantic autobiographical memory, in order to produce a richer narrative both types of memory
are essential. Accordingly, assessing and scoring these two components of autobiographical
memory separately is not possible. The differences found in semantic memory do seem to be
dependent on the type of test administered; the AMI could be artificially finding an effect that is
not actually there. On the other hand tests such as that by Levine may not be sensitive enough.
An effect of time was found where all participants showed worse performance at recalling
childhood semantic autobiographical details compared with early adulthood or recent life. This is
the exact opposite of the temporal gradient that would be expected, however, a reminiscence
bump is evident. A recent study found evidence that the reminiscence bump can apply to
semantic memories as well as episodic autobiographical memories (Janssen, Rubin, & Conway,
2012).
This study found the MCI group to have significantly poorer GOF index of the DMN
compared with the HC group. This finding is reflected in the lower neuropsychological scores,
particularly in the learning and memory domain where there is a correlation with the GOF index.
The GOF index did not correlate with autobiographical memory, this was an unexpected finding
| 41 very clear visual differences (in brain imaging data) between the MCI group and HC group (see
fig 5). Voxel wise differences between the HC group and the MCI group were found in each
major node of the DMN. Visually the voxel-wise differences found in this study seem large, this
could be a result of having highly functioning HC participants (see section 4.1 below). The MTL
has been associated with autobiographical memory function. In the current study decreases in
functional activity and episodic and semantic autobiographical memory in the MCI group were
found, although no correlation was found between the GOF index of the DMN other studies have
found an association between MTL functioning and autobiographical functioning. In a study that
examined both whole-brain and region of interest analysis Jin, Pelak, Curran, Nandy, and
Cordes (2012b) found differences in functional activation between an MCI group and a HC
group, specifically they found decreases in the MTL activity in both encoding and recognition
tasks. Since the current study used resting state MRI and Jin et al. (2012b) used functional MRI
to investigate the DMN the disparity in results could be a function of the type of scan acquired.
Poorer connectivity in the DMN of MCI participants have been found to be predictive of
cognitive decline and progression to AD. Using fMRI Petrella et al. (2011) found GOF indices to be correlated in MCI conversion to AD, those MCI participants with a lower GOF at baseline
were more likely to convert to AD over the course of 2 or 3 years. Unlike the current study
Petrella et al. (2011) used fMRI which affects any conclusions drawn from comparisons with the current study. A recent study that followed participants with AD and MCI for 2 years found MCI
participants that had converted to AD during the 2 year period did not show a significant
difference from AD participants when examining the resting state functional activity in the PCC
and precuneus at initial assessment. Participants with MCI that had stayed stable over time did
although not significantly different, the study also found the regional values of MCI to be in
between HC participants and AD participants (Binnewijzend et al., 2012). Combined these
studies show the possibility of adding MR imaging as part of diagnosis for MCI.
Pronounced effects were found between the HC group and the MCI group on a test of
source memory. MCI were found to be significantly poorer compared with HC participants at
recognition of statement (old/new decision) and at identifying if the male or female had spoken
the statement (or the source of the information). Although there are no other studies that examine
source memory in MCI participants these results would be expected as MCI is an intermediate
stage between normal aging and AD. Individuals with AD have been found to be impaired in
recognition memory (Dalla Barba et al., 1999; Dodson et al., 2011), it is expected that MCI
participants would show this same impairment as the results of the current study do. MCI
participants were also found to be significantly poorer at identifying the source of information,
again AD participants have been found to be impaired in source memory (El Haj et al., 2012)
and it is expected that MCI would also follow this pattern. The current study used a truncated
version of the protocol from Dodson et al. (2011), where the number of statements read for
encoding and the number of distractor statements was smaller and MCI still showed poorer
scores.
4.1 Limitation and Future Directions
The HC participants in this study had been specifically chosen because their cognitive score are
above average (z score above 0). This is particularly evident in the mean scores of the learning
| 43 function of the volunteers available to be included as participants in the study (see fig 1 for
reasons for inclusion/exclusion), for future study a greater variation in participants would
potentially be more representative of the cognitive function of the healthy aging population.
Different studies use a variety of cut-off scores to classify MCI, for example (Leyhe et
al., 2009) used a more lenient cut-off score of <1 and still found the HC group were significantly
better at recalling episodic and semantic autobiographical memory. The current study used a cut
off of <-1.5, which tends to be what most papers use to define MCI (Gamboz et al., 2010;
Murphy et al., 2008), in more than one measure of cognition which reduces any potential false
positives (Ingraham & Aiken, 1996; Jak et al., 2009; Palmer, Boone, Lesser, & Wohl, 1998;
Teng, Tingus, Lu, & Cummings, 2009).
Semantic autobiographical memory has been assessed using three main assessments and
the results found in MCI participants have varied. Only one study has sought to directly
compared different tests of semantic autobiographical memory and it found that the type of test
does have an impact on results (Barnabe, Whitehead, Pilon, Arsenault-Lapierre, & Chertkow,
2012). Thought this comparison was limited to the AMI and Levine’s Autobiographical
Interview, future studies should take into account the differences found between tests.
Source memory has not been studied in MCI previously. Although it was expected (and
found that) this type of memory would follow the same progressive impairment as found in
other types of memory, such as autobiographical, this is as yet unknown and should be explored
more fully including HC, MCI and AD participants in order to draw comparisons.
This study has included a comparison of the main nodes of the DMN, but owing to time
has not been completed. Therefore, although it is possible to see the differences between the HC
group and the MCI group in Figure 5, statistical voxel-wise comparisons were not made. The
goodness of fit index showed that overall connectivity of the DMN was significantly different
between the MCI and HC groups, but clearer differences may be apparent when connectivity in
localised regions are analysed. Similarly, a voxel-based analysis of correlations of connectivity
with AMI scores, even within selected DMN regions such as the medial posterior cortex, might
more clearly show whether autobiographical memory is associated with DMN activity. This is
important for areas such as the medial prefrontal cortex where the MCI group show no resting
state functional activity and the HC group show a small amount of resting state activation.
Continuing to track participants to assess what factors contribute to the progression to dementia
would contribute further to this field of study and should be considered for further research.
4.2 Concluding Remarks
The above study examined autobiographical memory in relation to the default mode
network in HC participants and MCI participants. MCI participants were found to have lower
DMN integrity and to be impaired on both semantic and episodic autobiographical memory
relative to HC participants. The findings of this study support the majority of current research
which show deficits in memory and deterioration in the DMN, and, thereby, evidence is added to
the theory of MCI as a prodromal phase of dementia. Semantic memory should also be directly
compared across the AMI with Levine et al. (2002) and Piolino et al. (2000) assessments,
further comparing these three assessments in HC participants, MCI participants and also AD
| 45
Chapter 5. References
Ashburner, J., & Friston, K. J. (2005). Unified segmentation. Neuroimage, 26(3), 839-851. doi: 10.1016/j.neuroimage.2005.02.018
Baek, M. J., Kim, H. J., Ryu, H. J., Lee, S. H., Han, S. H., Na, H. R., . . . Kim, S. (2011). The
usefulness of the story recall test in patients with mild cognitive impairment and
Alzheimer's disease. Neuropsychol Dev Cogn B Aging Neuropsychol Cogn, 18(2), 214-229. doi: 10.1080/13825585.2010.530221
Barnabe, A., Whitehead, V., Pilon, R., Arsenault-Lapierre, G., & Chertkow, H. (2012).
Autobiographical memory in mild cognitive impairment and Alzheimer's disease: A
comparison between the Levine and Kopelman interview methodologies. Hippocampus, 22(9), 1809-1825. doi: 10.1002/hipo.22015
Benedict, R. H. B. (1988). Brief Visuospatial Memory Test-Revised. Lutz, Florida, USA: PAR. Benton, A., Hannay, J., & Varney, N. R. (1975). VISUAL-PERCEPTION OF LINE
DIRECTION IN PATIENTS WITH UNILATERAL BRAIN DISEASE. Neurology,
25(10), 907-910.
Binnewijzend, M. A., Schoonheim, M. M., Sanz-Arigita, E., Wink, A. M., van der Flier, W. M.,
Tolboom, N., . . . Barkhof, F. (2012). Resting-state fMRI changes in Alzheimer's disease
and mild cognitive impairment. Neurobiol Aging, 33(9), 2018-2028. doi: S0197-4580(11)00270-3 [pii] 10.1016/j.neurobiolaging.2011.07.003
Buckner, R. L., Andrews-Hanna, J. R., & Schacter, D. L. (2008). The brain's default network:
Celone, K. A., Calhoun, V. D., Dickerson, B. C., Atri, A., Chua, E. F., Miller, S. L., . . . Sperling,
R. A. (2006). Alterations in memory networks in mild cognitive impairment and
Alzheimer's disease: An independent component analysis. Journal of Neuroscience, 26(40), 10222-10231. doi: 10.1523/jneurosci.2250-06.2006
Clark, Robert E., & Squire, Larry R. (2010). An animal model of recognition memory and
medial temporal lobe amnesia: History and current issues. Neuropsychologia, 48(8), 2234-2244. doi: http://dx.doi.org/10.1016/j.neuropsychologia.2010.02.004
Dalla Barba, G., Nedjam, Z., & Dubois, B. (1999). Confabulation, executive functions, and
source memory in Alzheimer's disease. Cognitive Neuropsychology, 16(3-5), 385-398. Delis, D. C., Kramer, J. H., Kaplan, E., & Ober, B. A. (2000). California Verbal Learning Test
(2nd ed.). San Antonio, Texas: Pschological Corporation.
Delis, D., Kaplan, E., & Kramer, J. (2001). Delis-Kaplan Executive Function Scale (D-KEFS). San Antonio, Texas: The Psychological Corporation.
Dodson, C. S., Spaniol, M., O'Connor, M. K., Deason, R. G., Ally, B. A., & Budson, A. E.
(2011). Alzheimer's disease and memory-monitoring impairment: Alzheimer's patients
show a monitoring deficit that is greater than their accuracy deficit. Neuropsychologia, 49(9), 2609-2618. doi: S0028-3932(11)00254-5 [pii]
10.1016/j.neuropsychologia.2011.05.008
El Haj, M., Fasotti, L., & Allain, P. (2012). Source monitoring in Alzheimer's Disease. Brain and Cognition, 80(2), 185-191. doi: 10.1016/j.bandc.2012.06.004
| 47 Gamboz, N., De Vito, S., Brandimonte, M. A., Pappalardo, S., Galeone, F., Iavarone, A., &
Della Sala, S. (2010). Episodic future thinking in amnesic mild cognitive impairment.
Neuropsychologia, 48(7), 2091-2097. doi: 10.1016/j.neuropsychologia.2010.03.030 S0028-3932(10)00131-4 [pii]
Gauthier, S., Reisberg, B., Zaudig, M., Petersen, R. C., Ritchie, K., Broich, K., . . . Winblad, B.
(2006). Mild cognitive impairment. Lancet, 367(9518), 1262-1270. doi: S0140-6736(06)68542-5 [pii] 10.1016/S0140-S0140-6736(06)68542-5
Greenaway, M. C., Duncan, N. L., Hanna, S., & Smith, G. E. (2012). Predicting functional
ability in mild cognitive impairment with the Dementia Rating Scale-2. Int Psychogeriatr, 24(6), 987-993. doi: 10.1017/s1041610211002717
Greicius, M. D., Srivastava, G., Reiss, A. L., & Menon, V. (2004). Default-mode network
activity distinguishes Alzheimer's disease from healthy aging: evidence from functional
MRI. Proc Natl Acad Sci U S A, 101(13), 4637-4642. doi: 10.1073/pnas.0308627101 0308627101 [pii]
Hafkemeijer, A., van der Grond, J., & Rombouts, Sarb. (2012). Imaging the default mode
network in aging and dementia. Biochimica Et Biophysica Acta-Molecular Basis of Disease, 1822(3), 431-441. doi: 10.1016/j.bbadis.2011.07.008
Hanseeuw, B, & Ivanoiu, A. (2011). Performance on the RI-48 Cued Recall Test Best Predicts
Conversion to Dementia at teh 5- and 10-Year Follow-Ups. Dementia and Geriatric Cognitive Disorders Extra, 1, 258-266.
Hughes, C. P., Berg, L., Danziger, W. L., Coben, L. A., & Martin, R. L. (1982). A new clinical
Ingraham, L. J., & Aiken, C. B. (1996). An empirical approach to determining criteria for
abnormality in test batteries with multiple measures. Neuropsychology, 10(1), 120-124. doi: 10.1037/0894-4105.10.1.120
Irish, M., Lawlor, B. A., O'Mara, S. M., & Coen, R. F. (2010). AUTOBIOGRAPHICAL
MEMORY IN AMNESTIC MILD COGNITIVE IMPAIRMENT: EXPLORATION OF
AUTONOETIC CONSCIOUSNESS AND CONTEXT-DEPENDENT MEMORY. Irish
Journal of Medical Science, 179, S122-S122.
Jak, A. J., Bondi, M. W., Delano-Wood, L., Wierenga, C., Corey-Bloom, J., Salmon, D. P., &
Delis, D. C. (2009). Quantification of Five Neuropsychological Approaches to Defining
Mild Cognitive Impairment. American Journal of Geriatric Psychiatry, 17(5), 368-375. doi: 10.1097/JGP.0b013e31819431d5
Janssen, S. M. J., Chessa, A. G., & Murre, J. M. J. (2005). The reminiscence bump in
autobiographical memory: Effects of age, gender, education, and culture. Memory, 13(6), 658-668. doi: 10.1080/09658210444000322
Janssen, S. M. J., Rubin, D. C., & Conway, M. A. (2012). The reminiscence bump in the
temporal distribution of the best football players of all time: Pele, Cruijff or Maradona?
Quarterly Journal of Experimental Psychology, 65(1), 165-178. doi: 10.1080/17470218.2011.606372
Jin, M., Pelak, V. S., & Cordes, D. (2012a). Aberrant default mode network in subjects with