R E S E A R C H A R T I C L E
Open Access
Optimised laser microdissection of the human
ocular surface epithelial regions for microarray
studies
Bina B Kulkarni
1, Desmond G Powe
2, Andrew Hopkinson
1and Harminder S Dua
1*Abstract
Background:The most important challenge of performinginsitutranscriptional profiling of the human ocular surface epithelial regions is obtaining samples in sufficient amounts, without contamination from adjacent tissue, as the region of interest is microscopic and closely apposed to other tissues regions. We have effectively collected ocular surface (OS) epithelial tissue samples from the Limbal Epithelial Crypt (LEC), limbus, cornea and conjunctiva of post-mortem cadaver eyes with laser microdissection (LMD) technique for gene expression studies with spotted oligonucleotide microarrays and Gene 1.0 ST arrays.
Methods:Human donor eyes (4 pairs for spotted oligonucleotide microarrays, 3 pairs for Gene 1.0 ST arrays) consented for research were included in this study with due ethical approval of the Nottingham Research Ethics Committee. Eye retrieval was performed within 36 hours of post-mortem period. The dissected corneoscleral buttons were immersed in OCT media and frozen in liquid nitrogen and stored at−80°C till further use. Microscopic tissue sections of interest were taken on PALM slides and stained with Toluidine Blue for laser microdissection with PALM microbeam systems. Optimisation of the laser microdissection technique was crucial for efficient and cost effective sample collection.
Results:The starting concentration of RNA as stipulated by the protocol of microarray platforms was taken as the cut-off concentration of RNA samples in our studies. The area of LMD tissue processed for spotted oligonucleotide microarray study ranged from 86,253μm2in LEC to 392,887μm2in LEC stroma. The RNA concentration of the LMD samples ranged from 22 to 92 pg/μl. The recommended starting concentration of the RNA samples used for Gene 1.0 ST arrays was 6 ng/5μl. To achieve the desired RNA concentration the area of ocular surface epithelial tissue sample processed for the Gene 1.0 ST array experiments was approximately 100,0000μm2to 130,0000μm2. RNA concentration of these samples ranged from 10.88 ng/12μl to 25.8 ng/12μl, with the RNA integrity numbers (RIN) for these samples from 3.3 to 7.9. RNA samples with RIN values below 2, that had failed to amplify satisfactorily were discarded.
Conclusions:The optimised protocol for sample collection and laser microdissection improved the RNA yield of theinsituocular surface epithelial regions for effective microarray studies on spotted oligonucleotide and affymetrix platforms.
Keywords:Ocular surface epithelium, PALM laser microdissection, Limbal epithelial crypt, Limbus, Cornea, Spotted oligonucleotide microarrays, Gene 1.0 ST array
* Correspondence:[email protected] 1
Division of Ophthalmology and Visual Sciences, B-Floor, Eye & ENT Building, Queen’s Medical Centre, Derby Road, Nottingham, UK
Full list of author information is available at the end of the article
Background
Human donor eyes are important source of tissue for re-search into pathogenesis, treatment and prevention of dis-ease [1,2]. Obtaining samples of pure cell population is crucial for transcriptomics studies, as contamination with other adjacent cell populations leads to increased bio-logical noise in the microarray data, which interferes with the detection signals from genes of interest in the tissue samples [3]. Laser microdissection (LMD) allows precise collection of cell populations of interest from heteroge-neous tissue and preserves the purity and integrity of RNA samples. This is crucial for the accuracy of the microarray results to determine significant differences in gene expres-sion between treatment and control groups [4].
An oligonucleotide microarray was successfully per-formed on laser microdissected tissue samples by Ohyama Het al.in 2000 [5]. A study on laser microdis-sected breast tissue samples by Cowherd et al. in 2004 showed that the technical variability introduced by amp-lification and hybridisation experiments is smaller than the actual biological variation for different types of breast cancer tissues demonstrated with differential gene expression in these samples [6]. Samples for trans-criptional profiling studies on epidermal basal cells, endometriosis tissue, and osteocytes were successfully collected with“Positioning and Ablation in Laser Micro-dissection” (PALM®) microbeam systems (PALM Micro-laser Technologies GmbH) [7]. This technique grew in popularity as it allowed precise dissection of tissues under direct visualisation by a non-contact technique.
Principle of LMD technology
PALM® microbeam system was used for collection of samples by the non-contact method of pressure cata-pulting in this study. This system uses a class 1 M UV-A cutting pulsed nitrogen laser (337 nm wavelength) coupled to an inverting microscope, which is focused as 1μm spot diameter laser beam via the objective lens on the tissue specimen fixed on a PALM® slide coated with polyethylene-naphthalate (PEN) membrane. The PEN membrane facilitates LMD and separation of biological materials such as histological sections, cytospins, cell smears and cell cultures from the slide surface with preservation of the collected tissue morphology [8]. The advantage of this membrane is that it does not interfere with molecular procedures including nucleic acid extrac-tion and amplificaextrac-tion. However, the disadvantage of PEN membrane slide is that it cannot be covered with a cover slip therefore, the tissue morphology is difficult to visualise compared to the embedded sections. The laser beam fuses the PEN membrane to the tissue during ab-lation leading to effective catapulting of the tissue into the collection tube cap with the RoboLPC laser function as the membrane and the tissue acts as a single unit.
Laser cutting involves rapid photodecomposition of the tissue in focus; however, the out of focus surrounding tissue is unaffected by heat [9,10]. This unfocussed laser light gets scattered in the surrounding tissue without transfer of the heat energy to the nucleic acids and pro-teins of the tissue of interest and protects the tissue from the laser burns [11]. This feature maintains the tis-sue viability of the collected samples [12-14]. Laser cata-pulting prevents contamination of the tissue by avoiding physical contact with the specimen (Figure 1). Similarly, LMD of other ocular tissues could be performed follow-ing appropriate sample preparation. Prior to beginnfollow-ing complex downstream molecular experiments on the LMD samples it is crucial to perform a pilot study for optimisation of the sample processing and LMD with the aim to consistently achieve RNA samples of ad-equate quality and quantity for successful downstream analysis and to evaluate feasibility, reliability and cost ef-fectiveness of the procedure. Determining the RNA quality and quantity of the samples would help with planning of the experimental design including appropri-ate selection of suitable microarray platform and the number of biological replicates required for the study.
[image:2.595.304.539.444.632.2]This article describes in details, the methodology of obtaining laser microdissected RNA samples from the human OS epithelial regions such as the cornea, limbus, conjunctiva and Limbal Epithelial Crypt (LEC) for tran-scriptional profiling with consideration of factors influ-encing the quantity and quality of these samples such as
staining procedure, duration of LMD and the area of tis-sue dissected.
Methods
Materials and supplies
15 mm trephine
2% v/v povidone-iodine solution
Optimum temperature compound (OCT, Emitech Ltd, East Sussex, England)
Absolute ethanol
Jung CM 1900 cryostat (Leica Microsystems Ltd., Milton Keynes, UK)
Isopentane
PALM® collection tube (PALM, Bernried, Germany; Product code 1440–1000)
70% v/v ethanol
RNase free 0.1% w/v Toluidine Blue
0.1% diethyl pyrocarbonate (DEPC) treated water 1%β-Mercaptoethanol (Sigma Aldrich, Gmbh, Germany) RNeasy Micro kit (Qiagen, West Sussex, UK)
PALM Membrane slides (PALM # 1440–1000)
LPC Microfuge tubes, 2 mm rim, 500 μl (PALM # 1440–0200)
Latex disposable gloves PBS
11 mm scalpel blade
Cryospray (Cell Path Ltd, UK)
Ambion® Message Amp™II aRNA Amplification Kit NuGen WT-Ovation™Pico RNA Amplification System
Ethical approval and retrieval of the cadaver eyes
This research project was approved by the Nottingham Research Ethics Committee and the Research and De-velopment department of the Nottingham University Hospitals National Health Service Trust. Donor eyes not used for transplantation but also consented for re-search by the relatives of the deceased, and eyes har-vested for research purpose only were included in the study. Retrieval of the cadaver eyes was performed with conventional techniques within 24 to 36 hours of death to maintain the cellular RNA viability of the OS epithe-lium. Processing of the tissues following prolonged post mortem interval could affect the quality of the samples due to degradation of tissue RNA and drying of the OS epithelium following atmospheric exposure. Quality of the OS epithelium in the donor eyes was assessed with the dissecting microscope prior to the tissue preservation.
The inclusion criteria for donor eyes was: i) Donor age between 20 to 70 years; ii) Donors of either sex; and iii) Eyes with healthy OS epithelium. Donor eyes selected for research were logged in an eye tissue database for use in the study.
Ocular tissue processing and preservation
To prevent RNase contamination of the donor tissue the following precautions were taken; cleaning bench tops and lab equipment with Trigene and Ethanol (EtOH), use of disposable gloves, sterile disposable instruments, petridi-shes and blades. Whole eyeball supported on an eye stand was cleaned by immersing in 2% v/v povidone-iodine solution for two mins, followed by a sterile PBS wash. A corneoscleral button with 3 mm frill of conjunctiva sur-rounding the limbus, to include palisades of Vogt and LEC was dissected from the cadaver eye with a 15 mm tre-phine [15]. The corneoscleral button was placed in a pet-ridish with PBS to prevent drying of the OS epithelium and cut radially into eight triangular segments with a dis-posable scalpel blade. Handmade aluminum foil cups of approximately 20 mm diameter were filled with an em-bedding medium optimum temperature compound (OCT, Emitech Ltd, East Sussex, England). Each triangular seg-ment of corneoscleral button was oriented in the OCT compound, in such a way that one of the long edges of the triangle was parallel to the surface of the OCT medium and short edge perpendicular to the superficial edge. Fro-zen tissue blocks were prepared by immersing the OCT embedded tissue in Isopentane bath pre-chilled (frozen) in liquid nitrogen. Frozen blocks were stored at −80°C till further use.
Cryosectioning
Cryosectioning was performed with the Jung CM 1900 cryostat (Leica Microsystems Ltd., Milton Keynes, UK). Collection and processing of the tissue including RNA extraction was performed under RNase free conditions. Thorough cleaning of the cryostat chamber was per-formed with absolute EtOH and acetone prior to use for prevention of tissue contamination. The tissue sections of interest were taken on PALM slides and fixed for 5 mins in 70% EtOH pre-chilled in the cryostat. The slides were then air-dried briskly and placed in a pre-chilled slide box for storage at−80°C for LMD.
Pre laser microdissection processing of tissue sections
Immediately, prior to LMD, cryosections on the PALM slides were thawed on ice and stained with RNase free 0.1% w/v Toluidine Blue dye for 30 seconds, by pipetting approximately 200 μl of the dye over each of the tissue section. The stained slides were then rinsed twice in 0.1% diethyl pyrocarbonate (DEPC) treated water and air dried for 5 mins.
Laser microdissection (LMD)
dissection microscope. The area of interest in the tissue section was brought into focus at 10X magnification within 1μm precision by the computer controlled move-ment of the Robostage. Following which, the area of inter-est in the tissue section was brought to focus at 20X magnification on the computer monitor connected to the microscope and delineated using a computer graphic tool
(Figure 2). The cap of a sterile PALM® collection tube (PALM, Bernried, Germany; Product code 1440–1000) at-tached to the motorised PALM® cap mover was then over hung over the area of tissue section under focus.
The laser parameters such as the focal diameter of the beam, magnification and numerical aperture of the ap-plied objective lens were adjusted for efficient results.
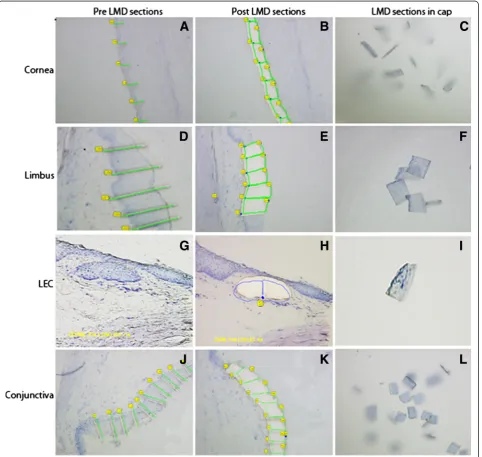
Figure 2Laser Microdissection of OS epithelial regions.The histological OS epithelial sections used for LMD were stained with toluidine blue dye. All the images in the composite are at 20x magnification. Composite shows tissue sections in different stages of LMD. ImagesA,DandJ
The length of the OS epithelial region was divided per-pendicularly into smaller segments with the cut function of the laser (Figure 2A, D and J). The cuts were ex-tended lengthwise for complete dissection of the area of interest. Following this, the whole tissue fragment was catapulted in the cap of the collection tube with RoboLPC function, which is a combination of LMD and pressure catapulting (Figure 2B, E, H and K). In the col-lection tube the tissue segment sticks to the thermo-stable membrane at the base of the cap. In case a segment failed to eject into the collection tube, the mis-directed piece of tissue was catapulted into the collec-tion tube with the auto Laser Pressure Catapulting function (LPC). On completion of LMD, the collection tube was moved directly over the objective lens using the joystick to check for the catapulted specimens in the collection cap (Figure 2C, F, I and L). Thereafter the col-lection tube was removed and 300μl of RNA lysis buffer (RLT) (RNeasy Micro kit, Qiagen) containing 1% β-Mercaptoethanol (Sigma Aldrich, Gmbh, Germany) was added to the tube, the collection tube cap was closed, and the tube sealed with parafilm to prevent contamination during storage. The tube was inverted, briefly vortexed and incubated at room temperature (RT) for 20 mins, to lyse the tissue cells sticking to the roof of the cap and release the RNA. Subsequently the RLT tubes were stored at−80°C until further use.
Histological identification of OS epithelium
To perform precise dissection of the OS epithelial regions it is crucial to identify the histological landmarks demarcat-ing one zone from the other. Corneal epithelium is charac-terised by flat basal layer supported by refractile Bowman’s membrane (Figure 3A). The end of the Bowman’s mem-brane marks the termination of the corneal epithelium and beginning of the limbal epithelium (Figure 3B). The limbal
epithelium appears wavy with convolutions due to the loss of support to the basal epithelium. The limbal epithelium is thicker than the corneal epithelium and consists of 10 to 12 layers. The limbal basal epithelial cells are smaller and round with increased nucleus to cytoplasm ratio as com-pared to the corneal basal epithelium (Figure 3A and B). Microscopic examination of limbal stroma reveals the pres-ence of blood vessels in this region, compared to the avas-cular corneal stroma. The LEC is a solid cord of cells that extends either parallel or perpendicular from the peripheral aspect of the under surface of limbal palisade of Vogt, into the limbal stroma. LECs vary in size, shape and location around the limbus. Depending on their sizes LECs have been categorised as minor (<40 μm) or major (>40 μm). The junction between limbus and the conjunctiva is marked as a constriction in the OS epithelium, due to change in the limbal epithelial thickness from 10–12 cells to a thickness of 2–5 cells of conjunctival epithelium. The epithelial surface of the conjunctiva is irregular and ragged. Presence of goblet cells in the epithelium is also a feature for identification and confirmation of the conjunctival tis-sue. Compared to the limbal stroma the conjunctival stro-ma has dense infiltration of cells along with the presence of accessory lacrimal glands in this region. For precise LMD it is preferable to avoid junctional areas between two regions.
RNA extraction
Total RNA extraction of LMD tissue was performed with RNeasy Micro kit, according to the manufacturer’s protocols (Qiagen, West Sussex, UK). Each sample was made up to 350μl with RLT buffer (activated with 10μl ofβ-Mercaptoethanol per 1 ml of buffer RLT).
Results
[image:5.595.56.541.537.635.2]This section mainly presents the effect of optimisation of LMD technique with consideration to cryopreservation of
the tissue, thickness of the cryosections taken on PALM slides, fixation technique and tissue staining.
Optimisation of sample processing for LMD
Optimisation of the sample preparation and LMD tech-nique was crucial for efficient time and cost manage-ment of the project. Practically all the steps of the LMD were optimised, and their effectiveness observed. The findings are described below.
Freezing of tissue blocks
The tissue processing for LMD was performed taking care to preserve the RNA integrity of the processed tis-sue. On histological examination, it was noted that tissue sections of tissue blocks snap frozen in liquid Nitrogen developed cracks or freeze fractures. This compromised the tissue quality due to which the tissue had to be discarded. To avoid this problem controlled gradual freezing of the tissue was performed in Isopentane pre-chilled in liquid Nitrogen.
Thickness of the cryosections
Following optimisation of tissue thickness, cryosections of 6μm thickness were found to be effective for LMD. It was noted that thin sections (< 6 μm) folded easily or tore while transferring on to the slides. This made the OS epithelium inaccessible to LMD and the affected tis-sue sections had to be discarded. On the other hand, thick sections (> 6 μm) were easily lost and fell off the slide during fixation and washes. It was also noted that during LMD the thick sections did not catapult effect-ively into the collection cap and got lost or misdirected over the surrounding tissue.
Consistent fixation of tissue sections to the slides and preservation of morphology of OS epithelial regions was achieved with 70% EtOH pre-chilled at−20°C.
Number of sections on each slide
The influence of the number of tissue sections on the PALM slide was investigated using 1–6 sections per slide. It was noted that, more than 5 sections caused crowding of the tissue sections on the slide leading to overlapping. This resulted in loss of tissue for LMD and less RNA yield. Taking 1 to 2 sections per slide did not have an adverse ef-fect on the RNA quality; but this was not cost efef-fective. However, the cost effectiveness was maximised by taking 3 to 4 tissue sections on the PALM slide.
Processing of the tissue sections for LMD
Pre LMD tissue section staining was performed with RNase free toluidine blue dye in combination with DEPC treated water (RNase free) for better identification of tissue morphology without compromising RNA integ-rity [16]. To maintain the integinteg-rity of the tissue RNA,
LMD of the toluidine stained tissue sections was per-formed within 3 hours of the staining.
Optimisation of the laser function for LMD
Adjustment of the laser settings at the beginning of the LMD is crucial for efficient LMD. This was achieved by positioning the slide on the robostage with 40X magnifica-tion and the stromal tissue furthest away from the epithe-lium, was brought into focus. A freehand drawing tool element was selected on the graphics toolbar, and an out-line was drawn on the stromal side of the section. The laser speed was set to slow, following which the laser was activated by selecting the laser icon on the computer win-dow screen. The UV energy, laser focus and laser speed were all adjusted and optimised until a thin white laser cut line was achieved. The laser adjustments also depended on the thickness of the tissue and the degree of hydration. In the current study, the laser settings for OS epithelial regions were as follows: UV energy 58-70 μJ, UV focus 75-80μm, and UV speed 60-70μm2/sec. Optimisation of the energy, focus and speed of the laser beam prior to LMD was found to be crucial for effective LMD. At high settings of the laser power (>75μJ) singing or burning of the surrounding tissue was noted. In these circumstances, there was increasing possibility that laser might burn the adjacent epithelial cell layer during LMD, hence adversely influencing the molecular composition of the cells. When mild laser beam power was applied (<50μJ) the tissue was not effectively cut, nor was successfully catapulted into the collection tube, thus requiring repeat laser. The areas of epithelium dissected for different samples ranged from ap-proximately 80,000μm2to 300,000μm2depending on cel-lular density, which varied between epithelial regions. The minimal cut off of 80,000μm2was determined by optimis-ing the LMD tissue area (71,284μm2) required to obtain adequate RNA sample for successful semi-quantitative PCR analysis of Hypoxanthine Phosphoribosyltransferase 1 (HPRT1). In this study, no relationship was noted be-tween the area of LMD tissue processed and the RNA concentration obtained, due to variable cellular density of each region (Table 1).
LEC had the highest density of cells and yielded a good concentration of RNA inspite of variations in num-ber and sizes of LEC laser microdissected. However, the LEC stroma had sparse distribution of cells hence large areas from this region were laser microdissected to ob-tain sufficient concentrations of RNA.
Optimisation of LMD tissue for Oligonucleotide microarray experiments
including the labelled probes of all the LMD samples processed in this microarray study. It also includes the concentration values of the reference probes (SP) and the concentrations of labelled extracts of samples and the Standard Probes with the Frequency of Incorporation (FOI) of the dyes in these samples. The labelled probes of the samples were matched to the Standard Probe with similar FOI to generate hybridised probes.
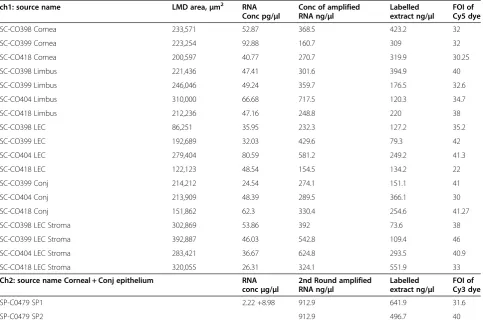
The area of LMD tissue processed for spotted oligo-nucleotide microarray study ranged from 86,253 μm2in LEC to 392,887μm2in LEC stroma (Table 1). RNA con-centration of LEC samples measured with Agilent bioa-nalyser was found comparable to other regions in spite of small LMD area due to high cellular density in this re-gion. In our experiments LMD samples of 80,000 to 300,000 μm2 yielded RNA concentrations of 22 to 92 pg/μl (Table 1). Samples of adequate concentration are crucial for microarray experiments. This was faci-litated with use of Ambion® Message Amp™ II aRNA Amplification Kit which amplified as little as 100 pg of input RNA up to 1000 folds for Gene Chip® analysis as our samples fulfilled the optimal concentration required
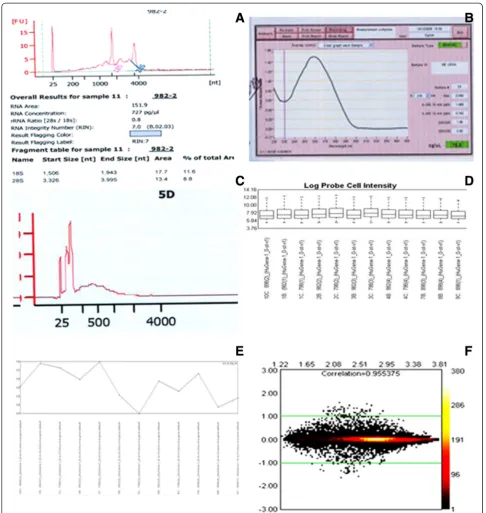
by this kit for further processing. According to manufac-turer’s protocol we had optimised the starting RNA con-centration of all the samples to 0.2 ng/10 μl for spotted oligonucleotide microarray study. The samples were again evaluated after each amplification round with quality control checks by NanoDrop ND-1000 UV–vis Spectrophotometer (Labtech International Ltd–UK), (Figure 4A) [17]. Samples with low 260/280 and 230/280 ratios (<1.8) were excluded from the study due to pos-sible contamination with proteins and organic conta-minants respectively. Unsatisfactorily amplified samples with low RNA concentrations and poor graph curves were also omitted from further processing [18]. The concentration of the labelled aRNA and FOI of the Cy5 and Cy3 dyes were measured using Nanodrop spectro-photometer. Labelled probes demonstrating optimal FOI between 30–60 incorporated dye molecules per 1000 nu-cleotides were included in the study (Table 1, Figure 4B).
Validation of RNA viability with semi quantitative PCR
[image:7.595.57.541.111.434.2]Gel electrophoresis showed prominent expression of 18 s rRNA in all the cDNA samples studied. The bands Table 1 Details of samples processed for spotted microarray showing LMD area, corresponding concentration, of unamplified, amplified and labelled RNA samples with FOI values
ch1: source name LMD area,μm2 RNA
Conc pg/μl
Conc of amplified RNA ng/μl
Labelled extract ng/μl
FOI of Cy5 dye
SC-CO398 Cornea 233,571 52.87 368.5 423.2 32
SC-CO399 Cornea 223,254 92.88 160.7 309 32
SC-CO418 Cornea 200,597 40.77 270.7 319.9 30.25
SC-CO398 Limbus 221,436 47.41 301.6 394.9 40
SC-CO399 Limbus 246,046 49.24 359.7 176.5 32.6
SC-CO404 Limbus 310,000 66.68 717.5 120.3 34.7
SC-CO418 Limbus 212,236 47.16 248.8 220 38
SC-CO398 LEC 86,251 35.95 232.3 127.2 35.2
SC-CO399 LEC 192,689 32.03 429.6 79.3 42
SC-CO404 LEC 279,404 80.59 581.2 249.2 41.3
SC-CO418 LEC 122,123 48.54 154.5 134.2 22
SC-CO399 Conj 214,212 24.54 274.1 151.1 41
SC-CO404 Conj 213,909 48.39 289.5 366.1 30
SC-CO418 Conj 151,862 62.3 330.4 254.6 41.27
SC-CO398 LEC Stroma 302,869 53.86 392 73.6 38
SC-CO399 LEC Stroma 392,887 46.03 542.8 109.4 46
SC-CO404 LEC Stroma 283,421 36.67 624.8 293.5 40.9
SC-CO418 LEC Stroma 320,055 26.31 324.1 551.9 33
Ch2: source name Corneal + Conj epithelium RNA concμg/μl
2nd Round amplified RNA ng/μl
Labelled extract ng/μl
FOI of Cy3 dye
SP-C0479 SP1 2.22 +8.98 912.9 641.9 31.6
SP-C0479 SP2 912.9 496.7 40
were not expressed in negative control samples. This re-sult supports the absence of nonspecific PCR rere-sults and that sufficient RNA was obtained from LMD tissue for efficient and accurate amplification of the gene. How-ever,18 s rRNAis an abundantly transcribed gene; hence it easily amplifies, the gel electrophoresis result had shown expression of intense bands with different areas of LMD samples (Figure 5A).HPRT1was more sensitive for accessing the RNA quality as it is a constitutively expressed housekeeping gene with low copy numbers (1–10 molecules/cell). Electrophoresis ofHPRT1showed PCR amplification bands in all the samples at 159 Base Pair Sequence (BPS) of DNA ladder with absent expres-sion in negative control sample (Figure 5B).
Optimisation of LMD tissue for Gene 1.0 ST array
Gene 1.0 ST array experiments and real time PCR experi-ments for validation of endogenous control genes in the OS epithelial regions were performed with amplification of laser microdissected samples with NuGen WT-Ovation™ Pico RNA Amplification System. There was no correlation between post-mortem time and quality of RNA obtained however, because of the small sample size a firm conclusion
[image:8.595.55.540.91.149.2]on this cannot be made. The recommended starting concentration of the RNA samples used for Gene ST 1.0 arrays is 6 ng/5 μl [19]. As the recommended starting RNA concentration was much higher for Gene 1.0 ST ar-rays compared to the spotted oligonucleotide microarar-rays the area of LMD tissue processed for each sample in the Gene 1.0 ST array experiments was increased to appro-ximately 100,0000 μm2 to 130,0000 μm2 (Table 2). On Agilent assay, the RNA samples exhibited both the 18S and 28S peaks distinctly and the RNA concentration of these samples ranged from 10.88 ng/12μl to 25.8 ng/12μl, with the RIN for these samples from 3.3 to 7.9 (Table 2, Figure 6A). The average RIN value for the samples was 5.1. As seen in Table 2, although sample number 9 had un-recordable RIN it was still included in the microarray experiments as it had good RNA concentration and quality. According to the manufacturer’s criteria, sam-ples with good RNA concentration but low or absent RIN value were included in the study if these had ampli-fied satisfactorily and fulfilled quality control metrics. However, samples with low RIN values that had failed to amplify satisfactorily were discarded. Only those samples shown in Table 2 that had fulfilled the quality Figure 4Composite image of nanodrop spectrophotometry of amplified and labelled probes of spotted oligonucleotide microarrays.
ImagesAandBare nanodrop spectrophotometry of second round of amplification and labelled probe of a microarray sample (C0404 LEC) respectively. These graphs were used to determine the quality of the amplification and labelling of the sample for further processing. Image 4A
[image:8.595.60.539.548.685.2]of the amplified RNA demonstrates RNA concentration and 260/280 ratio which shows absence of protein contamination. The overall graph curve indicates good quality of amplified RNA. Image 4Bof the labelled probe gives the concentration of the sample with frequency of incorporation of the dye in the sample.
control metrics (Additional file 1, Figure 6A, B, C, D, E and F) were included in the study.
Optimisation of LMD tissue for real time PCR
Five cadaveric eyes were processed for real time PCR ex-periments to validate the oligonucleotide microarray studies. The LMD area ranged from 85,831 μm2 to 138,868 μm2. The OS region samples were processed in triplicates to demonstrate replicable results.
Discussion
Successful isolation of the tissue or cells by LMD in-volves appropriate collection or harvesting of the donor, with contamination free sectioning, processing and stor-age of the samples at−80°C to preserve the RNA quality prior to LMD.
Mechanical isolation of the limbal epithelium and the LEC without contamination from adjacent tissue is tech-nically challenging, as the limbus is a narrow one mm transient zone between the cornea and conjunctiva and LEC is a deep seated structure arising from the under surface of limbus extending into the underlying limbal stroma. Similar observation regarding the limbus was pre-viously made in a molecular study using LMD tissue [20]. LMD offers a viable and effective option to isolate cell populations of interest from heterogeneous tissue thus preserving the purity and integrity of the RNA samples for further molecular studies [4].
Pinzani et al. in 2006 had demonstrated that directly immersing the tissue in liquid nitrogen for cryopreserva-tion disrupts the tissue morphology due to the formacryopreserva-tion of ice crystals leading to freeze fractures in the tissue. The authors have further suggested that controlled freezing of the tissue prevents the development of freeze
fractures in the tissue and have demonstrated extraction of good quality RNA and DNA from the controlled fro-zen tissue [21].
The authors have further noted that tissue sections of 5-8μm thickness are ideal for microscopic resolution due to monolayer cell thickness of these tissue sections. A similar protocol study on LMD tissues have reported ef-fective RNA extraction of LMD tissue processed from 8μm tissue cryosections [22].
In this study, cryosections of 6 μm thickness was noted to improve the histology quality of sections and visualisation of the LEC.
In a study on LMD tissue, Kermanet al.,had demon-strated a relationship between sectioning strategy and the RNA quality. They had observed that mounting 1–2 sections on the slide had minimal influence on the RNA quality; however, the RNA quality dropped when four or more sections were mounted per slide. The authors had noted that mounting more sections on a slide caused longer exposure of the sections to the room temperature while being processed, leading to uncontrolled RNase activity and hence RNA degradation during this period. Based on the abovementioned observation and our own experience, we had limited maximum of 4 sections on each PALM slide. This not only improved the cost ef-fectiveness but also maintained the RNA quality of the processed tissue at the same time.
Furthermore, it was noted that post-staining handling of the slides for LMD for up to 3 hours did not significantly influence the quality of RNA. However, this processing time should not be exceeded; as such delays adversely af-fected the RNA quality [23]. Based on observations of this study all the toluidine stained tissue sections were laser microdissected within 3 hours of processing.
A study on LMD process has established better preser-vation of tissue morphology following fixation with 70% acetone at −20°C compared to 70% EtOH however, the RNA recovery was similar in both methods. For optimal results, the authors have suggested that tissue sectioning should be carried out at −20°C and have recommended use of membrane coated slides for excellent tissue cap-ture during LMD [24]. Similarly, in our study, soon after the tissue sections were taken on the PALM slide the slides were retained in the cryostat chamber at −20°C until fixed in pre-chilled (−20°C) 70% v/v EtOH to pre-vent RNase activity. We had noted good preservation of morphology of OS epithelial regions following fixation in 70% EtOH during optimisation process.
[image:9.595.57.290.112.292.2]A LMD study had demonstrated the effective staining of the tissue sections with toluidine blue, a nuclear dye resulting in preservation of RNA integrity and reliable amplification of cDNA with Taqman real-time PCR [25]. Similarly studies on the staining procedures for LMD sections, have suggested the use of RNase free aqueous Table 2 LMD samples used in Gene ST 1.0 array
experiments
Sr No Samples ID Tissue LMD areaμm2 RNA conc (ng/
μl) RIN
1 C0798 (1) Cornea 1237928 1.542 7.9
2 C0798(2) Limbus 1058825 1.093 3.3
3 C0798(3) LEC 1102794 0.902 6
4 C0798(4) Conj 1287990 0.987 5.7
5 C0982(1) Cornea 1062468 2.1577 6.2
6 C0982(2) Limbus 1103061 1.8111 7
7 C0982(3) LEC 1267265 1.3428 4.6
8 C0982(4) Conj 1108369 1.162 6.6
9 C0898(1) Cornea 1035312 1.0687
-10 C0898(2) Limbus 1229731 1.5995 7.8
11 C0898(3) LEC 1374860 1.0795 4.7
12 C0898(4) Conj 1060222 1.257 6.3
staining solutions for preparation of the toluidine dye and washes to protect RNA integrity [26]. The authors of the latter study have recommended processing of the LMD tissue under sterile conditions and storage at−80°C in the lysis buffer until further use. During RNA extraction, they have advised DNase treatment of the samples to prevent genomic DNase contamination [22].
Comparison of RNA extraction of the LMD tissue with Qiagen RNeasy Micro kit (Valencia, CA) and Trizol RNA isolation reagent (Life Technologies, Invitrogen, Carlsbad, CA) have demonstrated efficient RNA extraction from
LMD frozen tissue with Qiagen RNeasy Micro kit (Valencia, CA) [21].
[image:11.595.57.539.241.736.2]In this study, dissection of variable amounts of epithelial tissues was unavoidable due to factors such as limited availability of LEC samples and sparse cellular density of LEC stroma. This limitation was dealt with by scrutinising wet unstained 6μm thick serially cut cryosections involv-ing 360° of the limbus, for LEC and includinvolv-ing all the LEC sections for LMD to maximise the tissue availability. For LEC stroma samples large area of tissue was laser micro-dissected to obtain adequate RNA from this region.
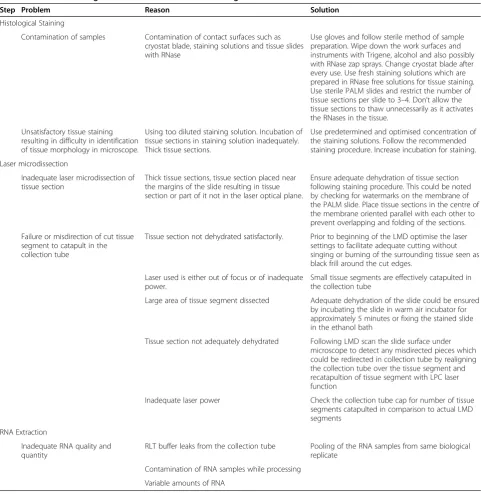
Table 3 Troubleshooting in Laser microdissection of OS regions
Step Problem Reason Solution
Histological Staining
Contamination of samples Contamination of contact surfaces such as cryostat blade, staining solutions and tissue slides with RNase
Use gloves and follow sterile method of sample preparation. Wipe down the work surfaces and instruments with Trigene, alcohol and also possibly with RNase zap sprays. Change cryostat blade after every use. Use fresh staining solutions which are prepared in RNase free solutions for tissue staining. Use sterile PALM slides and restrict the number of tissue sections per slide to 3–4. Don’t allow the tissue sections to thaw unnecessarily as it activates the RNases in the tissue.
Unsatisfactory tissue staining resulting in difficulty in identification of tissue morphology in microscope.
Using too diluted staining solution. Incubation of tissue sections in staining solution inadequately. Thick tissue sections.
Use predetermined and optimised concentration of the staining solutions. Follow the recommended staining procedure. Increase incubation for staining.
Laser microdissection
Inadequate laser microdissection of tissue section
Thick tissue sections, tissue section placed near the margins of the slide resulting in tissue section or part of it not in the laser optical plane.
Ensure adequate dehydration of tissue section following staining procedure. This could be noted by checking for watermarks on the membrane of the PALM slide. Place tissue sections in the centre of the membrane oriented parallel with each other to prevent overlapping and folding of the sections.
Failure or misdirection of cut tissue segment to catapult in the collection tube
Tissue section not dehydrated satisfactorily. Prior to beginning of the LMD optimise the laser settings to facilitate adequate cutting without singing or burning of the surrounding tissue seen as black frill around the cut edges.
Laser used is either out of focus or of inadequate power.
Small tissue segments are effectively catapulted in the collection tube
Large area of tissue segment dissected Adequate dehydration of the slide could be ensured by incubating the slide in warm air incubator for approximately 5 minutes or fixing the stained slide in the ethanol bath
Tissue section not adequately dehydrated Following LMD scan the slide surface under microscope to detect any misdirected pieces which could be redirected in collection tube by realigning the collection tube over the tissue segment and recatapultion of tissue segment with LPC laser function
Inadequate laser power Check the collection tube cap for number of tissue segments catapulted in comparison to actual LMD segments
RNA Extraction
Inadequate RNA quality and quantity
RLT buffer leaks from the collection tube Pooling of the RNA samples from same biological replicate
Contamination of RNA samples while processing
Potential pitfalls
During LMD due to the absence of cover slip over the tis-sue section visualisation of the morphology of the tistis-sue becomes difficult therefore to facilitate identification of the morphology the tissue sections needs to be stained this can affect RNA viability.
LMD products in lysis buffer and RNA samples are unsuitable for long term storage.
Molecular study involving pure cell populations might not consider interaction between the cell population studied and surrounding structures such as supporting cells and the extracellular matrix. This may result in lack of information regarding cell to cell or cell to extracellu-lar matrix signalling.
Certain downstream molecular procedures such as microarray experiments and proteomics may require large amount of samples, which may not be feasible to collect with LMD.
LMD needs to be performed in a limited period of time, as degradation of tissue samples may be an issue due to exposure during prolonged laser microdissection.
The amount of tissue sample needed is also deter-mined by amount of target molecule per cell and num-ber of replicates required.
Trouble shooting
This section mainly presents the effect of optimisation of LMD technique with consideration to cryopreserva-tion of the tissue, thickness of the cryoseccryopreserva-tions taken on PALM slides, fixation technique and tissue staining (Table 3).
Conclusions
LMD is an effective non-contact method of collection of tissue of interest from heterogeneous tissue samples for downstream molecular experiments. Optimisation of tis-sue collection, processing and LMD technique was found to be crucial to maximise the effectiveness of LMD process for generation of viable RNA samples of sufficient concentration and quality. We have demon-strated that picogram to nanogram amounts of laser mi-crodissected RNA samples generated from insitu OS epithelial regions of human donor eyes can be success-fully used for downstream molecular analysis such as microarrays and real time PCR.
Additional file
Additional file 1:Assessment of quality of cDNA samples processed for Gene 1.0 ST arrays and real time PCR.
Competing interests
The authors declare that they have no competing interests.
Authors’contributions
BBK performed sample collection, microarray experiments and analysis of experimental data. HSD and DGP supervised the project and helped with planning of the experimental design. HSD and AH looked after the administration and the financial aspect of the project. BBK created draft of the manuscript which was critically revised edited and proof read by HSD and AH. DGP supervised laser microdissection and helped with trouble shooting of the experiments. All authors read and approved the final manuscript.
Acknowledgements
I am grateful to the Royal College of Surgeons of Edinburgh, UK for providing financial support to this project. I wish to thank Dr Patrick Tighe, Dr Matthew Arno, Toshana Foster, and Estibaliz.Aldecoa-Otalora_Astarloa for their technical support with microarray experiments
Author details
1Division of Ophthalmology and Visual Sciences, B-Floor, Eye & ENT Building,
Queen’s Medical Centre, Derby Road, Nottingham, UK.2Department of
Pathology, A-Floor, West Block, Queen’s Medical Centre, Derby Road, Nottingham, UK.
Received: 5 April 2013 Accepted: 9 October 2013 Published: 26 October 2013
References
1. Kaufman HE, Capella JA, Robbins JE:The human corneal endothelium.
Am J Ophthalmol1966,61(5 Pt 1):835–841.
2. Woodward MA,et al:Corneal donor tissue preparation for endothelial keratoplasty.J Vis Exp2012,64:e3847.
3. Burgemeister R:New aspects of laser microdissection in research and routine.J Histochem Cytochem2005,53(3):409–412.
4. Simone NL,et al:Laser-capture microdissection: opening the microscopic frontier to molecular analysis.Trends Genet1998,14(7):272–276. 5. Ohyama H,et al:Laser capture microdissection-generated target
sample for high-density oligonucleotide array hybridization.
Biotechniques2000,29(3):530–536.
6. Cowherd SM,et al:Proteomic analysis of human breast cancer tissue with laser-capture microdissection and reverse-phase protein microarrays.Clin Breast Cancer2004,5(5):385–392.
7. Asplund A,et al:Expression profiling of microdissected cell populations selected from basal cells in normal epidermis and basal cell carcinoma.
Br J Dermatol2008,158(3):527–538.
8. Bohm M,et al:Microbeam MOMeNT: non-contact laser microdissection of membrane-mounted native tissue.Am J Pathol1997,151(1):63–67. 9. Srinivasan R:Ablation of polymers and biological tissue by ultraviolet
lasers.Science1986,234(4776):559–565.
10. Hoerauf H,et al:Retinal photoablation with the Erbium:YAG laser. Initial experimental results for traction-free removal of tissue.Ophthalmologe2003,
100(2):115–121.
11. Bernsen MR,et al:Identification of multiple mRNA and DNA sequences from small tissue samples isolated by laser-assisted microdissection.
Lab Invest1998,78(10):1267–1273.
12. Schermelleh L,et al:Laser microdissection and laser pressure catapulting for the generation of chromosome-specific paint probes.
Biotechniques1999,27(2):362–367.
13. Mayer A,et al:Going in vivo with laser microdissection.Methods Enzymol
2002,356:25–33.
14. Stich M,et al:Live cell catapulting and recultivation.Pathol Res Pract2003,
199(6):405–409.
15. Shanmuganathan VA,et al:Morphological characteristics of the limbal epithelial crypt.Br J Ophthalmol2007,91(4):514–519.
16. Kirana C,et al:Compatibility of toluidine blue with laser microdissection and saturation labeling DIGE.Proteomics2009,9(2):485–490.
17. Copois V,et al:Impact of RNA degradation on gene expression profiles: assessment of different methods to reliably determine RNA quality.
J Biotechnol2007,127(4):549–559.
18. Kulkarni BB,et al:Comparative transcriptional profiling of the limbal epithelial crypt demonstrates its putative stem cell niche characteristics.
19. Kulkarni B,et al:Validation of endogenous control genes for gene expression studies on human ocular surface epithelium.PLoS One2011,
6(8):e22301.
20. Zhou M, Li XM, Lavker RM:Transcriptional profiling of enriched populations of stem cells versus transient amplifying cells. A comparison of limbal and corneal epithelial basal cells.J Biol Chem2006,
281(28):19600–19609.
21. Pinzani P, Orlando C, Pazzagli M:Laser-assisted microdissection for real-time PCR sample preparation.Mol Aspects Med2006,27(2–3):140–159. 22. Erickson HS,et al:Quantitative RT-PCR gene expression analysis of laser
microdissected tissue samples.Nat Protoc2009,4(6):902–922. 23. Kerman IA,et al:Combining laser capture microdissection with
quantitative real-time PCR: effects of tissue manipulation on RNA quality and gene expression.J Neurosci Methods2006,153(1):71–85.
24. Sluka P,et al:Application of laser-capture microdissection to analysis of gene expression in the testis.Prog Histochem Cytochem2008,42(4):173–201. 25. Ehrig T,et al:Quantitative amplification of genomic DNA from
histological tissue sections after staining with nuclear dyes and laser capture microdissection.J Mol Diagn2001,3(1):22–25.
26. Wang H,et al:Histological staining methods preparatory to laser capture microdissection significantly affect the integrity of the cellular RNA.
BMC Genomics2006,7:97. doi:10.1186/1471-2415-13-62
Cite this article as:Kulkarniet al.:Optimised laser microdissection of the human ocular surface epithelial regions for microarray studies.BMC Ophthalmology201313:62.
Submit your next manuscript to BioMed Central and take full advantage of:
• Convenient online submission
• Thorough peer review
• No space constraints or color figure charges
• Immediate publication on acceptance
• Inclusion in PubMed, CAS, Scopus and Google Scholar
• Research which is freely available for redistribution