Developing Full Range S-N Curve of Aluminium
Alloys using Mathematical Model
Akshay Kumar Jain1, A.K.Jain2
1
M.E. Scholar, Dept. of Mechanical Engineering, Jabalpur Engineering College,Jabalpur,India
2
Associate Prof., Dept. of Mechanical Engineering, Jabalpur Engineering College, Jabalpur,India
Abstract: Recent studies have proved that there is no fatigue limit for metallic materials. The stress life curve continuously drops even after 107 cycles. However, existing design codes assume that there is a fatigue limit. Therefore, it is important to use appropriate safety factors if existing codes are used for life evaluations. This paper consist of developing the full range S-N curve from low cycle region to high cycle region upto giga cycle fatigue region of Aluminium alloys using the mathematical model. Combining monotonic test based empirical fatigue formulae and a Wholer field mathematical model, a new formula for developing full range stress life curves for medium strength material is proposed. The accuracy of proposed formula is verified using experimental fatigue data of two aluminium alloys. This formulae is used for prediction of stress life curve of one steel and comparing the obtained results with experimental fatigue data of steel for checking the application of formulae for other materials also.
Keyword: Full range S-N curve, Monotonic test, Wholer field mathematical model, Emperical formulae, Aluminium alloys, Steel.
I. INTRODUCTION
Fatigue failure is a common phenomenon in structures that are subjected to cyclic loading therefore designing against fatigue is important. Fatigue damage of structures is determined by using stress – life (S–N) curves in high cycle fatigue (HCF) and gigacycle fatigue (GCF) regions, while strain – life (e–N) curves are used in low cycle fatigue (LCF) region. Laboratory fatigue testing based S–N curves developed using material samples from structures concerned (structure and material specific S–N curves) produce realistic fatigue damage predictions for those structures. However, fatigue testing is costly, time consuming and requires sophisticated equipment or much time if conventional equipment is used especially in GCF region. Therefore, monotonic test (tensile and hardness tests) based empirical formulae such as the Basquin and Manson–Coffin equation for LCF and HCF regions and Murakami formulae for GCF region are widely used. Where experimental fatigue data is available, regression analysis based functions such as Strohmeyer function, Palmgren function and recently developed Kohout and Vechet function are useful for constructing S–N curves. However, there are no empirical formulae which are able to accurately describe the entire (full) range of the S–N curve from the first cycle to gigacycle. Therefore, we use monotonic test method to construct a full range S–N curve by employing monotonic test based empirical formulae and Palmgren function(a Wholer field mathematical function).
II. LITERATURE REVIEW
A. Alan Vasko , Milan Vasko
The paper deals with the comparison of fatigue tests of nodular cast iron at high and low frequency cyclic loading. Fatigue tests were realized at high and low frequency sinusoidal cyclic push-pull loading (stress ratio R = –1) at ambient temperature (T = 20 5
°C). High frequency fatigue tests were carried out with using the ultrasonic fatigue testing device KAUP-ZU (frequency f 20
kHz); low frequency fatigue tests were carried out with using the fatigue experimental machine Zwick/RoellAmsler 150HFP 5100 (frequency f 120 Hz).
B. S. Schoenborn , H. Kaufmann , C.M. Sonsino , R. Heim
Results obtained with modern high strength cast iron alloys such as EN-GJS-500-7 , SiboDur 700-10 and MADI (MachinableAustempered Ductile Iron) under a standard Gaussian spectrum for chassis applications and also under a fuller injection pump spectrum suggest the allowable damage sum Dal = 0.3 for fatigue life estimations.
C. M. Jimenez , J. Martinez , U. Figueroa , L. Altamirano
In this paper durability assessment is performed to establish the damage applied by loads and the number of load cycles versus S-N curves. This information is evaluated using a fatigue damage hypothesis. A new relationship is proposed to estimate the S-N curve of nodular cast iron, based on its ultimate strength, using a case study of a steering knuckle component under bending load. Finite element simulation was performed to obtain the maximum stresses in the component using Patran V2012.2 and Nastran V2008 software. Correction factors accounted for surface finish, type of load and level of reliability.
Actual and proposed predictions were evaluated using experimental results. The main aim of this work was to design a fatigue test, with a limited amount of information, through finite element simulation and tensile strength. The main advantage of this relationship over the other methods for estimating an S-N curve, is to improve life prediction at the boundary of low and high cycle fatigue with a simple relationship and without a series of tests to identify the S-N curve, thus simplifying durability assessment with a limited amount of information. The proposed relationship improved the life prediction by an average of 10% in the case study.
D. A. Laksimi , X. L. Gong & M. L. Benzeggagh
In this paper the object of the study is to investigate the damage and failure mechanisms in a glass-fiber/epoxy composite under monotonic tensile loading. The testing was carried out on unidirectional specimens with and without a circular hole. The damage initiation and failure mechanisms were studied by means of scanning electron microscopy and acoustic emission monitoring. In addition, for specimens with a circular hole, a novel strain-gage instrumentation method is suggested. These different techniques permitted the determination of the damage parameters e, v, D, F, which characterize qualitatively and quantitatively the initiation and evolution of damage. It was found that the amplitude distribution of acoustic emissions is a very efficient tool for identifying damage mechanism such as micro cracking in the resin, fracture and friction of the interface between fiber and matrix, and fiber pull-out
E. M. Sonsino
Conventional design codes base their recommendations still on the common prejudice that an “endurance limit” exists. However, several investigations prove clearly that in the high-cycle regime a decrease of fatigue strength with increased number of cycles still occurs, even if corrosion or temperature effects are excluded. Therefore, the fatigue design of components submitted to loadings below the knee point of the S-N curve must consider this fact in order to avoid failures. With regard to the course of the S-N curve in the very high cycle area, material and manufacturing dependent recommendations are given.
used t estimate as given in Eq. (8),
= 0.5 (8)
The knee point fatigue strength can be written using Eq. (7) as,
= ⁄ ( + 120)∙(155−7 log ) (9)
Substituting for from Eq. (9), is obtained and given in Eq. (10),
= 10
. ( )∙ ⁄ .
. ( )∙ ⁄ (10)
Accordingly, the modified Palmgren function is given in Eq. (11),
( ) = ∙( + ) + ( )∙ ( )∙ (11)
Table 1 shows data for two aluminium alloys used in the study for verifying the proposed formula. These aluminium alloys are from literature [5] and there properties are from reference [8, 9]. Table 2 shows the data for steel used in the study for verifying the proposed formula and its properties are taken from reference [10].
Table .1 Aluminium used for verification of proposed formula
Material References (N/mm2) (Kgf/mm2)
AA 2024 [8] 469 137
AA 7075 [9] 572 175
Table .2 Steel used for verification of proposed formula
Material References (N/mm2) (Kgf/mm2)
Steel 1045 [10] 565 170
III. PREDICTION OF S-N CURVE USING THE PROPOSED FORMULA AND COMPARING IT WITH EXPERIMENTAL S-N DATA
For calculation it is assumed that for all the material taken is1 × 10 cycles and experimental S-N data is taken from literature [6]. Results obtained after solving using all the equations mention above are stated in table given below for all three material;
Table .3 S.No. Materials ↓ (Eq.7)
N/mm2
(Eq.10) (Eq.9)
N/mm2
(Eq.6) (Eq.6) B(Eq.6)
1 AA 2024 197.670 232064.487 234.5 620.186 182.080 47.185
2 AA 7075 242.430 287294.633 286 780.082 222.847 55.670
3 Steel 1045 237.340 203898.939 282.5 733.090 218.928 42.650
[image:3.612.64.549.452.702.2]On putting these values in Eq(11) the general equation is obtained in which stress is obtained for different values of life cycle. The results obtained is displayed below in following tables for all three metal differently.
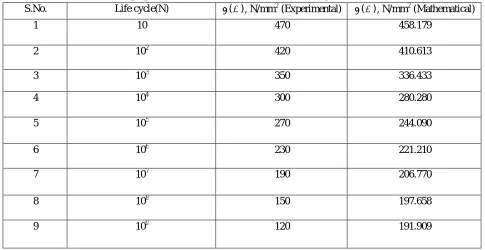
Table .4B S-N data obtained from proposed formula for AA 2024 and data from experimental observation from literature(6). S.No. Life cycle(N) ( ), N/mm2 (Experimental) ( ), N/mm2 (Mathematical)
1 10 470 458.179
2 102 420 410.613
3 103 350 336.433
4 104 300 280.280
5 105 270 244.090
6 106 230 221.210
7 107 190 206.770
8 108 150 197.658
Fig. 2. Predicted S-N curve for AA 2024 using the proposed formula and experimental S-N data (Stress amplitude- y axis, life cycles- x axis)
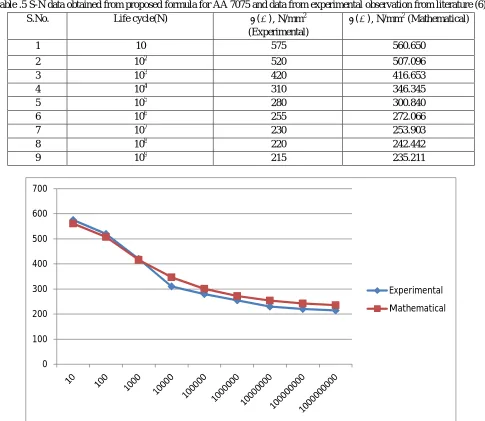
Table .5 S-N data obtained from proposed formula for AA 7075 and data from experimental observation from literature (6).
S.No. Life cycle(N) ( ), N/mm2
(Experimental)
( ), N/mm2 (Mathematical)
1 10 575 560.650
2 102 520 507.096
3 103 420 416.653
4 104 310 346.345
5 105 280 300.840
6 106 255 272.066
7 107 230 253.903
8 108 220 242.442
9 109 215 235.211
Fig. 3. Predicted S-N curve for AA 7075 using the proposed formula and experimental S-N data (Stress amplitude- y axis, life cycles- x axis)
0 100 200 300 400 500
Experimental
Mathematical
0 100 200 300 400 500 600 700
Experimental
Table .6 S-N data obtained from proposed formula for Steel 1045 and data from experimental observation from literature (6). S.No. Life cycle(N) ( ), N/mm2 (Experimental) ( ), N/mm2 (Mathematical)
1 10 570 550.728
2 102 520 490.760
3 103 440 401.540
4 104 350 335.016
5 105 330 292.230
6 106 320 265.180
7 107 320 248.112
8 108 320 237.340
[image:5.612.64.552.89.572.2]9 109 320 230.540
Fig. 4. Predicted S-N curve for Steel 1045 using the proposed formula and experimental S-N data (Stress amplitude- y axis, life cycles- x axis)
IV. CONCLUSION
A. From the above analysis it has been observed that the stress life cycle graph so obtained using experimental data are almost similar to that so obtained using mathematical model. So for prediction of S-N curve mathematical model can also be used instead of experimental based method because experimental based analysis is time consuming and complicated.
B. By using this mathematical model for finding out the S-N curve for Steel it has been seen that the empirical relation so obtained is valid for other materials also. The other result so seen that we assume that S-N curve becomes straight line after HCF (high cycle fatigue) region but it is not so. This can be seen in Fig. 4 in which after 106 cycle the graph of mathematical observation goes on decreasing.
0 100 200 300 400 500 600
Experimental
C. Having a single formula for predicting fatigue S-N curves for the full range makes fatigue assessments using manual calculations, spread sheets and computer based programming easy. Having S-N curves that require easily testable material parameters (i.e., and ) makes the experimental work for the construction of S-N curves simple.
REFERENCES
[1] VASKO A., TRSKO L., NOVY F. 2013, Fatigue resistance of syntetic nodular cast irons, Chapter 3. In: Product quality improvement and companies
competitiveness (editing by BORKOWSKI S., INGALDI M.). SMJiP. Celje, Slovenia, pp. 34-45.
[2] BELAN J. 2015, High frequency fatigue test of IN 718 alloy – microstructure and fractographyevaluation“Metalurgija” 54, pp. 59-62.
[3] BELAN J. 2015, High frequency fatigue test of IN 718 alloy – microstructure and fractography evaluation. “Metalurgija”. 54, pp. 59-62.
[4] S. Schoenborn, H. Kaufmann, C.M. Sonsino, R. Heim, Cumulative damage of high-strength cast iron alloys for automativeapplication,Procedia engineering
101 (2015), pp. 440-449.
[5] C. M. Sonsino, Fatigue testing under variable amplitude loading , Int. J. Fatigue, 29(2007), pp. 1080-1089 M. Jimenez , J. Martinez , U. Figueroa , L. Altamirano , Estimated S-N curve for nodular cast iron : A sterring knuckle case study ,International Journal of Automotive Technology, Vol. 15, No. 7, pp.1197-1204 (2014).
[6] A. Laksimi, X. L. Gong & M. L. Benzeggagh, Analysis of damage mechanism in a centrally notched glass- fiber/ epoxy plate, composites science and technology 52 (1994) pp. 85-91.
[7] C.M. Sonsino, Course of S-N curves especially in the high cycle fatigue regime with regard to component design and safety, International Journal of Fatigue
(2007), pp. 1-13.
[8] http://asm.matweb.com/search/SpecificMaterial.asp?bassnum=ma2024t4 [9] http://asm.matweb.com/search/SpecificMaterial.asp?bassnum=ma7075t6