Epilepsy Detection by Processing of EEG Signals
using Conventional Method
S. N. Hallur1 , D. A. Torse2 , S. Santaji3
1,2,3
Asst. Professor, Dept. of ECE, KLS Gogte Institute of Technology, Belagavi
Abstract: Epileptic seizure or epilepsy commonly known as fits have been occurring one in a 100 in day to day life and the causes to this are many. Inspite of so many causes it appears physically as much as most of the time to a lot of people. The overview of the work presented over here is that the occurrence of the epilepsy to appear physically can be treated or controlled before in hand. There are various methods to do that. This detection before in hand itself is done by various procedures which includes the methods of capturing and monitoring the Electroencephalograph (EEG) signals from the patients, separating the signals with respect to their frequencies and then comparing it with the threshold with respect to their amplitudes. Crossing the threshold indicates the occurrence or initiation of the Epilepsy and thus is beforehand itself indicated by the occurrence of an alarm. This detection here is being performed by using conventional method wherein the EEG signal samples are given as input via 3.5mm jack and the results are analyzed.
Keywords: Epilepsy, EEG, threshold, simulation, , jack, conventional circuit.
I. INTRODUCTION
A. Introduction to EEG Signals
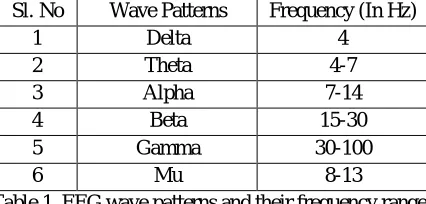
The recording of the electrical activity of the brain along the scalp which is a result of current obtained due to the firing of neurons in the brain coz of fluctuation of voltage is known as Electroencephalography (EEG). The brain gives a response to the stimulus and thus the measurement of the response to the stimulus is known as Event-Related Potential (ERP). The stimulus may be sensory, motor or cognitive in nature. Various patterns of EEG are recorded in the table below as follows:
Sl. No Wave Patterns Frequency (In Hz)
1 Delta 4
2 Theta 4-7
3 Alpha 7-14
4 Beta 15-30
5 Gamma 30-100
[image:1.612.200.413.413.515.2]6 Mu 8-13
Table 1. EEG wave patterns and their frequency ranges
Some brain wave rhythms and waves whose frequency ranges as indicated above are being diagrammatically represented as below.
B. Epilepsy
[image:2.612.196.418.243.337.2]Epilepsy is completely a chronic disorder which is always recurrent and is always provoked by the unprovoked seizures. The people who have fits or epilepsy have symptoms more than one type of seizure and they most of the times of have other neurological problems as well. Epilepsy may also be said as a spectrum condition with a wide range of seizure types and the control varies from person to person. Epileptic seizures signals characterized from small range low signals to vigorous shaking. The cause of the epilepsy is unknown though most of the defects are birth defects and sometimes they also occur due to the electrolytic imbalance in between the neurons. The most common type of the seizures is known as convulsive and its constitute about 60% of the total seizures that are present. Among which 1/3rd of them occur start occurring due to its affect in both the hemispheres of the brain. 2/3rd of all the seizures are due to the partial affects that are being occurred and then completely affect the person. The rest 40% of the seizures are non-convulsive. About 6% of the epilepsies that are caused in the world are due to the seizures that are being triggered by the specific events which are also known as reflex seizures. These reflex seizures always occur as a result of a specific stimulus.
Fig 2. EEG of a person with childhood absence epilepsy showing a seizure
C. Source of Neural Activities
The home for neural activities for the origin of EEG signal may be human brain and the neuron. The most fundamental cell in neuropsychology is neuron from which the firing occurs and thus EEG come into picture. Thus the following has been presented in the following sections below.
D. Human Brain
The human brain is divided into 3 parts: Cerebrum, Cerebellum and Medulla Oblongata. The major concentrated parts for EEG reference are Cerebrum and Cerebellum. Complex body movements including co-ordination and muscle tone modulation are controlled by cerebellum. The cerebellum is again divided into 6 parts. They are frontal lobe, temporal lobe, insular lobe, limbic lobe, occipital lobe and parietal lobe. Pain, taste sensations and problem-solving activities are being concentrated in the parietal lobe. Hearing and Memory are associated with temporal lobe. Vision-related tasks are being taken care by occipital lobe. The frontal lobe is associated with problem solving, emotions, movement and speech.
Fig 3. Fnctional diagram of human brain
[image:2.612.222.393.524.633.2]E. Neuron
Fig 4. Structure of a neuron
[image:3.612.234.381.256.343.2]The main components of the Central Nervous System (CNS) are nerve cells and glia cells. Every neuron has cell bodies, dendrites and axons. The function of the nerve cells is to respond to stimuli and to transmit the information over long distances. The sending and transmitting of an electrical signal occurs through an axon which is a long cylindrical tube. The proteins to the end of the cell is being delivered by axon’s transport system. The resting membrane potential of neuron is about is about -70 to 60mV.
Fig 5. Action Potential of a Neuron F. Measurement of EEG Signals
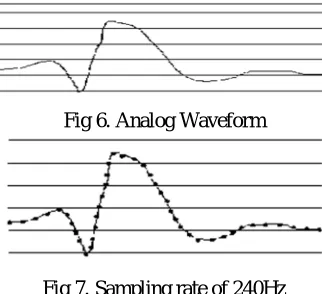
The electric potential generated by a single neuron is very much insufficient to be captured up by EEG and thus a collective data of millions of neurons that are synchronously working with similar spatial orientation is collected and then the EEG is analyzed. The cognitive state changes and the sleep states of the neurons are being analyzed by the EEG. EEG data can be acquired using 2 types of instruments: Digital and Analog EEG instruments. Analog Instruments consists of an amplifier, a writing device and a galvanometer where the output of the amplifier is always being controlled by low frequency and high frequency filters and sensitivity controls. Ex: A sensitivity of 10µV/mm means that a signal with amplitude of 100µV will produce 1cm deflection on the vertical scale. The analog waveform is being converted to digital values and thus this process is known as Analog to Digital Conversion where the continuous signal is being quantized according to a particular interval and quantization values are being given to the signal with respect to its amplitude.
[image:3.612.224.385.490.637.2]Fig 6. Analog Waveform
Fig 7. Sampling rate of 240Hz
E. Sensors / Electrodes
1) The electrodes can be categorized Based on
2) Circuitry design
3) Conduction
[image:4.612.223.391.145.256.2]4) Communication
Fig 8. Classification of Electrodes
F. Based on Circuitry Design
Electrodes are classified based on whether the circuitry is inbuilt within them or not.
1) Active Electrodes: They have inbuilt circuitry where the current is being amplified due to which the signal quality received is greatly improved and also the skin preparation and conductive pasting required by passive electrodes can be avoided.
2) Passive Electrodes: They don’t have inbuilt circuitry and thus the results are less efficient than the active ones
G. Based On Conduction
1) Wet Electrodes: Wet electrodes rely on electrolytic gel to penetrate hair wherein the gel also acts as a medium to fill up the air gaps in between the sensors and the electrode and provide a clean conductive path
2) Dry Electrodes: Dry electrodes directly comes in contact with the skin wherein the electrolytic gel is not necessary at all. Here since the sensors have to be in their place intact and thus to avoid the noises and artifacts mechanics and electronics comes into picture. Ex: Quick 20.
H. Based on Communication
1) Wired Electrodes: The electrodes are being attached with wires and are being connected to the analyzing center and thus the EEG signals that are being transferred to the processing center are processed. Ex: PO8
2) Wireless Electrodes: The electrodes are not being attached by any wire and thus the information collected is being transmitted all wirelessly. Ex: Quick 20
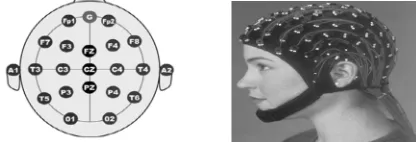
3) Positioning of Electrodes:The positioning of electrodes is one of the important aspects in the EEG signal capturing and detection. For this purpose the 10-20 Method is being used wherein the electrodes are being placed along the scalp of the head. The 10-20 method is based on the relationship between location of the electrode and underlying area of the cerebral cortex. The positioning of the electrodes along the scalp is shown as follows in the figure depicted below.
Fig 9. International 10-20 Placement System
[image:4.612.202.412.582.653.2]P for Parietal Lobe O for Occipital Lobe
“Z” indicate that an electrode is being indicated on the midline.
I. Abnormal EEG Patterns
Abnormality is being indicated by certain variations in the EEG signals that are being generated by the brain. The reasons for the following may be due to the following as such as increase in the abnormal EEG patterns, decrease in the abnormal EEG patterns or sudden disappearance of the EEG patterns and thus the non-specific abnormalities in the EEG signals can be categorized into 3 categories. They are as follows:
1) Intermittent slow wave abnormalities that are widespread and are usually associates with brain dysfunction and are seen in delta
wave range.
2) Persistent bilateral EEG, most of the times usually associated with the impaired conscious reactions of the cerebral hemisphere.
3) EEG associated with disturbance of cerebral hemisphere focused.
A burst-type signal is being associated with the first-category signal which is reduced/ attenuated by alerting the particular individual by eye-opening and then it can also be fastened or accentuated by drowsiness, closing of eyes, etc. The maximum amplitude is being usually observed in the frontal regions and is influenced by age. This is most prominently observed in the occipital and posterior head region in children. It is also observed as the most prominent combinations of the pathological processes including system metabolic and toxic disturbances in the frontal regions.
In the second category, i.e. bilateral persistent EEG, the occurrences and the processes among different stages of conscious, impaired, purposeful responsiveness are totally non-specific and the mechanisms responsible for the following above occurrences are only partially understood. In the third category of classification, i.e. focal persistent EEG, the abnormalities are noticed in the form of disappearances or distortions of the normal patterns occurring in the EEG. Increase or appearances of all abnormal patterns but such kind of changes are always seen at the cerebral cortex. The focal distortion of the normal rhythmic patterns results in an asymmetry in frequency, reactivity or amplitude of the rhythm.
The focal abnormalities may also be the reason for the rhythmic delta waves being produced and thus this is the most reliable findings in the focal cerebral disturbance. These disturbances resulting in the generation of the delta waves are more polymorphic and non-rhythmic and are always less-reactive but are more reliable.
J. Objectives
The Epileptic Seizure more oftenly called as FITS occurs at any time because of some of the abnormalities that occur within the human brain. The main reason that the epilepsy occurs is due to the abnormal sparking of the neurons which inturn is caused by the irregular activities within the brain. Thus the person may not have medical aid at that particular instant of time and may collapse. Since occurrence of epilepsy gives some instincts or appearance symbols some few hours before its actual physical appearance, capturing its initial signals of start of it will be notified by the comparison with the threshold set by the hardware and thus this gives an indication of its occurrence before its actual physical appearance by the display and buzzer indication and the patient can survive.
II. LITERATURE SURVEY
A common chronic neurological disorder, marked by seizures is known as Epilepsy which is due to excessive discharge of cortical cells from the brain. The epileptic seizure is undetectable and cannot be completely cured but it can be controlled through proper medicinal drugs. The detection of seizures is highly needed since they are unpredictable and occur very rarely. Here, some of the previous methods that were used for the automatic detection of epileptic seizure in EEG signals are discussed.
Logesparan & Rodriguez-Villegas in the year 2011 proposed an algorithm which is based on data selection which was based on phase congruency and determining interictal spikes from background EEG. A modification of the traditional phase congruency was being involved in the approach where dynamic estimate of the muscle activity along the scalp is included. The performance was greatly increased by 80% even if the data was reduced by more than 50%.
Hierarchical EEG classification system which may be useful in detecting epileptic seizures was proposed by Wang in the year 2011. The proposed method includes 3 steps:
Representing the original EEG signals by wavelet coefficient of packets and its feature extraction by best entropy available k-Nearest neighbor classifier and Cross-Validation (CV) approach for Hierarchical Knowledge Based (HKB) construction. Accuracy Computation and rate rejection to be calculated.
Proposed method was Channel selection which was done by Chang in the year 2010 which reduces the channels from 22 to less than 6. Thus computational load can be reduced. By doing so 70% increase in efficiency in 3-channel cases of EEG database.
In the year 2010, Liang, in order to detect the seizures a systematic evaluator approach was used. With a combination of spectrum analysis and complexity analysis, the evaluation can be done. Genetic Algorithms and Principal Component Analysis (PCA) were applied to linear and non-linear methods.
A method for establishment for differences in power spectra between EEG channels and successive time intervals was being introduced by Lewis in the year 2010. The differences among the time intervals during seizures can be minimized by characteristic evolution of seizures. The combination of Discrete Finite Automata (DFA) and Spectral analysis is very much useful in seizure identification.
With an objective of evaluation of the estimation of the lateralization of epileptic EEGs and preprocessing effect on synchronization analysis, a synchronization analysis on EEG was carried out by Verez Perez in the year 2011. Preprocessing includes cancellation of noise by Wavelet Denoising (WD), Blind Source Separation (BSS) and classification. This method has an efficiency of 90% in locating the epileptic zone.
A Discrete harmony search proposed by Gandhi in the year 2012 which is for detecting epileptic seizure activity from background EEG data recorded from normal and epileptic subjects. Discrete Wavelet Transform (DWT) with entropy, standard deviation, mean, kurtosis energy and entropy estimation was included in the approach and later followed by Probabilistic Neural Network (PNN). This is highly in demand and thus has 100% efficiency.
Guo in the year 2010 presented a method of automatic epileptic seizure detection which uses entropy features derived from Multi Wavelet Transform (MWT) combined with an ANN to detect the presence of seizure but increases the cost of computation.
III. METHODOLOGY
Initially in the first phase, the complete analogy of epilepsy (Fits) is being gone through and then the concept of the EEG signal that is being generated by the brain is being studied. The concept of the EEG signal generation, capturing and processing is also being studied but here processing of the EEG signal is not within the scope of this current implementation and thus it will be studied based on the upper surface. The voltage levels and the action potentials of the neurons are being studied during their normal activity and abnormal activity.
In the second phase, the components required for the current implementation such as the electrodes, types of electrodes needed, its specifications are gone through. The interfacing devices are also being studied which are necessarily required for the signal capturing. Analog to Digital Conversion specifications and various factors affecting the conversions are being studied. Comparators are also being taken into considerations and thus its specifications are chalked out. Various other components utilized are also being studied in this phase.
In the third phase, plans are being chalked out in order what way to implement the current implementation. In this phase, initially the block diagrams are being implemented according to the components necessary step by step. Then combining all the blocks together and assigning the inputs and outputs are being taken out.
In the fourth phase, all the components are being practically implemented according to that as per chalked out in the third phase as per the block diagram. The components are properly connected and then the connections are being analysed whether they are connected as per the circuit required. The inputs are properly connected and the outputs are properly taken out and analysed in the next phase of the current implementation.
IV. CONVENTIONAL METHOD
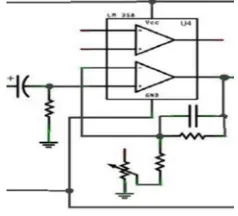
[image:7.612.199.412.121.278.2]Conventional hardware implementation using the normal electronic components mainly aims to make the current implementation understandable for every person with every technological background. The conventional hardware circuit is as shown below.
Fig 10. Conventional Circuit for EEG Detection
Each box of a single Opamp is being connected after the instrumentation amplifier in the circuit. The circuit works around with a battery power of 9V and -9V. Both the battery terminals are connected in the reverse way and thus this ensures “0V” potential across the leg or the circuit.
The problem with the circuit is the circuit gives the data as input to the sound card within the voltage range of -9V to 9V and thus the noise have to be limited to the voltage range -1V to +1V and thus this is done to enhance the quality of the data signal and thus the noise voltage doesn’t get rise above the extreme levels and thus gets clipped off and thus a much better signal is obtained. The lines that are connected horizontally on the breadboard are the power lines and the rest are being connected vertically as always. The connections have a bit break and a gap in between them in order to distinguish the connections from each other.
The signals that are being captured from the electrodes from the brain with the help of the electrodes are of very low amplitude in
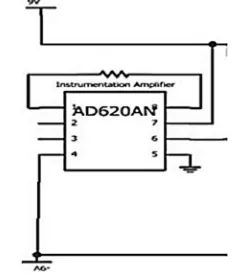
the order of 100μV to some few milliVolts and thus need to be amplified for the purpose of processing, displaying and analyzing. The Instrumentation amplifier circuit is as shown in the figure below
Fig 11. AD620A Instrumentation Amplifier
[image:7.612.244.360.445.585.2]Fig 12. A Notch Filter at 60Hz
The notch filter is very highly sensitive to the resistor that is being connected in parallel to the capacitor. The changes that occur for the resistor that is being connected in parallel will affect the filtering of the noise signal that is being present within the circuit. The signal that is being passed on from the notch filter will be of sufficiently reduced amplitude.
[image:8.612.243.369.304.407.2]Since the data the is measured across the skin, it also contains the galvanic skin response that has been extracted from the skin of the forehead. This is a very less amount of interference that causes in the extraction. Thus this high pass filter is mainly used according to the frequencies that have to be filtered out in the separation of the different kind of signals that occur from the brain and thus each signal gets filtered every time. The High Pass filter may be shown as in the figure below.
Fig 13. A High Pass Filter
The data that have to be clipped off is the information that becomes unnecessary for a particular circuit and thus have to be removed. Ex. The delta and theta signals may have to be removed off when filtering the Alpha Signal and thus only particular designed signal moves out. The Low pass filter may be shown as follows.
Fig 14. A Low Pass Filter
The signal is then amplified using a gain section after its complete filtering and thus since this is of the very low voltage in order to be displayed at the output. The circuit is designed as shown in the figure below.
[image:8.612.242.370.457.583.2] [image:8.612.246.365.612.720.2]Finally another notch filter is being attached to the circuit in order to remove any of the noises that is being present since it may damage the sound card of the system to which the signal
that is separated and has to be given. Fig
Fig 16. Gain Provider and Connections with the sound card
Finally the noise free signal is being given to the system through the male-male connector and thus is as shown in the figure below
Fig 17. 3.5mm male-male jack connected to the sound card
The data that is being captured from the signal is being given to the computer through the 3.5mm jack and thus is being processed by a freeware software that is being downloaded and installed.
A single circuit for the detection of the alpha signals is as designed or as placed in the figure below. The other circuits is the exactly as same as the below circuit which are meant for the extraction of the other signals that have been captured from the person’s brain.
Fig 18. Placement of the design of extraction of alpha signals
The signals need to be captured by placing the electrodes properly on the particular locations of mastoid, nasion and inion. The mastoid is a region behind the ear where a person can feel a bone by rubbing it. Nasion is an area in between the nose and the forehead and in between the 2 eyebrows and inion is an area at the back of the head or the skull. The electrodes is placed based on the 10-20 location pattern. The alpha signals are more high in amplitude when the person is in relaxed state and thus is more prominent in nature from the electrode which is placed in the occipital position. Thus this occipital region is the visual sensory region where even a blink of an eye cause a change in the amplitude. Similarly all the other signals are being very prominent and will respond properly for the changes in their particular form. Similarly they also can be viewed using the processing
Fig 19. Alpha Signals being displayed
Similarly other signals are also being obtained according to their frequency and the filters that are being applied to them and thus they also can be represented as usual form as shown in the above figure.
V. RESULTS
The EEG signal source obtained is then given as the input to the circuit. The results obtained due to the set threshold are as follows:
A. Case 1: Normal Person
The EEG signal samples were collected from five different normal persons and the results were averaged to obtain the different average wave values.
Wave Frequency
(In Hz)
Limit Lower / Higher
Avg Obtained
Freq (in Hz)
Delta 4 0.5Hz / 3.99Hz 2.95
Theta 4-7 4.0Hz / 6.99Hz 6.1
Alpha 7-14 7.0Hz/13.99Hz 8.5
Beta 15-30 15.0Hz/29.99Hz 23.7
Gamma 30-100 30.0Hz/99.99Hz 71.6
Mu 8-13 8.0Hz/12.99Hz 8.6
Table 1. EEG Frequencies obtained in Normal Persons
A graph is plotted for the obtained average frequency from the EEG signals of normal persons.
Fig 20. Graph of averaged frequencies obtained from normal people
B. Case 2: Epileptic Seizure Affected Person.
[image:10.612.194.418.512.646.2]Wave Frequency (In Hz)
Limit Lower / Higher
Avg Obtained
Freq (in Hz)
Delta 4 0.5Hz / 3.99Hz 2.14
Theta 4-7 4.0Hz / 6.99Hz 5.42
Alpha 7-14 7.0Hz/13.99Hz 7.1
Beta 15-30 15.0Hz/29.99Hz 21.2
Gamma 30-100 30.0Hz/99.99Hz 61.52
[image:11.612.199.414.257.362.2]Mu 8-13 8.0Hz/12.99Hz 6.2
Table 2. EEG Frequencies obtained in Epileptic Seizure Affected Persons
A graph is plotted for the obtained frequency from the EEG signals of Epileptic Seizure affected persons.
Fig 21. Graph of EEG frequencies obtained from Epileptic Seizure Affected people
Simultaneously, when the frequency crosses the threshold limit set. The notifications are triggered and the LED’s are lit in order to notify that the person has been affected with the epileptic seizure.
[image:11.612.201.411.432.580.2]Separating all the signals finally the complete frequency response graph obtained may be depicted as shown in the figure below.
Fig 22. The final frequency response graph obtained
VI. CONCLUSION
The results obtained from the conventional implementation of using various resistors and other filters is perfectly obtained and the frequency response is obtained. This helps the person to take precautions in timely manner so that further effects of the seizure can be avoided.
REFERENCES
[1] Tina Thomas, Mareena James, Roshmi Rose Shaji, Binu C Pillai, “Interpretation of Human Stages from EEG Signals Using LabVIEW”, IJARCE, 3rd March 2016.
[3] Seema Kute, Dr. Sonali Kulkarni, “Data acquisition through EEG for meditative states in BCI using non-invasive Emotiv Epoc Neuroheadset”, ICGTETM, 2016.
[4] Yash Mahajan, Tejas Nikam, Harish Nikte, Kedar Phadke , Prof. Deepali K “ Innovative brain wave based control system”, IJTRA, 2016. [5] Mdbelal Bin Heyat, Mohd Maroof Siddiqui, “Recording of EEG, ECG, EMG Signal”, IJARCES, Oct 2015.
[6] Mandeep Singh, Mooninder Singh, Ankita Sandel, “Data Acquisition Technique for EEG based Emotion Classification”, IJITKM, 2014. [7] M. Rajya Lakshmi, Dr. T. V. Prasad, Dr. V. Chandra Prakash, “Survey on EEG Signal Processing Methods”, IJARCES, January 2014. [8] Aruna Tyagi, Sunil Semwal, Gautam Shah, “A Review of Eeg Sensors used for Data Acquisition”, IJCA, 2012.