Abstract— In today’s economy and society, performance analyses in the services industries attract more and more attention. This paper presents an evaluation of 240 branches of one big Canadian bank in Greater Toronto Area using Data Envelopment Analysis (DEA). Special emphasis was placed on how to present the DEA results to management so as to provide more guidance to them on what to manage and how to accomplish the changes. Finally the potential management uses of the DEA results were presented.
Index Terms— Data Envelopment Analysis (DEA), Linear programming, Banking, Efficiency
I. INTRODUCTION
The banking industry is one of Canada’s leading industries. Canadians enjoy 19 domestic banks, 23 foreign bank subsidiaries and 21 foreign bank branches, which manage over $1.8 trillion in assets. They serve Canadians with 249,000 employees, more than 8,000 branches and 15,950 Automated Banking Machines (ABMs) [1]. The major five Canadian banks (Bank of Montreal, Canadian Imperial Bank of Commerce, Royal Bank of Canada, ScotiaBank and the Toronto Dominion Bank and Canada Trust), operate very large nationwide branch networks in all markets, from small towns to large metropolitan areas. They are not only essential for the security and strength of the financial system, but also make significant contributions to the economy across the country. They continue to pursue all the opportunities available to enhance their productivity and competitiveness. Consequently, productivity analysis in the banking industry has become part of their management practices. Top bank management wants to identify and eliminate the underlying causes of inefficiencies, thus helping their firms to gain competitive advantage, or, at least, meet the challenges from others.
Traditionally, banks have focused on various profitability measures to evaluate their performance. Usually multiple ratios are selected to focus on the different aspects of the operations. However, ratio analysis provides relatively insignificant amount of information when considering the effects of economies of scale, the identification of benchmarking policies, and the estimation of overall performance measures of firms. As alternatives to traditional bank management tools, frontier efficiency analyses allow management to objectively identify best practices in complex
Manuscript received December 13, 2008.
Zijiang Yang is with School of Information Technology, Atkinson Faculty of Liberal & Professional Studies, York University, TEL 3049, 4700 Keele Street, Toronto, Ontario, Canada, M3J 1P3 (Email:
operational environments. Compared to other approaches, Data Envelopment Analysis (DEA) is a better way to organize and analyze data since it allows efficiency to change over time and requires no prior assumption on the specification of the best practice frontier. In addition, it permits the inclusion of random errors if necessary. Since the introduction of DEA technology, a considerable number of researchers have applied it in financial service industry. Cook et al. [2] investigated the use of quantitative variable in bank branch evaluation using DEA. Paradi and Schaffnit [3] evaluated the performance of the commercial branches of a large Canadian bank. They introduce non-discretionary factors to reflect specific aspects of the environment a branch is operating in. Asmild et al. [4] evaluate the performance of Canadian banking industry over time. Bala and Cook [5] incorporate expert knowledge within the DEA framework. They first apply a discriminant or classification tool to quantify the functional relation that best captures the expert's mental model for performance. The outcome of this first phase is an orientation of variables to aid in the definition of inputs and outputs. The resulting orientation then defines the DEA model that makes up the second phase of the model. Camanho and Dyson [6] investigated the bank branch performance under price uncertainty. Halkos and Salamouris [7] measured the Greek bank performance using DEA. Isik and Kabir [8] utilize a DEA-type Malmquist Total Factor Productivity Change Index to examine productivity growth, efficiency change, and technical progress in Turkish commercial banks during the deregulation of financial markets in Turkey. In addition, Guan and Dipinder [9], Athanassopoulos and Giokas [10], Devaney and Weber [11], Pille and Paradi [12], Mercan al at. [13], Penny [14], also studied the use of DEA in financial institutions, to mention a few.
This paper presents an evaluation of 240 branches of one big Canadian bank in Greater Toronto Area using DEA. The rest of the paper is organized as follows. Section 2 gives a brief review of DEA. Section 3 provides the models and methodology utilized in this paper. Section 4 presents the DEA results and the potential use of the DEA results. Finally, the conclusions are given.
II. DEA BASICS
Production process can be defined as a process that can turn a set of resources into desirable outcomes by production units. During this process, efficiency is used to measure how well a production unit is performing in utilizing its resources to generate the derived outcomes. Each of the various DEA models seeks to determine which of the n decision making units (DMUs) define an envelopment surface that represents the best practice, referred to as the empirical production
Bank Branch Operating Efficiency: A DEA
Approach
function or the efficient frontier. Units that lie on the surface are deemed efficient in DEA while those units that do not, are termed inefficient. DEA provides a comprehensive analysis of relative efficiencies for multiple input-multiple output situations by evaluating each DMU and measuring its performance relative to an envelopment surface composed of other DMUs. Those DMUs forming the efficiency reference set are known as the peer group for the inefficient units. As the inefficient units are projected onto the envelopment surface, the efficient units closest to the projection and whose linear combination comprises this virtual unit form the peer group for that particular DMU. The targets defined by the efficient projections give an indication of how this DMU can improve to be efficient. Consider n DMUs to be evaluated, DMUj (j=1,2…n) consumes amounts Xj ={xij} of inputs (i=1, 2, …, m) and produces amounts Yj ={yrj} of outputs (r=1 ,…,
s ). The efficiency of a particular DMU0 can be obtained from the following linear programs (input-oriented BCC model [15]). 0 , s , 1 1 0 s -Y . . (1) 1 1 0 min , , , 0 0 ≥ − + = = − − − = + − ⋅ − + ⋅ − = − + s s X X Y t s s s z s s λ λ λ θ λ ε ε θ λ θ r r r
Performing a DEA analysis actually requires the solution of n linear programming problems of the above form, one for each DMU. The optimal variable θ is the proportional reduction to be applied to all inputs of DMU0 to move it onto the frontier. A DMU is termed efficient if and only if the optimal value θ* is equal to 1 and all the slack variables are zero. This model allows variable returns to scale. The dual program of the above formulation is illustrated by:
free u 1 1 0 1 1 . . (2) max 0 T 0 T 0 0 0 0 , ,
r r r • • − ≤ − − ≤ ≤ + − = + = ε ε µ µ µ ν µ T T T T v u X v Y X v t s u Y w
If the convexity constraint (1rλ=1) in (1) and the variable u0 in (2) are removed, the feasible region is enlarged, which results in the reduction in the number of efficient DMUs, and all DMUs are operating at constant returns to scale. The resulting model is referred to as the CCR model. The reader is advised to consult the textbook by Cooper, Seiford and Tone [16] for a comprehensive treatment of DEA theory and application methodology.
III MODELS AND METHODLOGY
A number of different approaches can be used for modeling the banking processes. Each of them is used to obtain a different aspect of efficiency measures. The most
important two approaches are the production approach and the financial intermediation approach.
Under the production approach, banks are viewed as institutions making use of various labour and capital resources to provide different products and services to customers. Thus, the resources being consumed such as labour and operating cost are deemed as inputs while the products and the services such as loans and deposits are considered as outputs of the banks. This model measures the cost efficiency of the banks.
Under the financial intermediation approach, banks are viewed as financial intermediaries which collect deposits and other loanable funds from depositors and lend them as loans or other assets to others for profit. The different forms of funds that can be borrowed and the cost associated with performing the process of intermediation are considered as inputs. The forms in which the funds can be lent are outputs of the model. This model measures the economic viability of the banks.
This paper introduces an operational efficiency model which adopts a production approach. This model examines how well different branches combine their resources to support the largest amount of possible services. The variables were selected based on traditional performance ratios, literature models, availability of the data and experts’ opinion.
Figure 1. DEA model
IV RESULTS AND DISCUSSIONS
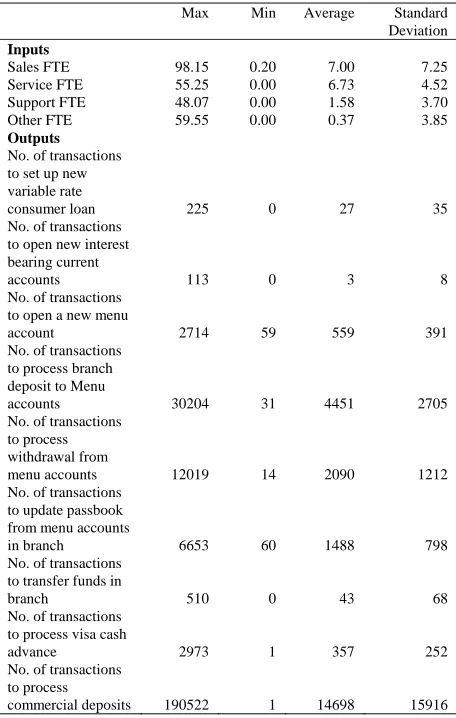
In this analysis, 240 branches of a big Canadian bank in Greater Toronto Area are evaluated. Summary statistics for the inputs and outputs are reported in Table 1.
[image:3.612.309.537.55.414.2]From the table one may find some input and output variables have zero values. No further action is taken since our software can deal with nonpositive values. It is also observed that the variations among the branches are quite big.
TABLE 1 SUMMARY STATISTICS OF OUTPUTS AND INPUTS
Max Min Average Standard
Deviation
Inputs
Sales FTE 98.15 0.20 7.00 7.25
Service FTE 55.25 0.00 6.73 4.52
Support FTE 48.07 0.00 1.58 3.70
Other FTE 59.55 0.00 0.37 3.85
Outputs
No. of transactions to set up new variable rate
consumer loan 225 0 27 35
No. of transactions to open new interest bearing current
accounts 113 0 3 8
No. of transactions to open a new menu
account 2714 59 559 391
No. of transactions to process branch deposit to Menu
accounts 30204 31 4451 2705
No. of transactions to process withdrawal from
menu accounts 12019 14 2090 1212
No. of transactions to update passbook from menu accounts
in branch 6653 60 1488 798
No. of transactions to transfer funds in
branch 510 0 43 68
No. of transactions to process visa cash
advance 2973 1 357 252
No. of transactions to process
commercial deposits 190522 1 14698 15916
The degree of correlation between inputs and outputs is an important issue that has great impact on the robustness of the DEA model. Thus, a correlation analysis is imperative to establish appropriate inputs and outputs. On the one hand, if very high correlations are found between an input variable and any other input variable (or between an output variable and any of the other output variables), this input or output variable may be thought of as a proxy of the other variables. Therefore, this input (or output) could be excluded from the model. On the other hand, if an input variable has very low correlation with all the output variables (or an output variable has very low correlation with all the input variables), it may indicate that this variable does not fit the model. Correlation analyses were done for each pair of variables and the following table presents the details.
Bank
Branch
Inputs
Sales FTE Service FTE Support FTE Other FTE
Outputs
No. of transactions to set up new variable rate consumer loan No. of transactions to open new interest bearing current accounts
No. of transactions to open a new menu account
No. of transactions to process branch deposit to Menu accounts
No. of transactions to process withdrawal from menu accounts No. of transactions to update passbook from menu accounts in branch
No. of transactions to transfer funds in branch
No. of transactions to process visa cash advance
Table 2 CORRELATION COEFFICIENTS BETWEEN THE INPUTS AND OUTPUTS
I1 I2 I3 I4 O1 O2 O3 O4 O5 O6 O7 O8 O9
I1 1.00 0.88 0.91 0.83 0.24 0.20 0.50 0.78 0.70 0.62 0.30 0.77 0.90
I2 0.88 1.00 0.80 0.71 0.31 0.11 0.59 0.85 0.82 0.75 0.27 0.86 0.81
I3 0.91 0.80 1.00 0.84 0.18 0.26 0.34 0.70 0.60 0.52 0.21 0.73 0.92
I4 0.83 0.71 0.84 1.00 0.13 0.11 0.36 0.63 0.54 0.43 0.16 0.68 0.74
O1 0.24 0.31 0.18 0.13 1.00 0.07 0.42 0.38 0.40 0.42 0.06 0.31 0.19
O2 0.20 0.11 0.26 0.11 0.07 1.00 0.02 0.11 0.09 0.11 0.14 0.12 0.25
O3 0.50 0.59 0.34 0.36 0.42 0.02 1.00 0.76 0.73 0.70 0.05 0.52 0.35
O4 0.78 0.85 0.70 0.63 0.38 0.11 0.76 1.00 0.95 0.90 0.17 0.83 0.71
O5 0.70 0.82 0.60 0.54 0.40 0.09 0.73 0.95 1.00 0.91 0.18 0.86 0.60
O6 0.62 0.75 0.52 0.43 0.42 0.11 0.70 0.90 0.91 1.00 0.15 0.75 0.53
O7 0.30 0.27 0.21 0.16 0.06 0.14 0.05 0.17 0.18 0.15 1.00 0.20 0.21
O8 0.77 0.86 0.73 0.68 0.31 0.12 0.52 0.83 0.86 0.75 0.20 1.00 0.70
O9 0.90 0.81 0.92 0.74 0.19 0.25 0.35 0.71 0.60 0.53 0.21 0.70 1.00
I1:Sales FTE I2: Service FTE I3:Support FTE I4:Other FTE
O1: No. of transactions to set up new variable rate consumer loan O2: No. of transactions to open new interest bearing current accounts O3: No. of transactions to open a new menu account O4: No. of transactions to process branch deposit to Menu accounts
O5: No. of transactions to process withdrawal from menu accounts O6: No. of transactions to update passbook from menu accounts in branch O7: No. of transactions to transfer funds in branch O8: No. of transactions to process visa cash advance
O9:No. of transactions to process commercial deposits
I did not find any evidence of very high correlation between any one input variable and any other (nor between output variables) and any one input variable having very low correlation with any of the output variables (nor between output variable and input variables) in the above five tables. This is a reasonable validation of my DEA models. Otherwise, the sensitivity analysis on the impact of including and excluding different variables on the efficiency should be performed.
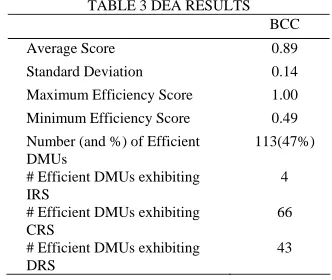
The input oriented BCC model is run and Table 3 summarises the results for the model.
TABLE 3 DEA RESULTS
BCC
Average Score 0.89
Standard Deviation 0.14
Maximum Efficiency Score 1.00
Minimum Efficiency Score 0.49
Number (and %) of Efficient DMUs
113(47%)
# Efficient DMUs exhibiting IRS
4
# Efficient DMUs exhibiting CRS
66
# Efficient DMUs exhibiting DRS
43
From this table, we can conclude that BCC model identified 89% technical efficiency on average. The issue of scale inefficiencies is explored with greater detail by considering returns-to-scale (RTS) indicators. Among 113 efficient branches, 4 branches operate under increasing–returns-to-scale, 66 branches operate under constant–returns-to-scale, and the remaining 43 branches operate under decreasing-returns-to-scale.
[image:4.612.331.546.340.432.2]The efficiency score distribution is given in Figure 2.
Figure 2 Efficiency score distribution The distribution of efficiency scores is skewed towards the higher efficiency scores. Generally speaking, this model identified potential savings for the 240 branches in GTA from the indicated performance improvements. The average efficiency score of 0.89 implies that the bank branches could use about 11 percent less labour and expenses to produce their outputs.
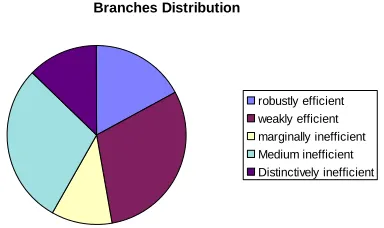
It is very important to present results in an easy to understand manner. Thus, we split the branches into groups based on the efficiency scores in order to find further insights [17]:
• The robustly efficient units that will appear in many reference sets and are likely to remain efficient unless there were major shifts in their fortunes.
• The weakly efficient units that will typically appear in only one or two reference sets and may well drop below 1.0 if there was even a small drop in the value of an output variable (or a small increase in the value of an input variable).
• The marginally inefficient units will have an efficiency rating in excess of 0.9 (but less than 1.0) and could raise their score towards 1.0 with a relatively small amount of improvement in their operating results.
• Medium inefficient units that have an efficiency score between 0.7 and 0.9.
Efficiency Score Distribution
1 6
24 31 39
139
0 20 40 60 80 100 120 140 160
[image:4.612.95.261.455.595.2]• Distinctively inefficient units. If the efficiency score of a unit is less than 0.7, then this unit would have significant difficulties making themselves efficient in the short term.
[image:5.612.96.288.154.268.2]The units in the robustly efficient group could be examples for those inefficient units, as they manage their resources better.
Figure 3 shows the distribution of the branches in each category.
Branches Distribution
robustly efficient weakly efficient marginally inefficient Medium inefficient Distinctively inefficient
Figure 3 Branches distribution
DEA results also highlight the reasons for both favourable and poor use/production of resources/outcomes involved in the unit’s performance –
[image:5.612.151.460.348.470.2]factors that contributed to or detracted from the DMUs’ efficiency rating. Nevertheless, one of the most powerful pieces of information that is obtained by a DEA analysis is the set of target values for those assessed as inefficient. The reference set provides strong indications of what type and amounts of inputs and outputs are needed to make the inefficient units efficient. Since input oriented DEA models are used in the analysis, there will be target input values that the inefficient units could use to achieve an efficiency score of 1.0. Table 4 provides DEA efficiency scores and reference sets for some of the DMUs in this analysis. For example, in order for DMU4302 to become efficient, it should reduce each of its input resources including sales FTE, service FTE, support FTE and other FTE by 16%. More specifically, based on the reference sets DMU4302 should consume X1842*0.44 + X7142*0.14 + X9282*0.42 (Xi is the input vector for DMU i) amount of input to generate its observed output level. In addition, the DEA scores can be used to estimate the potential savings from performance improvements. If all the branches can perform efficiently, by using the target input and output values, the bank could save as much as 11% of its resources from a theoretical point of view. In practice, the saving will almost certainly be substantially less.
TABLE 4. DEA EFFICIENCY SCORES AND REFERENCE SETS.
DMU No BCC
Score
Reference set (lambda)
2 1.00 2 1
102 1.00 102 1
1902 0.70 732 0.55 1032 0.34 2232 0.09 9662 0.03
2322 0.82 222 0.37 1842 0.31 5432 0.12 8622 0.20
2342 1.00 2342 1.00
2402 0.76 3132 0.12 3412 0.03 3732 0.41 3902 0.44
4152 0.80 3632 0.38 7942 0.01 9552 0.61
4302 0.84 1842 0.44 7142 0.14 9282 0.42
V CONCLUSIONS
This paper adopts DEA to evaluate the branch performance in GTA for a large Canadian bank. The branches operate fairly efficiently on the whole although there is still room for improvement. Special emphasis was placed on how to present the DEA results to management so as to provide more guidance to them on what to manage and how to accomplish the changes. Finally, recommendations to management’s use of DEA results were given.
REFERENCE
[1]. “Canadian Bank Facts”, Canadian Bankers Association, 2005 Edition.
[2]. Cook, W.D., Hababou, M. and Tuenter, H.J., “Multicomponent Efficiency Measurement and Shared Inputs in Data Envelopment Analysis: an Application to Sales and Service Performance in Bank Branches”, Journal of Productivity Analysis 14, 209-224, 2000. [3]. Paradi, J.C. and Schaffnit Claire, “Commercial Branch Performance Evaluation and Results Communication in a Canadian Bank - a DEA Approach”, European Journal of Operational Research 156, No. 3, 719-735, 2004.
[4]. Asmild Mette, Paradi J. C., Aggarwall Vanita, and Schaffnit Claire, “Combining DEA Window Analysis with the Malmquist Index Approach in a Study of the Canadian Banking Industry”, Journal of Productivity Analysis 21, No. 1, 67-89, 2004.
[5]. Bala, Kamel and Cook, Wade D., “Performance Measurement with Classification Information: an Enhanced Additive DEA Model”, Omega 31, No. 6, pp439-450, 2003.
[6]. Camanho A.S., Dyson and R.G., “Cost Efficiency Measurement with Price Uncertainty: a DEA Application to Bank Branch Assessments”, European Journal of Operational Research 161, No. 3, 432-446, 2005. [7]. Halkos, G.E. and Salamouris, D.S., “Efficiency Measurement of the Greek Commercial Banks with the Use of Financial Ratios: a Data Envelopment Analysis Approach”, Management accounting Research 15, No. 2, 201-224, 2004.
[8]. Isik, Ihsan and Kabir Hassan, M, “Financial Deregulation and Total Factor Productivity Change: An Empirical Study of Turkish Commercial Banks”, Journal of Banking and Finance 27, No. 8, 1455-1485, 2003. [9]. Guan, H.L. and Dipinder, S.R., “Competition, Liberalization and Efficiency: Evidence from a Two-Stage Banking Model on Banks in Hong Kong and Singapore”, Managerial Finance 31, No. 1, 52-77, 2005. [10]. Athanassopoulos, A.D. and Giokas, D., “The Use of Data Envelopment Analysis in Banking Institutions: Evidence from the Commercial Bank of Greece, Interfaces, Vol 30, no 2, 81-95, 2000. [11]. Casu, B., Girardone, C., and Molyneux, P., “Productivity Change in European Banking: a Comparison of Parametric and Non-Parametric Approaches”, Journal of Banking and Finance 28, No. 10, 2521-2540, 2004.
Regulatory Environment”, European Journal of Operational Research 139, No. 2, 339-350, 2002.
[13]. Mercan, M., Reisman A., Yolalan, R., and Emel, A.B., “The effect of Scale and Mode of Ownership on the Financial Performance of the Turkish Banking Sector: Results of a DEA-Based Analysis”, Socio-economic Planning Sciences 37, No. 3, 185-202, 2003. [14]. Neal, Penny, “X-Efficiency and Productivity Change in Australian Banking”, Australian Economic Papers, Vol 43, Issue 2, 174-191, 2004 [15]. R. D. Banker, A. Charnes and W. W Cooper, "Models for Estimating Technical and Scale Efficiencies in DEA", Management Science 30(9): pp.1078-1092, 1984.
[16]. Cooper, W.W., L.M. Seiford and K. Tone, “Data Envelopment Analysis: A Comprehensive Text with Models, Applications, References”, Kluwer Academic Publishers, Boston, 2000.