Self-assessed health and its aspects in the case of
Mongolia
Amarsanaa Gan-Yadam1,2,3*, Ryoji Shinohara1, Yuka Sugisawa1,2, Emiko Tanaka1,2, Taeko Watanabe1, Maki Hirano1, Etsuko Tomisaki1, Kentaro Morita1, Yoko Onda1, Yuri Kawashima1, Kentaro Toketake1, Yukiko Mochizuki1, Mayumi Nanba1, Tokie Anme1
1Graduate School of Comprehensive Human Sciences, University of Tsukuba, Tsukuba, Japan; *Corresponding Author: [email protected]
2Japan Society for the Promotion of Science, Tokyo, Japan
3Philanthropy Centre for Children and the Elderly, Ulaanbaatar, Mongolia
Received 20 April 2012; revised 11 May 2012; accepted 25 May 2012
ABSTRACT
Self health assessment is a simple indicator that is widely used for measuring an individual’s perception of his or her overall health. Many studies have been conducted by way of showing which particular aspects should be included in health self assessment, especially in developed world. In the developing world, however, very few studies have examined self health assess-ment. The aim of this study was to identify par-ticular aspects and associations in self health assessment and differences between subgroups in Ulaanbaatar, Mongolia. The area sampling approach and Kish tables were used for select-ing respondents. Total 500 respondents were surveyed by paper-based questionnaires. Spear- man’s analysis and multiple logistic regression analysis were used to show relations between variables. Socio-demographic status, such as age and gender, proved to be important in self health assessment. Other factors affecting self health assessment included the number of fam-ily members, dafam-ily life and lifestyles, social en-vironment, community motivation, and utiliza-tion of health services. Women, the elderly, or people with less-thannormal access to informa-tion suffer from poor self-assessed health. Peo-ple who are socially inactive and who have poor living conditions are less likely to use health care services and are likely to assess their health as “poor”. In order to reduce the poor self-assessed health status it is important to address disparities in socioeconomic factors, such as age, gender, employment, and residen-tial area. In addition, more attention should be paid to community and health services, as well
as to health promotion and empowerment ac-tivities, including income-generation activities. Further research is also needed, however, for better understanding of about the local people and their health-related issues.
Keywords:Self-Assessed Health;
Socio-Demographic Status; Daily Life and Life-Style; Community Motivation; Social Environment; Health Service Utilization and Mongolia
1. INTRODUCTION
Self-assessed health (SAH) is a simple measurement derived from gathering data in research, and in the sci- entific literature, SAH is also referred to as self-rated, self-perceived, or self-reported health. Although some doubts remain concerning this single measure [1,2], SAH indicators are widely used in international studies, espe-cially in the developed world. A large number of studies present the relationship between SAH and other health- related aspects, including health conditions, medical di-agnoses, psychosocial, and emotional status. In several studies, the relationship between mortality risks or mor-bidity has been studied extensively [3-6]. For example, a meta analysis from Karen De Salvo et al. suggested that “poor” SAH carries a two times higher mortality risk than an “excellent” self-assessment [7]. Additionally, some studies have shown a relationship between self- assessed health and other health aspects, such as physical health problems, physiological factors, long-standing illness, or functional capacities [8-10].Some studies have also confirmed that such aspects as life or health service satisfaction, stress, social role, and health behavior are significantly related to SAH [11-14].
have shown that SAH depends on gender, age, and in- come. Individuals with higher socio-demographic and economic status usually have better health than others do [15-18]. Even though many studies have been conducted to determine the factors of self health assessment, there is still a need to identify the local aspects of SAH in the developing world. In this article, we explored the asso- ciations among various factors influencing self health assessment in Ulaanbaatar, Mongolia.
Mongolia is the least densely populated country in the world with a population of 2.7 million people. About 63% of the total population of Mongolia lives in urban areas, including the capital city of Ulaanbaatar and other medium-sized and small towns. The remaining popula-tion lives as nomadic herders in the countryside. More than 1.1 million residents live in Ulaanbaatar [19] and the migration stream to Ulaanbaatar is increasing year by year. About 40% of the city population lives in apartment buildings, and the remaining residents dwell in a peri- urban area called the ger (traditional felt dwelling) dis-tricts, which lack modern infrastructure and where house- hold incomes are 43% lower than those in urban house-holds [20]. This kind of inhomogeneous society, with its high levels of inequality, and the considerable rise in the population of Ulaanbaatar create social and health prob-lem. Since the end of the socialist regime, people’s life-style and health behavior has altered dramatically toward physical and social inactivity [21]. However, life expec-tancy at birth has increased in the past few years (in 2009, the life expectancy at birth was 65 years for men and 74 years for women) [22], even though adult mortality rates are rising, especially the male adult mortality rate. Car-diovascular disease, cancer, and injuries have been the leading causes of death in the last 10 years [23]. These high rates of lifestyle-related diseases have increased rapidly because of urbanization, physical activity, nutri-tion, and tobacco and alcohol use. Today, family practi-tioners deliver primary health care, services, and preven-tive care. Although the standard of Family Group Prac-tice specifies one family practitioner per 1300 people, in actuality this number is doubled per family practitioner [24]. Therefore, because of work overload, family group practitioners cannot provide such services as prevention, advocacy, and training.
For reducing diseases and improving health care ser-vices among the local residents, practices need to en-hance primary health care, health services, health promo- tion, and health education activities. Policymakers should also be aware of the results of health-related research, considering it when making and planning medical ser-vices and formulating health care policies.
This study also investigates whether differences may exist between societies having different cultures. Resi-dents in Mongolia are ethnically homogeneous and have
a nomadic and Buddhist culture. Therefore, some differ-ences in self health assessment may exist as compared to that of other nations. Some previous studies have also noted that cultural differences between countries may influence health evaluation [25,26].
2. METHODS
2.1. Study Population and Data Collection
Five hundred respondents living in urban and peri- urban communities in Ulaanbaatar, Mongolia, were se-lected for this survey. The respondents were surveyed through a paper-based questionnaire, and all participants were adults aged 18 years or over. The questionnaire included such aspects as SAH status, social environment, community motivation, and utilization of health services. Information on socio-demographic conditions and daily life and life-style were also collected. The set of socio demographic variables included gender, age, education, employment, marriage status, and household size. The daily life and life-style factors included experiences in using media, hobbies and other free time use, physical exercise, self-perceived quality of life, and smoking and drinking habits. The set of social environment variables included satisfaction with the residential area, commu-nity motivation, and duration of residence in one place. The measures of health service utilization included medi- cation usage, periodic health exams, health-seeking be-havior, and hospital service cost.
The sampling method was based on the area sampling approach. In the first stage of sampling, Ulaanbaatar city was chosen, which consists of 45% of all resident popu-lation of Mongolia [27]. In the second stage, three dis-tricts within the city were purposely selected because of their density and the centralization. In the last stage, households were randomly selected. Within the house-hold, Kish tables, which provide equal probability, were used for selecting respondents. Every respondent repre-sents one household.
2.2. Data Analysis
Self-assessed health was the key dependent variable and it was measured through a single question, “How is your health in general?” with the response categories of “very good” (1) “good” (2) “fair” (3) “bad” (4) or “very bad” (5). We included four groups of confounders in the analyses: socio-demographic variables, daily life and lifestyle factors, social environment, and health service status and utilization.
versus (3, 4, and 5) and independent variables into 2 categories. All relationships were presented with 95% confidence intervals (CIs), and two-sided p-values of less than 0.05 were considered to be significant. The missing data is excluded from the analyses; thus, the final ana-lytic sample size was 457 respondents. The data was en-tered into data analysis software, the Statistical Analysis System (SAS 9.1).
3. RESULTS
3.1. Demographic Characteristics of the Participants
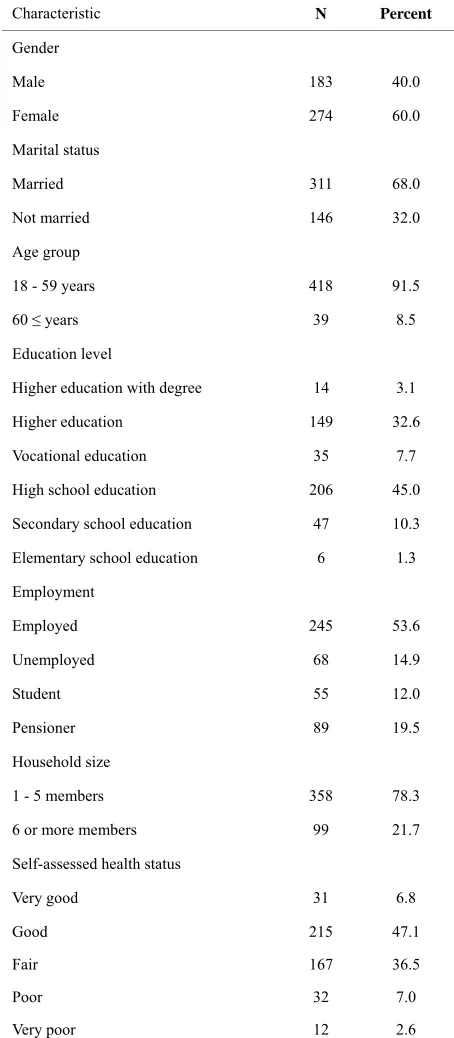
The demographic characteristics of the respondents are presented in Table 1. A majority of the respondents
were women (60.0% versus 40.0%). The respondents’ age span was from 18 to 83 years and the median age of the respondents was 35 years. Respondents aged 60 and over constituted 8.5% of the total. Most of the respon-dents were married (68.0%). The proportion of partici-pants with a high school education (high school ates, 206 or 45.0%) and higher education (college gradu-ates and beyond, 149 or 32.6%) was quite high. Regard-ing employment status, 14.9% of the respondents indi-cated that they were unemployed, and the rest of the re-spondents were students, pensioners, and employees. The largest proportion assessed their health as good (47.1%) or fair (36.5%), with much smaller percentages for poor or very poor (9.6%) and very good (6.8%).
3.2. Statistical Analyses
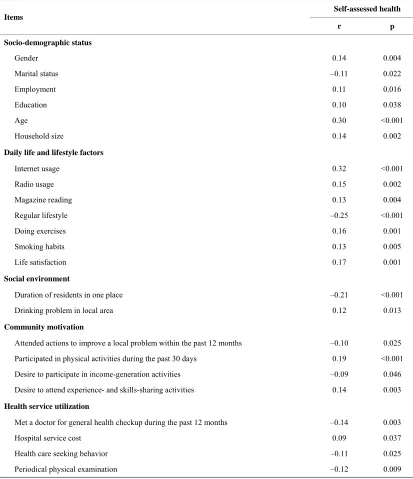
According to the Spearman analysis, several signifi-cant correlations exist between SAH and the other as-pects (Table 2). From the set concerning socio-demo-
[image:3.595.309.536.104.623.2]graphic status, age (r = 0.30, p < 0.001) had a strong correlation with SAH. The next considerable factors were household size (r = 0.14, p = 0.002), gender (r = 0.14, p = 0.004) employment (r = 0.11, p = 0.016), and education (r = 10, p = 0.038). Marital status showed a negative correlation with the SAH (r = –0.11, p = 0.022), as unmarried persons had a significantly better SAH than married ones. Some of the factors related to daily life and lifestyles were also significantly correlated with SAH. One interesting finding concerns the Internet: those who use the Internet had self-assessed good health compared to people who did not use the Internet (r = 0.32, p < 0.001). In addition, persons who use the radio (r = 0.15, p = 0.002) and read magazines (r = 0.13, p = 0.004) had better SAH. Greater life satisfaction was associated with significantly better SAH (r = 0.17, p = 0.001). Those who exercise (r = 0.16, p = 0.001) and do not smoke (r = 0.13, p = 0.005) were significantly associated with good SAH. People without regular lifestyles were likely to
Table 1. General characteristics of the survey respondents.
Characteristic N Percent
Gender
Male 183 40.0
Female 274 60.0
Marital status
Married 311 68.0
Not married 146 32.0
Age group
18 - 59 years 418 91.5
60 ≤ years 39 8.5
Education level
Higher education with degree 14 3.1
Higher education 149 32.6
Vocational education 35 7.7
High school education 206 45.0
Secondary school education 47 10.3
Elementary school education 6 1.3
Employment
Employed 245 53.6
Unemployed 68 14.9
Student 55 12.0
Pensioner 89 19.5
Household size
1 - 5 members 358 78.3
6 or more members 99 21.7
Self-assessed health status
Very good 31 6.8
Good 215 47.1
Fair 167 36.5
Poor 32 7.0
Very poor 12 2.6
Table 2. Relationship between self-assessed health and subgroups (Spearman’s analysis).
Self-assessed health Items
r p
Socio-demographic status
Gender 0.14 0.004
Marital status –0.11 0.022
Employment 0.11 0.016
Education 0.10 0.038
Age 0.30 <0.001
Household size 0.14 0.002
Daily life and lifestyle factors
Internet usage 0.32 <0.001
Radio usage 0.15 0.002
Magazine reading 0.13 0.004
Regular lifestyle –0.25 <0.001
Doing exercises 0.16 0.001
Smoking habits 0.13 0.005
Life satisfaction 0.17 0.001
Social environment
Duration of residents in one place –0.21 <0.001
Drinking problem in local area 0.12 0.013
Community motivation
Attended actions to improve a local problem within the past 12 months –0.10 0.025
Participated in physical activities during the past 30 days 0.19 <0.001
Desire to participate in income-generation activities –0.09 0.046
Desire to attend experience- and skills-sharing activities 0.14 0.003
Health service utilization
Met a doctor for general health checkup during the past 12 months –0.14 0.003
Hospital service cost 0.09 0.037
Health care seeking behavior –0.11 0.025
Periodical physical examination –0.12 0.009
a desire to attend experience and skills sharing activities (r = 0.14, p = 0.003) were likely to assess their health as good. Some negative correlations were also observed between community motivation and SAH. The persons who participated in actions to improve local problems (r = –0.10, p = 0.025) and who had a desire to participate in income-generation activities (r = –0.09, p = 0.046) were likely to assess their health as poor. Some negative cor-relations were found in terms of health service use. Per-sons who had periodic physical examinations (r = –012, p = 0.009), and who had met a doctor for their general health within the last 12 months (r = –0.14, p = 0.003)
were likely to assess their health as poor. Persons who think that hospital service is expensive were also likely to assess their health as poor (r = 0.09, p = 0.037). The interaction between variables were also tested (Table 3).
However some statistically significant relationships were existed between variables, this study revealed the inde-pendently related factors to SAH. Table 4 presents the
Table 3. Correlation between subgroups (Spearman’s analysis).
Items 1 2 3 4 5 6 7 8 9 10 11
1 Gender 1
2 Age –0.01 1
3 Household size 0.06 0.10** 1
4 Internet usage 0.07 0.49* 0.13* 1
5 Regular lifestyle –0.05 –0.18* –0.14* –0.29* 1
6 Life satisfaction 0.01 0.08 0.04 0.15* –0.20 1
7 Duration of residents in one place 0.06 –0.30* –0.17* –0.20* 0.21* 0.08 1
8 Attended actions to improve a local problem within the past 12 months –0.06 –0.17* 0.04 –0.01 –0.13* –0.01 0.04 1
9 Desire to attend experience and skills sharing activities 0.02 0.04 0.03 0.10** 0.09 –0.04 –0.10 0.11** 1
10 Met a doctor for general health checkup during the past 12 months –0.11** –0.21* –0.15* –0.13* 0.07 0.05 0.10** 0.08 –0.06 1
11 Hospital service cost 0.01 0.08 –0.02 0.07 –0.01 0.11** 0.04 –0.09** –0.01 –0.01 1
Note: Only the variables that met the statistical significant level in multiple logistic analysis were presented; **0.01 ≤ p < 0.0.05; *p < 0.0.01.
Table 4. Factors related to self-assessed health (multiple logistic regression analysis).
Self-assessed health Items
OR 95% CI p
Socio-demographic status
Gender 1.81 1.09 3.00 0.023
Marital status 1.26 0.74 2.17 0.396
Employment 0.74 0.43 1.29 0.293
Education 0.17 0.02 1.77 0.138
Age 5.78 1.92 16.5 0.002
Household size 1.75 1.01 3.02 0.045
Daily life and life style factors
Internet usage 2.27 1.33 3.86 0.003
Radio usage 0.98 0.61 1.57 0.924
Magazine reading 1.09 0.66 1.82 0.733
Regular life style 0.46 0.21 1.01 0.052
Doing exercises 1.03 0.64 1.67 0.889
Smoking habits 0.67 0.38 1.17 0.155
Life satisfaction 1.94 1.16 3.24 0.011
Social environment
Duration of residents in one place 0.54 0.34 0.87 0.012
Drinking problem in local area 1.45 0.87 2.41 0.151
Community motivation
Attended actions to improve a local problem within the past 12 months 0.47 0.29 0.75 0.002
Participated physical activities during the past 30 days 1.49 0.87 2.58 0.150 Desire to participate in income-generation activities 0.91 0.58 1.43 0.679
Desire to attend experience- and skills-sharing activities 2.75 1.07 7.06 0.035
Health service utilization
Met a doctor for general health checkup during the past 12 months 0.60 0.38 0.95 0.031
Hospital service cost 1.76 1.12 2.77 0.015
Health care seeking behavior 1.09 0.69 1.72 0.722
Periodical physical examination 0.88 0.44 1.79 0.731
[image:5.595.65.538.339.740.2]were significantly associated with SAH. Also using the Internet (OR = 2.27, CI: 1.33 - 3.86) and life satisfaction (OR = 1.94, CI: 1.16 - 3.24) were statistically associated with SAH in the set of daily life and lifestyle factors. Persons who had stayed in one place for more than 10 years assessed their health as good (OR = 0.54, CI: 0.34 - 0.87). Those who had attended community actions within the past 12 months to improve their local area assessed their health as poor (OR = 0.47, CI: 0.29 - 0.75). The people who desire to attend experience and skills- shar-ing activities rated their health as good (OR = 2.75, CI: 1.07 - 7.06). The analyses also showed that those who had seen a doctor within the past 12 months were inde-pendently associated with SAH (OR = 0.60, CI: 0.38 - 0.95). Furthermore, hospital service cost was signifi-cantly related to the SAH (OR = 1.76, CI: 1.12 - 2.77).
4. DISCUSSION
In the developing world, use of SAH as a measure in research is not common; therefore, in general the litera-ture does not contain much on this topic. The first benefit of this study is that it included adult populations in the urban and peri-urban area of Mongolia, one of the de-veloping countries in central Asia. Second, it examined the aspects associated with SAH status among the par-ticipants in the local area, which is the first in the country to report SAH and its determinants.
We found that several aspects are associated with SAH. First, there was a significant association between socio- demographic status and self health assessment. In par-ticular, SAH depended upon age and gender, as shown in other studies [13,16]. As the age increased, the partici-pants were less likely to assess their health as “good.” After age 60, SAH declined for both men and women. Although lower SAH among the elderly may reflect physical functions and changes, it is nonetheless benefi-cial to promote a healthier lifestyle and empowerment programs for the local community, especially for the older populations in urban and peri-urban areas in Mon-golia. The other noteworthy finding was related to gender, which affects SAH. The disparity in the life expectancy of the sexes in Mongolia is very high, as females are expected to live about nine years longer than males [22]; therefore, women were more likely to report poor health compared with men. This suggests that gender inequali-ties may exist in health care in Mongolia. Furthermore, attention should be paid to other social affairs of women and the local community, such as access to health-related information, health services, and social welfare. On the other hand, lifestyle habits and the roles of women and men in the family and society may influence the self health assessment; hence, this aspect needs further ex- amination. Household size was also important to SAH,
as the respondents with five or more family members were more likely to report their health as poor. Although the average family size has dropped over the past few decades, poor families often want more children and have larger family sizes than middle-income or richer families in Mongolia. Large family size has been consid-ered one of the causes of poverty in developing countries [28]; thus, for improving health status among poor fami-lies, improvement is needed in prevention activities, health services—especially reproductive health services— and in addressing gender inequalities and inadequate information. However, the multiple logistic analyses showed that age, gender, and household size have a sig-nificant relationship with SAH, as well as employment, education, and marital status. Poor self health assessment is correlated to unemployment and poor education, as in other studies [15,29]. We also found that non-married people were healthier than those who are married. This finding may be because most of the non-married respon-dents were young people in this study, and there may also be cultural and social reasons among married people, such as the living conditions of the families, household sizes, and culture-oriented marital duties.
Second, some aspects related to daily life and lifestyle factors also had a significant relationship with SAH in this study. Respondents who use the Internet, listen to the radio, and read magazines have a higher SAH. According to the 2010 Population and Housing Census of Mongolia, 30.6% of the total population uses the Internet regularly [27]. However, in Mongolia, Internet service is still lim-ited in some areas, especially peri-urban and rural areas. Hence, people who have better living conditions can ac-cess the Internet and get more information than others can. Also among older people, the level of Internet and computer usage is very low. In addition, we found a rela-tionship between SAH and life satisfaction. The people who have better SAH enjoy their lives more than those who have poor self health assessment. The next factor that correlated with SAH was regular lifestyle. In Mon-golia, people’s lifestyles have changed dramatically since the collapse of the socialist regime in 1990. Many people have become more physically inactive, with accompa-nying poor health habits, and not many community- based organizations exist, especially for the unemployed and the elderly [21]. These factors may explain the result that people who do not have regular lifestyles, but who are active have better SAH than those who have regular lifestyles. Even though a healthier life—such as having a regular lifestyle, exercising, and not smoking—corre- lated with better SAH, these factors were not proven as predictors of SAH by the multiple logistic analyses in this study.
population in Ulaanbaatar increased by 31% from 2000 to 2007. People who migrated into the capital city usu-ally settled into peri-urban areas, and life was not secure for many of them [30]. The migrants, especially those who live in peri-urban areas, may need attention as they are more likely to suffer from SAH.
Furthermore, community motivation, such as attending community activities and having a desire to attend ex-perience- and skills-sharing activities showed a signifi-cant relationship with SAH. From these findings, we may deduce that the people who suffered from poor SAH had not attended actions to improve local problems within the past year. Other studies have also found that social participation is important for health and that peo-ple who attend more social activities tend to report better health [31]. The people who have better SAH also have a desire to attend experience- and skills-sharing activities compared to the people who suffer from poor SAH.
Last, but not least, it should be noted that some factors related to health service utilization also have a significant relationship with SAH. In particular, the people who had been to a doctor for a general health checkup during the preceding 12 months had poorer health than others, and poor SAH also correlated to periodic physical exams. This finding implies that among the local residents, health promotion and health prevention activities are not promoted and that only those who have poor health use hospital services. In addition, we found that poor SAH and high costs for hospital service were related. This finding may indicate that it is still hard for people with low income to get health care services compared with high-income residents.
This study has some limitations: first, we did not con-sider hospital-diagnosed morbidity and medical condi-tions. Second, income was not included in the analysis, because household income was missing for a substantial minority of the study sample. Third, we did not assess children’s status, as the survey did not include children under age 17. Finally, we chose SAH as a dependent variable.
5. CONCLUSIONS
The present study analyzed the particular aspects that affect SAH in Mongolia. Although, the sample size was relatively small, the study findings were important, a step toward identifying the aspects involved in self health assessment. In addition, the results of this study may reveal the population health status.
In order to reduce the gap in health status, it is impor-tant to address disparities in socioeconomic factors, such as age, gender, employment, and residential area. The level of disease prevention and periodic exams is very low in the community, and to improve SAH, more atten-tion should be paid to community and health services, as
well as to health promotion and empowerment activities, including income-generation activities. Finally, we sug-gest that because there is still much to do, these kinds of studies should be continued in Mongolia in order to pro-vide understanding of the mechanisms that affect poor SAH in both urban and rural areas.
6. ACKNOWLEDGEMENTS
We thank all the study participants and all our lab members, who participated and collaborated in this study. Their comments and sugges-tions were very valuable.
REFERENCES
[1] Subramanian, S.V., Huijts, T. and Avendano, M. (2010) Self-reported health assessments in 2002 World Health Survey: How do they correlate with education? Bulletin of the World Health Organization, 88, 131-138.
doi10.2471/BLT.09.067058
[2] Jürges, H., Avendano, M. and Mackenbach, J.P. (2008) Are different measures of self-rated health comparable? An assessment in five European countries. European Jour- nal of Epidemiology, 23, 773-781.
doi10.1007/s10654-008-9287-6
[3] McFadden, E., Luben, R., Bingham, S., Kinmonth, A.L. and Khaw, K.T. (2009) Does the association between self- rated health and mortality vary by social class? Social Science and Medicine, 68, 275-280.
doi10.1016/j.socscimed.2008.10.012
[4] Benjamins, M.R., Hummer, R.A., Eberstein, I.W. and Nam, C.B. (2004) Self-reported health and adult mortality risk: An analysis of cause-specific mortality. Social Science and Medicine, 59, 1297-1306.
doi10.1016/j.socscimed.2003.01.001
[5] Liavaag, A.H., Dørum, A., Fosså, S.D., Tropé, C. and Dahl, A.A. (2009) Morbidity associated with “self-rated health” in epithelial ovarian cancer survivors. BMC Cancer, 9, 2.
doi10.1186/1471-2407-9-2
[6] Idler, E.L. and Benyamini, Y. (1997) Self-rated health and mortality: A review of twenty-seven community studies.
Journal of Health and Social Behavior, 38, 21-37.
doi10.2307/2955359
[7] De Salvo, K.B., Bloser, N., Reynolds, K., He, J. and Munt- ner, P. (2005) Mortality prediction with a single general self-rated health question: A meta-analysis. Journal of Gen- eral Internal Medicine, 20, 267-265.
[8] Arnadottir, S.A., Gunnarsdottir, E.D., Stenlund, H. and Lun- din-Olsson, L. (2011) Determinants of self-rated health in old age: A population-based, cross-sectional study using the international classification of functioning. BMC Pub- lic Health, 11, 670. doi10.1186/1471-2458-11-670
[9] Mackenbach, J.P., Simon, J.G., Looman, C.W.N. and Joung, I.M.A. (2002) Self-assessed health and mortality: Could psychosocial factors explain the association? Interna- tional Journal of Epidemiology, 31, 1162-1168.
doi10.1093/ije/31.6.1162
health and limiting longstanding illness: Inter-relationships with morbidity in early adulthood. International Journal of Epidemiology, 30, 600-607. doi10.1093/ije/30.3.600
[11] Sundaram, V., Helweg-Larsen, K., Laursen, B. and Bjer- regaard, P. (2004) Physical violence, self rated health, and morbidity: Is gender significant for victimisation? Jour- nal of Epidemiology and Community Health, 58, 65-70.
doi10.1136/jech.58.1.65
[12] Ford, J., Spallek, M. and Dobson, A. (2008) Self-rated health and a healthy lifestyle are the most important pre- dictors of survival in elderly women. Age and Ageing, 37,
194-200. doi10.1093/ageing/afm171
[13] Piko, B. (2000) Health-related predictors of self-perceived health in a student population: The importance of physic- cal activity. Journal of Community Health, 25, 125-137.
doi10.1023/A:1005129707550
[14] Siahpush, M., Spittal, M. and Singh, G.K. (2008) Happi- ness and life satisfaction prospectively predict self-rated health, physical health, and the presence of limiting, long- term health conditions. American Journal of Health Pro- motion, 23, 18-26. doi10.4278/ajhp.061023137
[15] Mackenbach, J.P., Stirbu, I., Roskam, A-J.R., Schaap, M.M., Menvielle, G., Leinsalu, M. and Kunst, A.E. (2008) Socio-economic inequalities in health in 22 European coun- tries. New England Journal of Medicine, 358, 2468-2481.
doi10.1056/NEJMsa0707519
[16] McFadden, E., Luben, R., Bingham, S., Wareham, N., Kin- month, A.L. and Khaw, K.T. (2008) Social inequalities in self-rated health by age: Cross-sectional study of 22457 middle-aged men and women. BMC Public Health, 8, 230. doi10.1186/1471-2458-8-230
[17] Singh-Manoux, A., Dugravot, A., Shipley, M.J., Martikai- nen, P., Goldberg, M. and Zins, M. (2007) The associa- tion between self-rated health and mortality in different socioeconomic groups in the Gazel cohort study. Interna- tional Journal of Epidemiology, 36, 1222-1228.
doi10.1093/ije/dym170
[18] Kennedy, B.P., Kawachi, I., Glass, R. and Prothrow-Stith, D. (1998) Income distribution, socioeconomic status, and self rated health in the United States: Multilevel analyses.
British Medical Journal, 317, 917-921.
doi10.1136/bmj.317.7163.917
[19] Statistical Yearbook 2009 (2009) National Statistic Office of Mongolia. http://www.nso.mn/v3/
[20] Kamata, T., Reichert, J.A., Tsevegmid, T., Kim, Y. and Sed- gewick, B. (2010) Enhancing policies and practices for ger area development in Ulaanbaatar. The World Bank Report, Washington DC.
[21] Gan-Yadam, A., Tanaka, E., Sugisawa, Y., Watanabe, T., Tong, L., Shinohara, R., Hirano, M., Tomisaki, E., Motita,
K., Onda, Y., Kawashima, Y., Mochizuki, Y., Nanba, M. and Anme, T. (2011) Gender differences in health seeking behaviour and empowerment needs. Japanese Journal of Human Sciences of Health-Social Services, 18, 52-58. [22] WHO (2011) WHO Report, World Health Statistics.
http://www.who.int/healthinfo/statistics/mortality_life_ta bles/en/
[23] Asian Development Bank (2008) Mongolia: Health and social protection.
http://www.oecd.org/dataoecd/33/32/42227662.pdf [24] Ministry of Health Mongolia (Third Health Sector Devel-
opment Project) (2009) Legal Analysis for Status of Family Group Practice.
http://www.hsdp.moh.mn/eng/Downloads/File/huvi/Repo rt%20of%20legal%20analysis%20on%20status%20of%2 0FGP_eng.pdf
[25] Kunst, A.E., Bos, V., Lahelma, E., Barley, M., Lissau, I., Regidor, E., Mielck, A., Cardano, M., Dalstra, J.A.A., Guerts, J.J.M., Helmert, U., Lennartsson, C., Ramm, J., Spadea, T., Stronegger, W.J. and Mackenbach, J.P. (2005) Trends in socio-economic inequalities in self assessed health in ten European countries. International Journal of Epidemiology, 34, 295-305. doi10.1093/ije/dyh342
[26] Zimmer, Z., Natividad, J., Lin, H. and Chayovan, N. (2000) A cross-national examination of the determinants of self- assessed health. Journal of Health and Social Behavior,
41, 465-481. doi10.2307/2676298
[27] National Statistic Office of Mongolia (2010) Population and Housing Census of Mongolia 2010.
http://www.toollogo2010.mn/index.php?language=en [28] Lanjouw, P. and Ravallion, M. (1995) Poverty and house-
hold size. Economic Journal, 105, 1415-1434.
doi10.2307/2235108
[29] Kaleta, D., Makowiec-Dabrowska, T. and Jecier, A. (2008) Employment status and self rated health. International
Journal of Occupational Medicine and Environment Health, 21, 227-236. doi10.2478/v10001-008-0023-y
[30] Anqing, S. (2011) Rural out-migration and family life in cities in Mongolia. East Asian and Pacific Region/CMU. The World Bank, Washington DC.
http://www-wds.worldbank.org/external/default/WDSCo ntenServer/WDSP/IB/2011/11/02/000333037_201111020 05453/%20Rendered/PDF/651590WP0P12230on0v20fin
al00PUBLIC0.%20pdf
[31] Lee, H.Y., Jang, S.-N., Lee, S., Cho, S.-I. and Park, E.-O. (2008) The relationship between social participation and self-rated health by sex and age: A cross-sectional survey.
International Journal of Nursing Studies, 45, 1042-1054.