Munich Personal RePEc Archive
Design and Implementation of a
Database for the Estimation of
Environmental Indicators in an Input
-Output Framework with the Use of
NAMEA Tables
Belegri-Roboli, Athena and Markaki, Maria and Michaelides,
Panayotis G. and Milios, John G. and Papakyriakopoulos,
Thymios and Tsolas, Ioannis
National Technical University of Athens
2006
Online at
https://mpra.ub.uni-muenchen.de/74458/
DESIGN AND IMPLEMENTATION OF A
DATABASE FOR THE ESTIMATION OF
ENVIRONMENTAL INDICATORS IN AN
INPUT – OUTPUT FRAMEWORK WITH
THE USE OF NAMEA TABLES
A. Belegri-Roboli, M. Markaki, P. Michaelides, J. Milios, T.
Papakyriakopoulos & I. Tsolas
Laboratory of Applied Economics, Department of Humanities, Social
Sciences and Law, Faculty of Applied Mathematics and Physical
Sciences, National Technical University of Athens
Abstract
The aim of the present paper is to design and implement a database for the estimation of environmental indicators by sector of economic activity at the macroeconomic level by means of input – output analysis with the use of NAMEA environmental tables. The database is programmed in VBA with the use of SQL queries and is implemented in a Microsoft Access environment through a friendly interface for inserting the data requested by the model (number of sectors, number of pollutants, etc). The computational results of the dataset of the relevant pollution coefficients (direct, indirect and total) by sector of economic activity are inserted in the database for further elaboration. Through the creation of the data base we can pinpoint the sectors and the pollutants that cause the largest environmental load and compare the results with the corresponding databases of other countries.
1
Introduction
The increasing interest in regulating and controlling air pollution on a European and international level reveals the need for developing the means for the qualitative and quantitative estimation of the various air pollutants. An all increasing volume of available data makes their collection and categorization through a practical to access, update and modify tool, imperative.
In this paper one of the most popular methods towards that end, the environmental input-output analysis with the use of NAMEA tables, is being combined with an electronic database management system to calculate the air pollutant production intensities by industry (direct, indirect and total) for the whole economy as well as for each category of final demand. The database system approach, as realized here, enables the user to define the number of sectors and pollutants for the investigated period, providing a convenient and adjustable tool for the presentation and interpretation of the model output.
Moreover, we calculate the emissions produced in the whole economy after the increase of a unitary expansion of the final demand for a given industry together with the total emissions of pollutant in the whole economy owing to one unit increase of a given industry production. Also, an application of the model provides the estimation of various environmental indicators that address global environmental problems.
The content of this paper is organized as follows: Section 2 describes briefly the methodological framework, section 3 illustrates the database outlay and design, section 4 incorporates a usage example of the database with input - output reports and section 5 concludes the paper.
2
Methodology
Input-output analysis is used to calculate emissions multipliers for different industries and various pollutants [1, 2, 3, 4, 5, 6]. The analytical model is as follows:
Z: matrix of intermediate deliveries
x: the vector of the total resources of the sector and
1
(
( ))
A
=
Z diag x
⋅
−(1)
The balance equation is:
x
=
Ax
+
y
(2)
where:
A: the matrix of technical coefficients y: the vector of final use of the products
1
(
)
x
=
I
−
A
−y
(3)
where:
(I-A)-1: the Leontief inverse matrix
The direct coefficients (akj) of the pollutant air intensity as emissions
expenditures per gross output for each industry (j) are defined as:
a
kj=
E
kj/
x
j, =1...n
j
(4)
where:
E: is the matrix of emissions k: type of emission
The total environmental dependencies are calculated as follows:
∂
1a (
)
kj kj
I
A
ε
−=
−
(5)
where:
ε: the matrix of the total induced emission including the indirect effects.
The row sum of ε, eqn. (5), is the total emission intensity including direct and indirect emissions for the jth industry. The column sum of ε, eqn. (5),
provides the total emissions of pollutant in the whole economy due to a unit increase of a given industry production. The direct and indirect emission intensity per unit of final demand categories is computed by:
∂
dkj
F
ε
=
ε
(6)
where:
F: the vector containing the final demand for each category
εd: the matrix coefficientsof extent of each emission factor intensity on each of
the final demand category.
The final demand categories are the private and government consumption (C), the investments (I) and the exports (E).
Based on the aforementioned analysis the NAMEA tables contains the following environmental indicators that address environmental problems ([8,9]):
Greenhouse effect:
2 2 4
CO + N O 309,315 + CH
⋅
⋅
20,996
(7)
Acidification theme:
x 2 3
Tropospheric ozone precursor theme:
x 4
NO 1,22 + NMVOC + CO 0,11 + CH
⋅
⋅
⋅
0,014
(9)
3
Database outlay and design
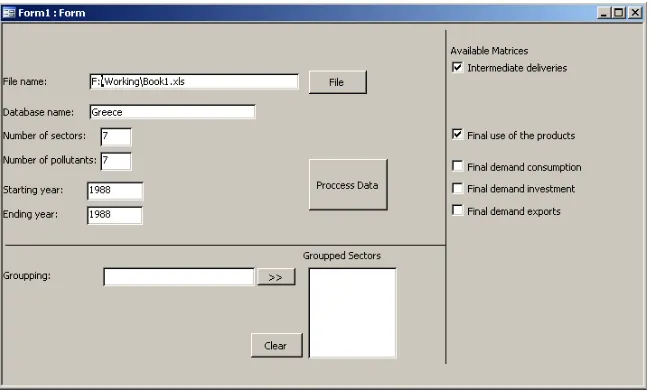
Based on the aforementioned methodology, the necessary input matrices/vectors for the database are:
• Intermediate deliveries, Ζ
• Gross outputs, Χ
• Final use, Υ
• Emissions, Ε
• Final demand consumption, Fc • Final demand investment, Fi • Final demand exports, Fe
and the following matrices are derived for each year in the examined time period:
• Leontief inverse matrix, Q=(I-A)-1 • Direct coefficients, a=E/X
• Total induced emissions, ε=â(I-A)-1
• Total emission intensity including direct and indirect emissions for a given industry
• Total emissions of pollutants in the whole economy due to a unit increase of a given industry production.
• Direct and indirect emission intensity per unit of final demand,
εcd=
^
ε
Fc , εid=^
ε
Fi , εed=^
ε
Fe• Environmental theme indicators: greenhouse effect, acidification theme, tropospheric ozone precursors theme
The database provides the possibility of inserting A directly, thus eliminating the need for Z. Apart from that insertion of Fc, Fi, Fe is optional.
The whole database system was designed according to the following specifications:
1. Data input and output in a straightforward and user friendly manner 2. Independent grouping of the sectors of economy according to user
demand
3. The number of sectors of the economy, pollutants or time period concerned, is also user defined without any constraints
4. Presentation of results in a tabular form
6. Result retrieval for each economy sector and each pollutant in various time periods
using a proxy of the zero normal form. MS Access RDBMS (Relationship Data
Base Management System) was employed taking under consideration the ease of use and the large number of existing installations worldwide. Custom subroutines, functions or algorithms were written in MS VBA language ([12, 13, 14]). Input matrices are in MS Excel format which is usually employed in public available economical data. The use of SQL queries ([15]) enables the user to focus on specific sectors of economy and/or pollutants and/or periods, thus providing tailor made reports.
4
Usage Example
An example based on data for Greece for the year 1988 for 7 sectors of the economy and 7 pollutants (Mylonas et al [1]) was constructed in order to briefly demonstrate the capabilities of the database.
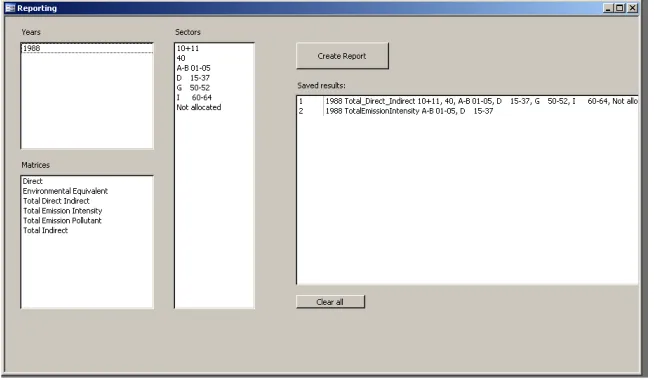
Figure 1 presents all user input parameters, where figure 2 displays the options the user has in order to generate various reports. The user can select the years of interest, the calculated matrices and individual sectors for the presentation of results.
The two following sample reports both display direct coefficients for the year 1988, the first for all sectors of the economy (figure 3), whereas the latter (figure 4) only for two sectors selected by the user.
[image:6.595.135.461.430.626.2]
Figure 2. Reporting form of the database.
Figure 4. Direct emissions coefficient for the year 1988 for selected sectors of economy. User created report.
5
Conclusions
In the present paper we applied the input – output analysis to a collection of data in order to provide several important measures of economical and environmental concerns. Creating a database allows for the systematic and consistent entry of data and their consequent analysis. The researcher, therefore, has a practical and valuable tool in hand to determine the pollutants that pose significant environmental stress, understand interactions between the economy and the environment and easily identify the interrelationships across selected sectors through convenient and adjustable reporting of the results.
The implementation of the above database allows to estimate – for a given time period - the air pollutant production intensities (direct, indirect and total) by sector of economic activity for the total economy and for each category of final demand. Also, we are able to calculate emission multipliers that account for direct and total emissions of the pollutants per unit of demand in each economic sector and for the final demand categories. Finally, we are capable of computing several environmental themes and store all of the above matrices in the database for further examination and evaluation.
The new objective is to develop a practical tool for environmental and economic research, with the ability to encompass cross countries analysis. Such a project cannot be undertaken unless the knowledge management infrastructure, like the DBMS described above, is not in place and clearly defined.
References
[1] Mylonas, N. Economakou, M. Frankopoulos, N. Krasadakis, A. Molfetas, K. Stromplos, N. & P.Vlachos, Natural Resource and Environmental Input-Output Tables for Greece, 1988-98, Eurostat and Institute of Computer and Communications Systems(ICCS), National Technical University of Athens, 2000.
[2] Wier, M., Sources of Changes in Emissions from Energy, Economic Systems Research, 10, pp.99-112, 1998.
[3] Ostblom, G., The environmental outcome of emissions-intensive economic growth: a critical look at official growth projections of Sweden up to year 2000, Economic System Research, 10, pp. 19-29,1998.
[5] Cadarso, A. & Fernandez-Bolanos A.F., Patterns of growth and consumption and their influence on the environmental in Spain, Fourteenth International Conference on Input- Output Techniques, 2002.
[6] Braibant, M., Environmental Accounts in France: NAMEA pilot study for France, Fourteenth International Conference on Input- Output Techniques, 2002.
[7] De Haan, M. & Kee, P. , Accounting for Sustainable Development: The Namea-Based Approach, Statistics Netherlands, 2004.
[8] OECD, Indicators to measure decoupling of environmental pressure from economic growth, OECD SG/SD(2002)1/FINAL, 2002.
[9] United Nations, European Commission, International Monetary Fund, Organisation for Economic Co-operation and Development, World Bank: Integrated Environmental and Economic Accounting, 2003.
[10]Belegri-Roboli, A., Markaki, M. & Michaelides, P., Environmental Emissions and the Role of Technological Change by Sector of Economic Activity in Greece: An Input-Output Analysis (1988-1998), IASME Transactions, Issue 3, Vol 2, May, pp. 371-375, 2005.
[11]Belegri-Roboli, A. and. Tsolas, I., Estimation of Intensity Coefficients of Total Emission in Greece (1988-96): An Environmental Input-Output Analysis, Proceedings of the 9th International Conference on Environmental
Science and Technology, Rhodes Island, Greece, September 1-3, 2005.
[12]Roman, S., Access Database Design & Programming, Second Edition, O’Reily, Sebastopol, 1999.
[13]
Andersen, V., How to Do Everything with Microsoft Office Access 2003,McGraw-Hill/Osborne, 2003.
[14]Viescas, J., Microsoft Office Access 2003 Inside Out, Microsoft Press, Redmond, 2004.