SEGMENTATION OF MULTI-TEMPORAL IMAGES USING GAUSSIAN
MIXTURE MODEL (GMM)
N. Anusha, P. Radhika Priyanka and P. Sai Harini
Department of Computer Science and Engineering, Sathyabama Institute of Science and Technology, Chennai, India E-Mail: [email protected]
ABSTRACT
This paper proposes a new segmentation technique called GMM. In order to identify the damaged buildings LANDSAT-8 multi-temporal images are taken i.e., before and after earthquake. Extraction of features is an important technique which maximises the class similarities and minimises the class dissimilarities. A new technique is proposed for identifying the changes in images by processing grey scale images and implementing fast discrete curvelet transform (FDCT). The main motive of implementing FDCT is to approximate properties and due the high directional sensitivity of this transform. For extracting features from the image, segmentation plays a key role. The accuracy results are compared with Watershed, Fuzzy, Ostu segmentation techniques. The results show that the proposed technique gives better accuracy compared to the existing techniques.
Keywords: segmentation, GMM, watershed, fuzzy, ostu, FDCT.
INTRODUCTION
Earthquake is one of the frequent natural disasters which affects the human life as well the properties like roads, buildings. There would be major impact on the building, so there is a necessity to identify the damaged buildings and portion of damage in that building which can be done by analysing the optical images taken before and after the earthquake. FDCT is an adaptive transformation technique which inherits the properties of wavelets and discrete cosine transform (DCT) which address the problem of moving object segmentation and change detection in compressed features in domain of DCT. Segmentation is a technique of dividing an image into parts or set of regions as per some homogeneity criteria. Segmentation is a process of identifying the boundaries, shape and presence of objects which helps in image analysis and efficient visualization. It is a plays a key role in indenisation of natural disasters like earthquake. There are many segmentation techniques and need to select a suitable one which can give better results for the damage detection.
[1] Proposed a methodology to characterize urban patterns with very high-resolution images using texture analysis based on local variance, co-occurrence matrices, and wavelets. But this methodology is very sensitive to the environmental changes. [2] proposed a methodology for the building damage detection using the results of pixel and object based classification for the geometric shape identification followed by implementing an adaptive network-based fuzzy inference system (ANFIS) model. It helps in finding the amount of damage caused by the earth quake .But this algorithm resulted in poor segmentations outcomes which affects the amount of change.
[3] Proposed an automated method that can robustly identify the changes in buildings using a local self-Descriptor. The changes are detected by footprints which avoid false imagination of presence of buildings by identifying small, big building structures and boundary information. Though this methodology is comparatively
good it cannot be implemented on the VHR images and false alarm in detecting shadows.
[4] proposed a system which is implemented on the multi temporal high-resolution remote sensed images using the co-segmentation-based method to identify the changes in buildings compensating the drawbacks of object based change detection. But this co-segmentation failed in exploiting the geometric and numeric changes.
[5] proposed a semi-automated method for remotely sensing the amount of damage in buildings caused by disaster using geographical information systems (GIS) by developing a method called detected part contour (DPC). For capturing the valuable texture information from the vector based map .But this method is sensitive to information's like objects placed on roof of buildings.
THE STUDY AREA AND USED DATA SET
Figure-1. Location of the study area.
The pre and post building images of earth quake which took place in regions of Nepal whose effect is northern and central parts of India including capital city New Delhi on 25th March 2015,11.41 am IST and were sensed by the LANDSAT-8. The study is located at a
depth of 10km with its Epicentral region Ghyacock located in Nepal about 80km NW of Kathmandu and given in the above Figure-1. The latitude and longitude are 28.230°N 84.731°E respectively. The table below gives the specifications of the used data.
Table-1. Specifications of the used data.
Sensor type Image type Resolution Pre earthquake
image sensed date
Post earthquake image sensed date
PROPOSED METHODLOGY
Figure-2. Block diagram for GMM segmentation.
The block diagram is shown in the Figure-2. Initially the input images are pre-processed to obtain efficient results for detecting damaged portions of buildings images. The pre-processing involves steps like removing noise, converting the LANDSAT optical images to scale and resizing the images into same resolution. Removing noise plays important role in pre-processing. If there is small amount of noise it is highly difficult to detect and remove noise from that image, so in order to remove even minute amount of noise we need to increase the noise so that noise levels crosses the threshold limits for the filters used. For this purpose a Gaussian noise is added. The median filter is chosen to remove the maximum amount of noise from the resultant noise image.
The pre-processed image is subjected to curvelet transform which produces the two low level and six high level decomposed images. The block diagram for the curvelet transform is shown in Figure-3. The L1 and L2 in Figure are the outputs that are obtained by implementing low level curvelet Transform. H1 a, H1 b are outputs formed by the high level decomposition level 1. The H2 a, H2 b, H2 c, H2 d are the high level decomposition level2 of curvelet transform. The eight outputs of low level and high level curvelet decomposition are pair wise fused and then subjected to GMM segmentation which is colour segmentation model as well as a probabilistic model that assumes all the data points are generated from a mixture of a finite number of Gaussian distributions with unknown parameters.
[image:3.595.101.492.471.691.2]
RESULTS AND DISSCUSSIONS
(a) (b)
Figure-4(a) & 4(b). Image before the earth quake and image after the earthquake.
Pre -and post earthquake LANDSAT-8 images are taken for detecting the damages in buildings as shown in Figures 1(a) and 1(b).
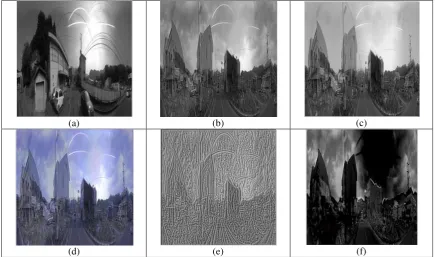
GMM segmentation
(a) (b) (c)
(d) (e) (f)
(g) (h) (i)
Figure-5. (a),(b),(c),(d),(e),(f),(g)&(h)(i) Before earth quake grey scale image, After the earthquake grey
The outputs produced by implementing the GMM Segmentation are shown in the Figure-4. Initially the input images 3(a) and 3(b) are converted into grey scale which produces the outputs 4(a) and 4(b) respectively. The final pre-processed image is obtained by noising and de-noising of the images 4(a), 4(b) which is done by adding Gaussian noise and removing by median filter for the better accuracy results which is shown in. Figure-4(c), 4(d). Curvelet transform is applied which produces the 2 low level and 6 high level decomposed images. The transformed images 4(e) undergoes fusion which results in
fused Collage image 4(g). In which, the first part of the collage is formed by the fusion of 2 low level curvelet decomposed images l1 and l2, second is formed by the fusion of H1a and H1b, third part is formed by the fusion of H2 a and H2 band forth part is formed by fusion of H2 C and H2 d. Similarly The Figure-4(h) is produced. Finally GMM segmentation is applied to resultant 4(f) and 4(g) that produces the segmentation output as 4(I).
Watershed segmentation
(a) (b) (c)
[image:5.595.80.516.244.501.2](d) (e) (f)
Figure-6. Results of watershed segmentation.
Figure 5(a), (b) Grey scale images, Figure5(c) & Figure-3(d) Applying wavelet transform, Figure-5(e) fused image, Figure-3(f) Watershed segmentation output. The Figure-5(a), (c) are results for the image taken before the earthquake and Figure-5(b), 5(d) are the outputs produced for image taken after the earthquake
Fuzzy segmentation
(a) (b) (c)
(d) (e) (f)
(g) (h) (i)
(j)
Figure-7. Outputs of fuzzy segmentation
(a), 6(b) Grey scale image; 6(c), 6(e) NSCT level 1; 6(d) & 6(f) NSCT level 2;, 6(d), 6(h)NSCT level 3; 6(i) Fused image;6(j)Fuzzy segmentation output
OSTU segmentation
(a) (b) (c)
(d) (e) (f)
Figure-8. (a), (b) Grey scale image, 7(c), (d) using SWT transform, 7(e) Fused image 7(g) Otsu segmentation. The Figure
7(a), 7(c) are results for image taken before earthquake and 7(b), 7(d) are results for image after the earthquake.
Figure-7 shows the results of Ostu segmentation. The inputs 3(a), 3(b) are converted to grey scale7 (a), 7(b) followed by implementing SWT transform 7(c), 7(d). Later a fused imaged7 (e) is generated by the fusion of transformed images7(c), 7(d) which is subjected to Ostu segmentation.
COMPARISION OF ACCURACY VALUES OF DIFFERENT SEGMENTATION TECHNIQUES
The accuracy values of all the segmentation techniques are calculated based on the four parameters of low frequency and high frequency measures and a graph is plotted as shown in Figure-9.
Figure-9. Comparison of accuracy values of various
segmentation techniques.
Figure-10. Performance graph of GMM segmentation.
CONCLUSIONS
Segmentation of multi-temporal images is done using curvelet transformation & Gaussian Mixture Model (GMM). A comparison study has been made between the accuracy values of segmentation techniques. The results produced from the GMM segmentation are far better when compared to the other segmentation techniques like Ostu, watershed and fuzzy segmentation in the aspect of accuracy.
REFERENCES
[1] Antoine Lefebvre and Thomas Corpetti. 2017. Monitoring the Morphological Transformation of Beijing Old City Using Remote Sensing Texture Analysis. IEEE Journal of Selected Topics in Applied Earth Observations and Remote Sensing. 10(2): 539.
[2] Milad Janalipour and Ali Mohammadzadeh. 2016. Building Damage Detection Using Object-Based Image Analysis and ANFIS from High-Resolution Image. IEEE Journal of Selected Topics in Applied Earth Observations and Remote Sensing. 9(8).
[3] Fatih Kahraman, Mumin Imamoglu and Hasan F. Ates. 2016. Disaster Damage Assessment of Buildings Using Adaptive Self-Similarity Descriptor. IEEE Geoscience and Remote Sensing Letters. 13(8).
[4] Pengfeng Xiao, Member, IEEE, Min Yuan, Xueliang Zhang, Xuezhi Feng and Yanwen Guo. 2017. Co segmentation for Object-Based Building Change Detection from High-Resolution Remotely Sensed Images. IEEE Transactions on Geoscience and Remote Sensing. 55(3).
[5] Natalia Sofina and Manfred Ehlers. 2016. Building Change Detection Using High Resolution Remotely Sensed Data and GIS. IEEE Journal of Selected Topics in Applied Earth Observations and Remote Sensing. 9(8).