714
EVALUATION OF E-KELURAHAN INFORMATION
SYSTEMS AT SUBDISTRICT OF PANCORAN MAS DEPOK
USING TECHNOLOGY ACCEPTANCE MODEL
YENNY FRANSISCA LAMPOUW1, AHMAD NURUL FAJAR+
1,2 Information System Management Department, BINUS Graduate Program- Master of Information System
Management, Bina Nusantara University, Jakarta, Indonesia 11480 E-mail: 1[email protected], 2[email protected]
ABSTRACT
In an effort to improve the quality of public services, the Government Issues Minister Regulation No. 24 Year 2006 on Guidelines for the Implementation of Integrated Services One Stop. As well as through the Minister of Home Affairs No. 4 of 2010 launched a program called the Integrated Administrative Service Sub-District or abbreviated PATEN. Utilization Implementation of System E - Kelurahan on integrated sub-district administrative services are expected to boost the performance to support the implementation of good governance, it is necessary for adaptation by the user and the environment in order to obtain optimal results. Methods TAM (Technology Acceptance Model) is used to determine how much influence the perceived ease of use and perceived usefulness in the implementation process System E-Kelurahan Pancoran Mas Depok
sub-district.
Keywords: Integrated services, Good governance, Technology acceptance models
1. INTRODUCTION
Based on Law No. 23 Year 2014 on Regional Government Article 344 paragraph (1) explains that, Local Government shall ensure the implementation of the public service by the
Government Affairs Regionalauthority.Andin
Article 226 paragraph (2) which reads the delegation of authority regent / mayor referred to in paragraph (1) shall be based mapping of public services in accordance with the characteristics of the District and / or the needs of society in kapubaten. Sub district to the door leading into the public service, because the District is a part of the decentralization of public services (public service decentralization). subdistricts serve as the Community Service Center (Pusyanmas) for the types of services that are simple, fast, and inexpensive to improve the quality of service to the community.
In an effort to improve the quality of public services, the Government issued Minister Regulation No. 24 Year 2006 on Guidelines for the Implementation of Integrated Services One Stop. In the Regulation governing the implementation of the one stop service in order to improve quality and
provide easier access to the public. As well as through the Minister of Home Affairs No. 4 of 2010 launched a program called the Integrated Administrative Service Sub-District or abbreviated PATENT.
715
TAM stated that behavioral intension to use is
determined by two beliefs: first, perceived usefulness theis defined as the extent to which a person believe that the use of the system will improve its performance.Second,
perceived ease of use is defined as the extent to which a
person believe that the use of the system is easy. TAM also states that the impact of such external variables (characteristics of the system, process development and training) to the intension to use is mediated by
perceived of usefulness and perceived ease ofuse.
TAM concept also states that perceived usefulness is influenced by perceived ease ofused.Venkatesh and Davis (2000) states that TAM
is a concept that is considered the most good in explaining the behavior of the user of the new
information technology system. TAM is a model that is considered the most precise in explaining how
the user receives a system.
Research with these conditions in accordance with the statement Compeau and Higgins (1995) which states that the critical stages in the implementation of an information technology
system is a condition in which the presence of the system is accepted or rejected by the prospective
user.Inhibition of the process of adaptation is due to
the tendency of different perceptions about the benefits and convenience of the new system to be operated.
From the explanation above, researchers will conduct an evaluation of the implementation process sie reception on-wards by using an approach TAM (Technology Acceptance Model), so that the use of System E-Kelurahan in data management services can improve the service process to be effective and efficient.
2. LITERATURE STUDY
To support this research, researchers have done a literature review on some of the following:
1. Kartika Eka Shinta, Diponegoro University, 2009, admissions process analysis system using the icons information technology acceptance model at the state bank employee Indonesia. In the city of Semarang, this research is a kind of explanatory research using survey method approach.
2. I Made Adi Letters, Udayana University, 2012, evaluation of management information systems in hospitals castle general raharja approach to technology acceptance models, research on user behavior on the acceptance of the technology in future studies may use a method tam to be developed further by combining other theories of the field sciences, social economics, psychology or other disciplines.
3. Setyarini indraningtyas, university national development "veteran" East Java, in 2014, the concept tam done on the study of literature and the process of understanding the concept of evaluation of the application, and then identify what instruments owned tam done on the specification process modeling tam, and the preparation and distribution of questionnaires, then to test the validity and reliability of the questionnaire on the validity and reliability of the process, when the list of questions in the questionnaire valid questionnaires then ready to be filled by all respondents were then the data will be analyzed performed on the data analysis process.
4. fran Sayekti & pulasna putarta, technological university in Yogyakarta, 2016, the application of technology
In the implementation of an information system required adaptation by the user and the environment in order to obtain optimal results. There are several obstacles:
1. do not understand the importance of the usefulness of the information system.
2. The work culture that still use manual system (conventional).
TAM method (Technology Acceptance Model) is used to find out how much influence perceived ease of use and perceived usefulness in the implementation process of System E-Kelurahan Kecamatan Pancoran Mas Depok.
TAM(Technology Acceptance Model)is
used to determine how much influence the perceived ease of use and perceivedusefulness in the
implementation process System E-kelurahan Pancoran Mas Depok subdistrict.
TAM bases itself on the Theory of
Reasoned Action (TRA) is expressed Ajzen and
716
acceptance models (tam) in the test model
of acceptance of the information system of local finance, quantitative methods, which describe the conditions under study using the figures and decision-making on the results of research based on statistics , in this study there are three variables which are divided into two types of variables. The
first is the independent variable.
independent variable in this study is the use of technology (perceived use fulness) and
ease of using technology (perceived ease ofuse).variables thatThe second is the
dependent variable or dependent variable. in this study the dependent variable is the variable acceptance of the technology in this regard SIPKD reception.
5. br berlin novia Tambunan, Atma Jaya Yogyakarta University, 2016, using the technology acceptance models (tam). The data collection techniques used in this study is a random sampling. population in this study were students of Atma Jaya Yogyakarta University, where samples are taken are a few students from each faculty who have not taken the final project
(thesis). Data collection used
questionnaires and immediately covered with a rating scale. Data analysis technique used is the technique sem (structural equation modeling). This study uses data sample of 259 respondents, who have passed the test of validity, reliability, normality, and test the model assumption sem.
6. Fatmasari 1), Ratna Dewi 2), Yessi Novaria firefly 3), upn "veteran" Yogyakarta, 2013, the evaluation of acceptance of the e-ID card using tam (technology acceptance model) (case study: the district office Ilir east i Palembang, this study 3 (three) variables that have been modified from the research model tam previous: usefulness (perceived usefulness) as independent variables first (x1), convenience (perceived ease of use) as independent variables the second (x2), and user acceptance ektp as a variable Related (y) where, according to the
theory tam significantly variable usefulness and variable ease of influence on user acceptance in the use of e-ID card.
7. Ni luh nyoman sherina devi1 i wayan suartana, universities udayana, 2014, the conclusion of the results of this study, the variable of computer self-efficacy and trust each positive and significant impact on both
the dependent variables (perceived
usefulness and perceived ease of use). differ ha lnya with variable personalization that has no effect on the second varabel, because respondents were within the scope of the work required to complete the complex and limited time.
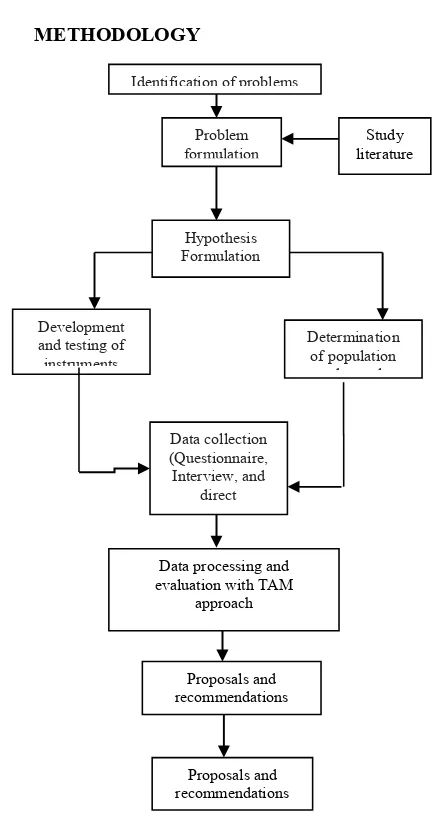
[image:3.612.332.549.291.704.2]3. METHODOLOGY
Figure 1: Methodology Framework Problem formulation
Hypothesis Formulation
Development and testing of instruments
Determination of population
d l
Proposals and recommendations Data processing and evaluation with TAM
approach
Data collection (Questionnaire, Interview, and
direct
Proposals and recommendations
Identification of problems
717 Using the method proposed research using quantitative methods to ensure data is collected in the form of numbers with the size scale and processed using SPSS.
3.2. Methods of Data Analysis
Data analysis was conducted in two stages, namely in the form of data quality test validity and reliability testing. Test the validity of using contructvalidity that includes an understanding of
the theoretical arguments underlying the
measurements obtained. The approach underlying theoretical arguments measurements obtained. The approach taken is to connect a construct studied by other construct formed from the framework of theoretical. Basic decisions validity test is to compare the results of calculation of SPSS column r Pearson correlation with table for 5% significance level and degreeof freedom (df) = number of samples minus 2 (df = n-2).
If r is a positive result, and the result r> r table, then the item or variable is valid. If the results are not positive r and r results <r table, then the item or variable is invalid.
Reliability testing with regard to consistency, accuracy and predictability of a measuring instrument. Reliabiltas coefficient was measured by using Cronbach's alpha for each variable. This reliability about measurement between 0 and 1.
3.3. HYPOTHESIS TESTING
Hypothesis testing will be conducted on all the hypotheses used in this study by using simple regression analysis.
The general form of linear equations is a simple relationship between two variables X as the independent variable and variable Y as variable dependent is:
Y = a + bx
Description:
Y = dependent variable
a = intercept (point of intersection of the curve on the Y axis)
b = slope (slope ) linear curve x = the independent variable
4. RESULT AND DISCUSSION
4.1. Data Analysis
In this study, a questionnaire distributed 57 respondents who use the E-village information system. The amount has been adjusted to slovin method, in which the amount in the calculation of the total population of 70 employees in sub Pancoran Mas Depok city.
The question posed in this questionnaire question as there are two types, namely:
1. Demographics or profile of respondents,
consisting of questions about respondents' age, gender, job position, and long working respondents in Depok city government.
2. Evaluation of Information Systems admission E-wards by using TAM (Technology Acceptance Model), which consists of 23 questions. Of the 23 questions presented each variable used in the study TAM.
Variable perceived usefulness is a picture of perceptions reception system based on the degree of usefulness given by the system. Each indicator will gives overview of the perceived increase work performance and Traffic responder system in managing a wide range of work to be performed respondents.
Variable perceived ease of use gives an idea of how big obstacle in the use of systems that is perceived by respondents. Each indicator contains elements that can be used to assess what are the factors inhibiting the harness system.
Variable attitude toward using the system gives an overview about the comfort level of the respondents use the system to complete the work. This variable will affect the value of the variable against behavioral intention. If the ATU indicates the level of convenience of use, the BI will describe the shape from respondent intention in using the system in a variety of jobs.
Variable actual system use provides a description of reality to be faced by respondents in using the system. Whether the respondent was prepared to use the full system in resolving a variety of work processes.
This last variable will gives an overview on the leadership of the respondents to the implementation of the system of academic information.
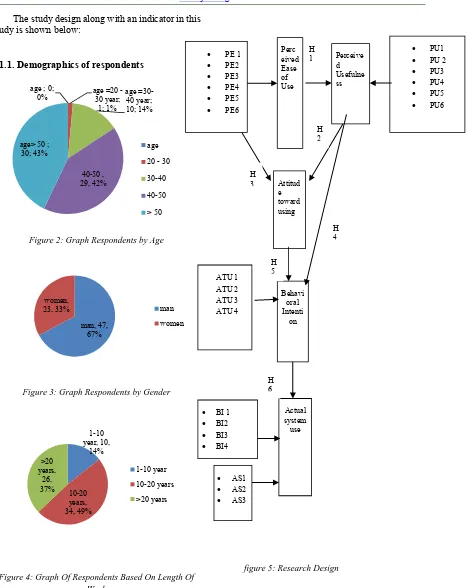
718 The study design along with an indicator in this study is shown below:
4.1.1. Demographics of respondents
Figure 2: Graph Respondents by Age
Figure 3: Graph Respondents by Gender
Figure 4: Graph Of Respondents Based On Length Of Work
age ; 0;
0% age =20 -30 year; 1; 1%
age =30-40 year; 10; 14%
40-50 , 29, 42% age> 50 ;
30; 43% age
20 - 30 30-40 40-50 > 50
man, 47, 67% women,
23, 33% man
women
1-10 year, 10,
14%
10-20 years, 34, 49% >20
years, 26, 37%
1-10 year 10-20 years >20 years
PU1
PU 2
PU3
PU4
PU5
PU6
Perceive d Usefulne ss Perc
eived Ease of Use
PE 1
PE2
PE3
PE4
PE5
PE6
Attitud e toward using
ATU 1 ATU 2 ATU 3 ATU 4
Behavi oral Intenti on
Actual system use
BI 1
BI2
BI3
BI4
AS1
AS2
AS3
H 1
H 2
H 3
H 4
H 5
[image:5.612.98.565.81.669.2]H 6
719 4.1.2. Descriptive Analysis
[image:6.612.314.523.164.303.2]4.1.2.1. Descriptive analysis VariablePerceived
Table 1:Usefulness.Distribution of Respondents Answers on Perceived Usefulness Variables
Responde nts' Response
Strongly
agree Agree Doubtful Disagree Strongly
disagre e Item
question F % F % F % F % F %
PU 1 2
0 33,9 30 66,1 8 13,6 1 1,7 0 0
PU 2 2
2 37,3 32 54,2 4 6,8 1 1,7 0 0
PU 3 3
1 50,8 24 39,3 1 1,7 2 3,4 1 1,7
PU 4 2
3 39 25 42,4 9 15,3 1 1,7 1 1,7
PU 5 2
1 35,6 27 45,8 11 18,6 0 0 0 0
PU 6 1
3 22 34 55,7 12 19,7 0 0 0 0
4. 1.2.2. Descriptive analysis of variables Perceived Ease of Use
Table 2 : Distribusi Answer Respondents on Variables Perceived Ease of Use
Respon dents' Respon se Strongl y agree
agree Doubtf ull disagr ee Strong ly disagr ee Item questio n
F % F % F % F % F %
PE 1 1
5 25 ,4 3 0 50 ,8 1 2 20 ,3
1 1, 7
1 1, 7
PE 2 2
0 33,9 30 50,8 9 15,3 0 0 0 0
PE 3 1
6 27 ,1 3 0 50 ,8 1 2 20 ,3
1 1, 7
0 0
PE 4 7 11
,9 3 8 64 ,4 1 2 20 ,3
1 1, 7
1 1, 7
PE 5 8 13
,6 25 42,4 22 37,3 4 6,8 0 0
PE 6 1
5 25 ,4 3 5 59 ,3
9 15 ,3
0 0 0 0
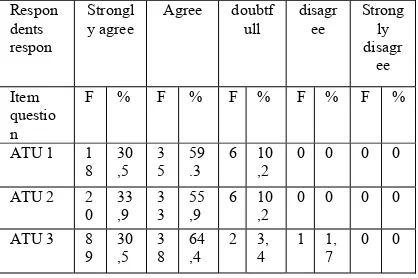
4.1.2.3. Descriptive analysis Variable Attitude Toward Using
Table 3: Distribution of Respondents Answers in Attitude Toward Using variable SIEkelurahan
Respon dents respon
Strongl y agree
Agree doubtf ull disagr ee Strong ly disagr ee Item questio n
F % F % F % F % F %
ATU 1 1
8 30 ,5 3 5 59 .3
6 10 ,2
0 0 0 0
ATU 2 2
0 33 ,9 3 3 55 ,9
6 10 ,2
0 0 0 0
ATU 3 8
9 30 ,5 3 8 64 ,4
2 3, 4
1 1, 7
0 0
4.1.2.4. Descriptive AnalysisVariables Behavioral
Table 4:Intention.Distribution of Respondents Answers on Behavioral Intention Variables
Respon dents respon
Strongl y agree
Agree doubtfu ll disagr ee Strong ly disagr ee Item questio n
F % F % F % F % F %
BI 1 2
1 35 ,6 3 0 50 ,8
7 11
,9 1 1,
7 0 0
BI 2 9 14
,8 2 7 45 ,8 2 0 33 ,9
2 3, 4
0 0
BI 3 6 10
,2 2 8 47 ,5 2 2 37 ,3
2 3, 4
1 1, 7
BI 4 1
7 28 ,8 3 6 61 .0
5 8, 5
0 0 1 1,
720 4.1.2.5. Descriptive analysis Variable Actual
[image:7.612.127.249.158.406.2]System Use
Table 5: Distribution of respondents in the variable Actual System Use
4.2.Test of validity and Reliability
4.2.1. validity
Validity test used in this study is that it includes an understanding contructvalidity theoretical arguments underlying the measurements obtained. The approach taken is a construct that diteleiti connect with other construct that is formed from a theoretical framework.
Basic decisions validity test round by comparing the calculation results SPSS column r Pearson Correlation with table for 5% significance level and the degree of freedom (df) = 1 sample minus 2 DF = 59 - 2.
If r is a positive result, and r results > r table or variable is valid. If the results are not positive r and r results <r table, then the item or variable is invalid.
In this study, where the number of samples = 59 then df = 57 with the results of significance of 5%, then on to the numbers r table = 0.2564.
4.2.2. Reliability
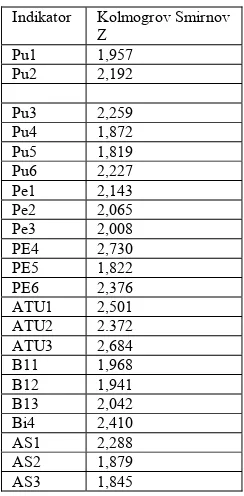
[image:7.612.313.524.250.378.2]Test reliability with regard to consistency, and predictability akrasi a measuring instrument. Reliability coefficient was measured by using Cronbach's alpha for each variable. Hilling This reliability ranged from 0 to 1, results of reliability test on this study can be seen in the following:
Table 6 : Validity test results Value kolmogrov Smirnov Z
4.3. Hypothesis Testing
Hypothesis testing will be conducted on all the hypotheses used in this study to make use of a simple linear regression analysis.
Hypothesis 1. There is the influence of Perceived Ease of Use against Perceived Usefulness
In the first hypothesis of this study will be tested these variables influence perceived ease of use of the perceived usefulness in the study design.
Indikator Kolmogrov Smirnov Z
Pu1 1,957
Pu2 2,192
Pu3 2,259
Pu4 1,872
Pu5 1,819
Pu6 2,227
Pe1 2,143
Pe2 2,065
Pe3 2,008
PE4 2,730
PE5 1,822
PE6 2,376
ATU1 2,501
ATU2 2.372
ATU3 2,684
B11 1,968
B12 1,941
B13 2,042
Bi4 2,410
AS1 2,288
AS2 1,879
AS3 1,845
Respon dens respon
Strongl
y agree Agree doubtfull disagree Strongly disagr ee Item
questio ns
F % F % F % F % F %
AS 1 7 11
,9 3 1
52 ,5
1 7
28 ,8
4 6, 8
0 0
AS 2 1
1 18 ,6
1 7
28 ,8
2 4
40 ,7
7 11 ,9
0 0
AS 3 1
3
22 2
0 33 ,9
2 3
39 3 5, 1
721
Table. 7: SPSS Output Hypothesis 1
Coefficientsa
Model Unstandardized
Coefficients
Standardized Coefficients
t Sig.
B Std.
Error
Beta
1
(Constant) .734 .390 1.880 .065
Pe 5.247 .587 .764 8.935 .000
a. Dependent Variable: pu
From the SPSS output for the first hypothesis obtained linear equation as follows:
PU = 0.734 + 5.247 Perceived Ease of Use
[image:8.612.311.507.164.381.2]Hypothesis 2. There Influence of Perceived Usefulness against Attitude toward Using Information Systems E-Kelurahan in the sub district Pancoran Mas.
Table 8: SPSS output 2 hypothesis test
Coefficients a
Model Unstandardized
Coefficients
Standardized Coefficients
t Sig.
B Std.
Error
Beta
1 (Constant) .733 .120 6.087 .000
Pu .161 .028 .600 5.663 .000
a. Dependent Variable: atu
From the hypothesis 2 SPSS output obtained linear equation as follows:
ATU = 0733 + 0.161Perceived Usefulness
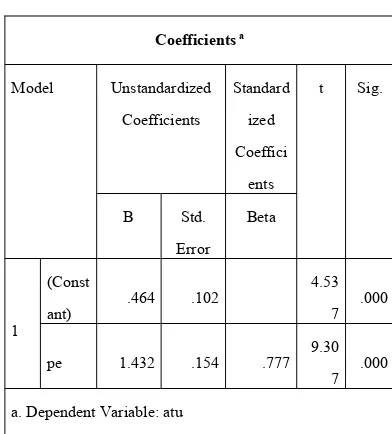
Hypothesis 3. There is influence perceived ease of use against Attitude toward using system information E-Kelurahan at sub district Pancoran Mas Depok city.
Table 9: Output 3 hypothesis test
Coefficients a
Model Unstandardized
Coefficients
Standard ized Coeffici
ents
t Sig.
B Std.
Error Beta
1 (Const
ant) .464 .102
4.53 7 .000
pe 1.432 .154 .777 9.30
7 .000 a. Dependent Variable: atu
[image:8.612.90.300.480.626.2]722
Hypothesis 4. There Perceived
[image:9.612.90.278.176.383.2]Usefulness effect on behavior intention to use the information system e-Kelurahan in the sub district Pancoran Mas Depok city.
Table 10. : Output 4 Hipotesis test
Coefficientsa
Model Unstandardized Coefficients
Standar dized Coeffici
ents
t Sig.
B Std.
Error Beta
1 (Cons
tant) .101 .118 .860 .393
pu .209 .028 .706 7.51
6 .000 a. Dependent Variable: bi
From SPSS output for hypothesis 4 linear equation as follows:
BI = 0101 +0209 Perceived Usefulness
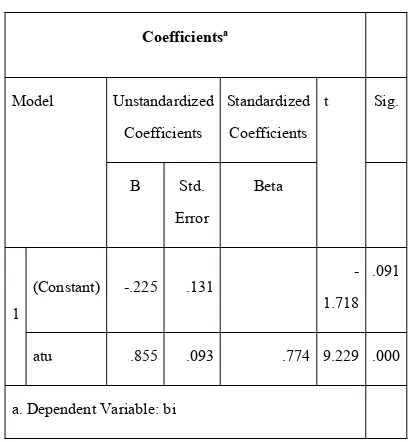
Hypothesis 5. There is Attitude toward influence behavior using the system against the intention to use the information system e-Kelurahan at the sub district Pancoran Mas Depok city.
Table 11: Output 5 Hipotesis test
From the SPSS output obtained for Hypothesis 5 linear equation as follows:
BI = -0.225 + 0855 Attitude toward Using System
Coefficientsa
Model Unstandardized
Coefficients
Standardized Coefficients
t Sig.
B Std.
Error
Beta
1
(Constant) -.225 .131
-1.718 .091
atu .855 .093 .774 9.229 .000
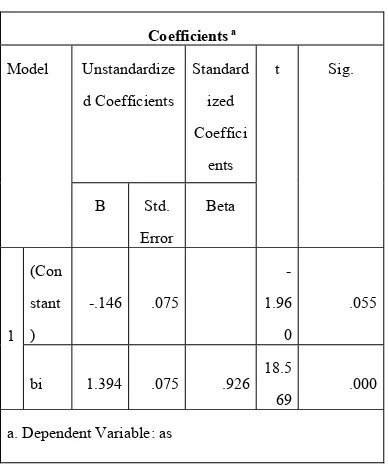
[image:9.612.318.523.180.401.2]723 Hypothesis 6. There Influence Behavior Intention to use the system to Actual System Use
Table 12: Hypothesis 6 SPSS output
Hypothesis 6 linear equation as follows: AS = -146 + 1,394 Behavior Intention
4.3. Evaluation of Hypothesis Test Results
Table 13: Table Summary Results Hypothesis test
The summary of hypothesis testing in this study is summarized in the following table.
From each test performed on each hypothesis can be found a decision that every hypothesis acceptable, because the value of f and t values were found to be greater when compared to the values in the table. Of each hypothesis will be associated with the different issues that affect the acceptance of academic information system at the District Pancoran Mas Depok. The summary of the research framework used in this study are described as follows.
4.4.Hypothesis Test Results Evaluation
[image:10.612.333.522.299.601.2]Summary of hypothesis testing in this study are summarized in following table :
Table 14.: The Average Answer Respondents
Table 14: The Average Answer Respondents
Coefficients a
Model Unstandardize d Coefficients
Standard ized Coeffici
ents
t Sig.
B Std.
Error Beta
1 (Con stant )
-.146 .075
-1.96 0
.055
bi 1.394 .075 .926 18.5
69 .000
a. Dependent Variable: as
H ypo thes is
F cout n
F ta ble
T co un t
T Tabe l
Linear Equations
de cisi on
H1 79.8 39
4.0 1
0,2 56 4
8.93 5
PU=0.734+5.2 47PE
dit eri ma H2 32.0
66
5.66 3
ATU=0.733+0 ,161PU
Dit eri ma H3 86.6
25
9,30 7
ATU=0.464+1 .432PE
Dit eri ma H4 56.4
93
7.51 6
BI=0.101+0.2 09PU
Dit eri ma H5 85.1
79
9.22 9
BI=‐ 0.225+0.855A TU
Dit eri ma
H6 344. 811
18.5 69
AS=‐1.960 + 18.569BI
Dit eri ma
Rangking Indicator pertanyaan Mean
1 pu3 4,38
2 pu2 4,27
3 atu3 4,23
4 atu2 4,23
5 atu1 4,20
6 pe2 4,18
7 pu1 4,17
8 pu5 4,16
9 pu4 4,15
10 bi3 4,15
11 pe6 4,10
12 pe3 4,03
13 pu6 4,01
14 pe1 3,96
15 pe4 3,83
16 as3 3,72
17 bi1 3,69
18 as1 3,69
19 pe5 3,62
20 bi2 3,61
724 Table average respondents used to find the top three factors and three factors that influence positively the lowest in the reception system are:
1. PU3: Using Information Systems E -Kelurahan
were able to ease my undertake and complete the task.
2. PU2: Using information Systems e-kelurahan can improve the performance of ASN.
3. Atu3: I enjoy using the system information E -Kelurahan.
Results of searches based on the average responses it can be concluded that the benefits of being the key to success in the acceptance of information systems E-Kelurahan town Depok. This is in line with expectations of the management of the District who feel the need to implement the E-Kelurahan information system to support the service process, performance and creating comfortable conditions. The third top indicator proves that the variable perceived usefulness, perceived ease of use and Actual system use, is key in the reception system.
Meanwhile, three factors lows based on the average respondent's answer is:
1. PE 5: It is easy for me to be an expert to use the information system E-wards
2. BI2: I make a schedule of when to use Information Systems E-Kelurahanfor the next day 3. AS2: I access the Information Systems E -Kelurahan nearly every day.
Of the three lowest variable indicated by three variables with different indicators.. factor of the three lowest variable indicated by three variables with different indicators. factors that indicate a low response associated with the intensity and negative responses to the use of information systems e-Kelurahan.
The conclusion that can be derived from the average respondent's answer is to recommend the development of a system that leads to the benefits that can be obtained by the institution from its use. As for things that also affect the acceptance of the system is easing of use system that self and also the experience that can be obtained by users because using system information e-Kelurahan.
.
4.5. Recommendations and Proposals
From the evaluation that has been implemented can be prepared recommendations and suggestions from several points of view. The recommendations given related to:
1. Information System Development of e-Kelurahan in the future.
2. The process of implementation and utilization of E -Kelurahan Information System.
Apart from the recommendations provided, there are some policies that can help in the acceptance of E-Kelurahan information system, namely:
1. The government can provide socialization regarding the utilization of computerized system in the service. In addition the government can also form a decree that provides policy on the utilization of the system.
2. For the Sub District, in particular the sub-district can provide an opportunity for ASNs to attend various workshops on the utilization of the system. After wards can be prepared a workshop provided by experts
3. ASN must start using computer to provide service or complete various work process by using computer aid. This can provide a great experience in utilizing computer as tools to complete the work, so the implementation of the system can be received well.
4.5.1. Development of information system e-Kelurahan for the Future
The initial recommendations that can be generated are based on three answers to the questionnaire with high scores, namely Perceived Use fullness 2, Perceived Use fullness 3, and actual system use. From these three indicators, it can be concluded that the development of the system must provide the usefulness value expected by the respondents. The higher the value the user gains will increase the user's usage intent and performance. In addition, the ease of obtaining information is an important point of utilization E-Kelurahan information system.
So it is very important in the development of systems to manage the various data required to support the information needs of users. In this study variable perceived ease of use is not fully show the positive value if compared with perceived usefulness. From the direct observation as for obstacles encountered as cause is:
725 3. Submitting the benefits of the use of a less clear system from the developer
4. Lack of computer adequate for use by the user. Some of these problems can be solved with the following inputs:
1. Provide training or workshop on the utilization of the system and computer in supporting the work process.
2. Extend the contract developer until the user can really stand alone in utilizing the system.
3. If will do the process of recruitment ASN preferred people who have ability and desire to finish work with computer or system.
From the development of existing systems can be recommended to the developer as follows:
1. In effective windows space usage, because there is still a lot of empty windows space.
2. There are still bugs on some components that exist in the system.
3. Adjustment of output system with reports required by the institution.
4. Lack of anticipation in data recovery and protection against existing data.
Thus the recommendations can be given through the process of evaluation and direct observation of e-village information system that is implemented in sub-district Pancoran Mas Depok city.
4.5.2. The implementation process and utilization of E - Kelurahan information system
In the implementation process found some obstacles during the initial implementation which was held in early March 2017, namely: 1. Lack of supervision of superiors to the attention of the user data socialization and the use of the use system.
2. Lack of user competence on computer usage. 3. Lack of computer facilities in the process of socialization and counseling.
These constraints can be represented from some respondents' answers on the questionnaire with indicator attitude toward using system 4, behavioral intention 2 and actual system use 2 into three responses with the lowest response. These three indicators have represented the users' intentions or perceptions of the use of the system. The use of the system is expected to become the backbone of the institutional business process. If the
users cannot understand the benefits and
do not have a consistent intention, then the utilization of the system will not give maximum results.
Recommendations for implementation and utilization of the system can be summarized based on existing constraints:
1. Improve the infrastructure that supports the use of the system.
2. Provide training on the use of computer and academic information system on the users.
3. Improving the supervision of high-level management at the institution and also provide input to the users about the benefits of implementing e-village information system.
Thus it is expected that the
implementation and utilization of urban e-urban information system can give maximum value. So this process can also improve the quality of services provided by the institution and improve the performance of the users who become teachers and employees e-urban Depok.
5. CONCLUSIONS AND SUGGESTION 5.1. Conclusion
after conducting research on academic information system acceptance by using tam approach at pancoran mas subdistrict, it can be concluded that:
1. From each of the tested variables, it was found that the perceived usefulness and actual system use variables had the most important influence on the acceptance of E-Kelurahan information system. 2. Testing of hypothesis also shows the value of influence as follows:
2.1. Testing hypothesis 1 is to test the influence of perceived ease ofuse against perceived usefulness shows the influence of 58.3%. 2.2. Hypothesis 2 testing is to test the influence of perceived usefulness to attitude toward using shows the influence of 36.0%.
2.3. Hypothesis 3 testing is to test the influence of perceived ease of use to attitude toward using shows the influence of 36%.
2.2. Hypothesis 4 testing is to test the influence of perceived usefulness to behavioral intention shows the influence of 49.8%.
2.3. Hypothesis 5 testing is to test the influence of Attitude Toward Using to Behavioral Intention shows the influence of 59.9%.
2.4. Hypothesis Testing 6 is to examine the effect of Behavioral Intention on Actual System Use shows the influence of 85.8%.
726 variables have considerable influence on the success of system acceptance at Pancoran Mas Subdistrict. 4. Recommendations given to the institution are
recommendations on system development,
implementation process recommendations and user interface system recommendations.
5. User Interface analysis is used as a recommendation of companion system utilization. Is a method used to test the interface system. Some recommendations that can be given are:
5.1. Utilization of system pages to be optimized.
5.2. Use of developed systems.
5.3. Add a dialog box to ensure the user about the process being implemented.
5.2. Suggestion
After conducting research on the acceptance of E-kelurahan information system in Pancoran Mas Subdistrict, it can be suggested several things as follows:
1. Based on TAM evaluation results, system development should focus on system benefits and ease of use. It is expected that the future can be developed a system that can be more easily utilized and can support various service processes.
2. Socialization of the system is very important in supporting the acceptance of the system implementation process within an institution. This can be a means of increasing the intention of potential users in utilizing the system.
3. The evaluation process plays an important role in finding a variety of constraints and finding solutions. So that utilization system or system development can achieve the expected results.
REFERENCES:
[1] Ajzen, I. and M. Fishbein. 1980.
Understanding Attitudes and Predicting Social Behavior. M Prentice-Hall, Englewood Cliffs,
NJ.
[2] Davis, Fred D. 1989. Perceived Usefulness, Perceived Ease of Use, and User Acceptance of Information Technology. In MIS Quarterly, September, Vol. 13 Issue 3 p.318-340.
[3] Fernanda, the Desi. 2011. The paradigm of New Public Management (NPM) As the Framework for Reforms Towards Good Governance (Good Governance) in Indonesia
[4] Ghozali, I. 2005. Applications Multivariate Analysis with SPSS Program. Semarang:
Diponegoro University Publishing Board.
[5] Jogiyanto. 2003. Information Technology
Systems. Yogyakarta: Andi.
[6] Jogiyanto. 2007. Behavioral Information
Systems. Yogyakarta: Andi
[7] Muntianah, 2012, Effect of Interests Attitudes toward the Actual Use of Information Technology Acceptance Theory Approach Model, Profit, Vol. 6, No. 1.
[8] Sanjaya, IPS. (2005). Effect of Benefits and Ease on Behaving Interests (behavioral intention) In the use of the Internet.
Performance 9 things 146-156.
[9] Afrial, Rozy J. 2009. Quality of Public Services Sub-district after the Change Position and function as the regional district head. Administration and Organizational Science Journal, Volume 16, Number 2, May-August, p. 87-95.Htmlaccessed 1 November