International Journal of Emerging Technology and Advanced Engineering
Website: www.ijetae.com (ISSN 2250-2459,ISO 9001:2008 Certified Journal, Volume 4, Issue 9, September 2014)
470
The ICA Based Soft-Computing Algorithms for Signal Cleaning
and Feature Selection in (for) Automated ECG Pattern
Recognition
M Sarfraz
1, A Ahmed Khan
2, F Li
31,3School of Computing, Science and Engineering, University of Salford, Salford, UK 2Electrical Engineering, Salman bin Abdul Aziz University, Alkharj, Saudi Arabia
Abstract—Electro Cardiogram (ECG) signals are affected
by various kinds of noise and artifacts that may hide important information of interest. The information is extracted to gain insights that assist explanation and identification of diverse pathological conditions. This was traditionally done by an expert through visual inspection of ECGs. The complexity and tediousness of this onus hinder long-term monitoring and rapid diagnosis, computerized and automated ECG signal processing are therefore sought after. In this paper an algorithm that uses independent component analysis (ICA) to improve the performance of ECG pattern recognition is proposed. The algorithm deploys the basis functions obtained via the ICA of typical ECG to extract ICA features of ECG signals for further pattern recognition, with the hypothesis that components of an ECG signal generated by different parts of the heart during normal and arrhythmic cardiac cycles might be independent. The features obtained via the ICA together with the R-R interval and QRS segment power are jointly used as the input to a machine learning classifier, an artificial neural network in this case. Results from training and validation of the MIT-BIH Arrhythmia database shows significantly improved performance in terms of recognition accuracy. This new method also allows for the reduction of the number of inputs to the classifier, simplifying the system and increasing the real-time performance. The paper presents the algorithm, discusses the principle algorithm and presents the validation results.
Keywords— Electrocardiogram, independent component
analysis, machine learning, pattern recognition, Back propagation neural network.
I. INTRODUCTION
Electrocardiogram (ECG) is a record of electrical activity generated by heart beats and measured from the surface of the body using special electrodes. It can be viewed, in a simpler term, as an electrical signature of heart behaviour. ECG signals are acquired by placing electrodes on the body surface at a number of prescribed locations and connecting the electrodes in different configurations to differential voltage amplifiers and a recorder.
Many components of a measured ECG signal originated from different and hypothetically independent sources, the joint effect is a linear combination of them presented at the ECG electrodes. As a common clinical diagnostic tool, the ECG has extended its applications for long-term and on-site monitoring of many cardiac conditions and diseases. Prompt diagnosis, timely treatment and long term monitoring can prevent unexpected heart attack or other forms of heart failure. Automated ECG analysis is a typical signal processing and pattern recognition problem studied by many researchers and the developed systems used broadly in clinical settings over the past few decades.
The applications of Independent Component Analysis (ICA) and Blind Source Separation (BSS) to ECG and other biomedical signal processing are a relatively new but rapidly expanding area of study. The potential of blind signal separation to extract extra information about the heart and the body has been explored [1,2]. Independent component analysis has been found useful in revealing hidden factors of biomedical signals [3-7]. The method of using the ICA and BSS to separate motion induced noise was developed to improve the reliability of automated ECG recognition by the authors [8, 9].
International Journal of Emerging Technology and Advanced Engineering
Website: www.ijetae.com (ISSN 2250-2459,ISO 9001:2008 Certified Journal, Volume 4, Issue 9, September 2014)
471 II. ECGREVIEW
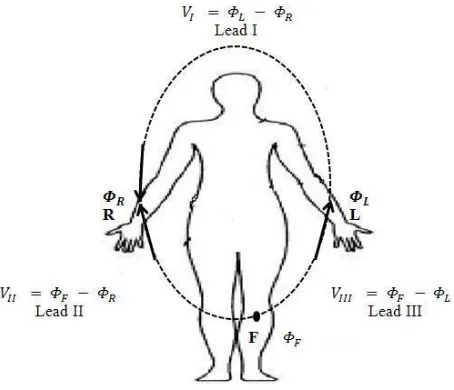
The ECG is measured by placing electrodes on the body surface at various prescribed locations and connecting the electrodes in different configurations to voltage amplifiers and a recorder. As a basic configuration, the ―three-lead ECG‖ is the most common among many other possible configurations. It is based on Einthoven triangle, [10] and uses only three leads for measurements to give a general profile of electrical activities of the heart.
As the electrode in left leg act as ground and the potential difference of other two electrodes are measured in reference with ground electrode hence only two of these three leads are independent. The two-lead ECG configuration is routinely used in the Holter monitoring that enables the recording of the heart activity of a subject continuously over a long time with portable devices [11]
[image:2.612.338.559.287.437.2]As the electrode in left leg act as ground and the potential difference of other two electrodes are measured in reference with ground electrode hence only two of these three leads are independent. The two-lead ECG configuration is routinely used in the Holter monitoring that enables the recording of the heart activity of a subject continuously over a long time with portable devices [11]
Fig. 1 Einthoven three limb leads method
We used data from lead II obtained from MIT-BIH [12,13]. The source of the ECGs included in the MIT-BIH Arrhythmia Database is a set of over 4000 long-term Holter recordings that were obtained by the Beth Israel Hospital. It is widely used as a benchmark or reference dataset in ECG analysis and pattern recognition work [3, 5, 14-16].
III. INDEPENDENT COMPONENT ANALYSIS
[image:2.612.55.282.415.610.2]Independent component analysis is a statistical method that is used to identify underlying factors or components that are statistically independent [17].The attractive feature of the ICA is that it is able to statistically separate out individual sources from their mixtures without prior information about the sources and the mixing parameters. Cocktail party problem as illustrated in Fig 2 is a classic example to explain the ICA based BSS. Two talkers are heard by two listeners (or picked up by two microphones), due to distance discrepancy, each listener hears a different linear mixture of the two sources.
Fig. 2 cocktail party problem
(1)
Where vector x(t) represents the signals received, s(t) the original source signals, and A the mixing matrix. The objective is to separate the individual voices from the linear mixture. Given the conditions of same number of sources as there are receivers.
(2)
(3)
Where x1 and x2 are the signals received by the
microphone, the presence of sources s1ands2 in x1 and x2
is determined by the mixing parameters a11, a12, a21and
a22. We have to separate individual sources from the
mixture, with no information about the sources and mixing parameters available.
International Journal of Emerging Technology and Advanced Engineering
Website: www.ijetae.com (ISSN 2250-2459,ISO 9001:2008 Certified Journal, Volume 4, Issue 9, September 2014)
472 There are a number of algorithms for the ICA. In this study, a fixed-point algorithm was adopted to estimate the independent components [19]. FastICA is one of the popular ICA techniques of this type [20]and is used by numerous researchers for various purposes. . FastICA attempts to separate underlying sources from the given measurement set based on their ‗non-Gaussianity‘. The basic principle behind the FastICA is that the fast fixed-point iterative algorithm undertakes to find projections that maximize the non-Gaussianity of components by their kurtosis (the fourth-order cumulant given to a random variable). In simpler terms, as kurtosis is identically zero for Gaussian distributed signals, the objective is to maximize the magnitude of the kurtosis to make the estimated sources as non-Gaussian (i.e. as independent) as possible. The kurtosis that is used to describe the peakedness of a distribution is given by
(4)
For a zero-mean random variable x. Further details about the FastICA algorithm can be found in [4, 20]. In the proposed algorithm the ICA is used in an unusual way. Instead of performing blind source separation, it is used to determine the underlying features or independent components (ICs) of different ECG arrhythmias that are statistically independent to one another. Thereby the ICs are selected according to their significance and mutual independence with each other to form a feature set along with other morphological and time domain features to be used as input to classifier.
Proposed method
The basic ICA model is that a vector of unknown sources s is not observed directly, but from a linear combination of them.
(5)
Where x is a N x 1 column vector, A is an N x N mixing
matrix, and s is a N x 1 column vector of the source signals. The columns of A, {ai} are known as the basis function
which generate the observed signals. The inverse of mixing matrix A is W, which transforms the original signals into the unknown source coefficients.
(6)
The objective of the ICA algorithm is to find the basis function by adapting and learning from the ECG data x in this study.
The cost function in ICA can be minimization of mutual information of de-mixing model output as used in Infomax algorithm [21] or the maximization of non-Gaussianity used in FastICA algorithms [22]. Using ICA as a feature
extraction method, the basis functions , are considered as
the basis features and the component of is considered to be the coefficient for each basis feature in the feature space. So the model can be written as
(7)
[image:3.612.334.559.354.403.2]As compared to correlation-based transformations such as principal component analysis (PCA), the ICA not only uses second-order statistics to decorrelate the signals, but also uses high-order statistics to reduce high-order dependencies. Thus the output coefficients corresponding to different basis functions are as statistically independent as possible.
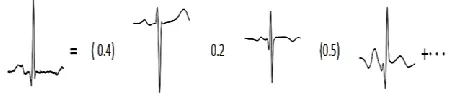
Fig. 3. A normal heartbeat is a linear combination of ICA bases with Coefficients, e.g.(-0.4)·ai+(0.2)·aj+0.5·ak+...
Fig. 3 demonstrates the linear decomposition of ECG signals as in Eq. 8. The segment of a normal ECG signal with single heartbeat can be represented as a linear superposition of the ICA basis functions {ai,aj,ak,...} scaled
by the corresponding coefficients {si,sj,sk,...}.The heartbeat
segment is represented mostly by{ai,aj,ak}, as most of the
other coefficients are almost zero. The ICA basis functions reveal the statistical structures of the single heartbeat segments of ECG.
International Journal of Emerging Technology and Advanced Engineering
Website: www.ijetae.com (ISSN 2250-2459,ISO 9001:2008 Certified Journal, Volume 4, Issue 9, September 2014)
[image:4.612.341.550.276.422.2]473 The ECG segments of the records in the database were divided samples into two sets. One set for training and the other for testing. With the annotated beats information provided in the data set. 50 records of normal and different arrhythmias were selected, each dataset consisted about 100 beats of each type. One dataset was used for training and other for testing. Randomly selected the ECG samples to constitute the observed data matrix [x]. For 8 types of arrhythmia, randomly select 2 ECG samples from each record of the database, and a data matrix 100x200 are obtained.
TABLE 1
RECORDS AND NUMBER OF ECG SAMPLES USED
Type MIT-BIH data, file reference
NORM
100,101,103,105,108 100 100 112,113,114,115,117 100 100 121,122,123,202,205 100 100 219,230,234
LBBB 109,111,207,214
RBBB 118,124,212,231
PVC 106,119,200,203,208,
213,221,228,233,116,201,210,215
APB 209,222,232,220,223
PB 102,104,107,217
VFW 207
VEB 207
We obtained the unmixing matrix W using FastICA, and then re-order the row of the W matrix by the norm of the row from the smallest to the largest. After the calculation of independent components (ICs) .They were employed as bases.
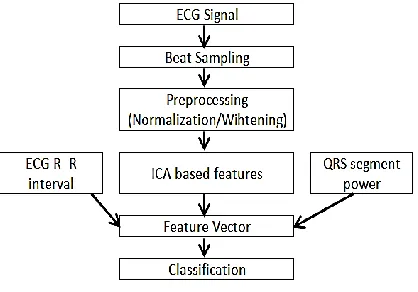
In both training and testing stage, each sample of the training set is projected onto the ICs. The projections constitute the ICA-feature vector. Along with the RR interval, and QRS signal power the feature vector is obtained. Two features were extracted from the RR sequence. The pre-RR-interval was the RR interval between a given heartbeat and the previous heartbeat. The post-RR-interval was the RR-interval between a given heartbeat and the following heartbeat. Both of them were calculated using pan Tompkins algorithm for QRS detection [23].
We used BPNN as classifier in the training stage. The input is feature vectors and the output value can be set at 1, 2, 3, or 8 for NORM, LBBB, RBBB, or PVC (8 types of ECG). The aim of this stage is for adjusting the best parameters in neural networks for the best classification. To study the effect of the
[image:4.612.44.297.290.457.2]Numbers of ICs in ECG beat classification, the numbers of ICs were varied from 5 to 40 and their effects were investigated. We achieved the best performance of classifier with 15 ICs. 10 fold approach was used to select number if ICs. Further increasing the number of ICs from 15 did not improve classification accuracy regularly. Even though some improvement was recorded but it was neglected due to non-uniformity. After the neural network is trained, we applied the other set of ECG samples for testing the performance of the classifier and calculating the specificity and sensitivity.
Fig. 4. Block diagram of the proposed feature extraction and classification system
Classification was done using Back Propagation neural network (BPNN) implemented in MATLAB software. ANN are widely used classifier for ECG [5], [7], [16], [24], [25]. Back-propagation neural network (BPNN) used in this study which is a three-layer feed-forward structure [26] The first layer is the input layer that has the ICA features , pre-RR-interval, post-RR-interval and QRS segment power as inputs.
International Journal of Emerging Technology and Advanced Engineering
Website: www.ijetae.com (ISSN 2250-2459,ISO 9001:2008 Certified Journal, Volume 4, Issue 9, September 2014)
474 Time taken for the training of classification was about 1.2 seconds in the Matlab computing environment based on the average over 10 times.
IV. RESULTS &DISCUSSION
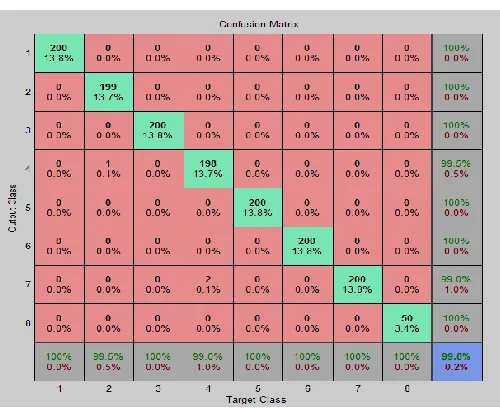
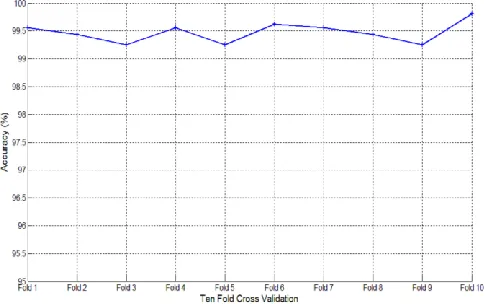
A total of eight ECG beat types were selected from the MIT-BIH arrhythmia database for experiments. The eight beat types employed in the study were normal beat (NORM), left bundle branch block beat (LBBB), right bundle branch block beat (RBBB), an atrial premature beat (APB), premature ventricular contraction (PVC), paced beat (PB), ventricular flutter wave (VFW), and ventricular escape beat (VEB). The accuracy, specificity and sensitivities of the neural network classifier are summarized in Fig. 6. Classification Performance into eight classes with proposed method best accuracy of 99.8 % and overall accuracy of 99.65 % were achieved, which is better than any existing methods discussed in the literature. In this study, we used the 10-fold cross validation technique for training and testing of the classifiers as in Fig. 8. Results of Arrhythmia Classification Accuracy with proposed method. The correct classification or misclassification was assessed as True Positive (TP), True Negative (TN), False Positive (FP) and False Negative (FN). Based on these measures the specificity, and accuracy was determined as shown in Fig. 9. Results of specificity with proposed method shows the sensitivity of different classifiers during each fold of the classification using ICs. Matlab software was used for the signal processing, pattern recognition, visualization and user
[image:5.612.325.575.130.334.2]Interface in this study. The proposed methodology in this study can be used in arrhythmia monitoring and identification systems, telemedicine applications, Holter device ECG monitoring, and general screening for cardiac health.
[image:5.612.54.290.558.636.2]Figure 5 Detailed accuracy for different arrhythmias with the proposed method
Fig. 6. Classification Performance into eight classes with proposed method
V. CONCLUSION
This paper has proposed and validated a method and algorithms for ECG arrhythmia classification using features extracted with ICA. A new feature set has been developed, it includes morphological ECG features along with ICA extracted features. The classification experiments were performed on the MIT-BIH Arrhythmia Database which includes the normal sinus beat and 8 types of arrhythmia beats. Computer simulations show that ICA based feature extraction method outperforms any other reported methods. It also shows that selecting relevant features of the feature set can improve the recognition performance. This makes a robust feature set for ECG arrhythmia classification. Comparison of classification accuracy, specificity and sensitivity with other state-of-the-art method is done and its efficiency is clearly demonstrated.
[image:5.612.326.554.566.688.2]International Journal of Emerging Technology and Advanced Engineering
Website: www.ijetae.com (ISSN 2250-2459,ISO 9001:2008 Certified Journal, Volume 4, Issue 9, September 2014)
[image:6.612.53.296.144.296.2]475
[image:6.612.53.298.337.475.2]Fig. 8. Results of Arrhythmia Classification Accuracy with proposed method
Fig. 9. Results of specificity with proposed method
REFERENCES
[1] T.-P. Jung, S. Makeig, T.-W. Lee, M. J. McKeown, G. Brown, A. J. Bell, and T. J. Sejnowski, ―Independent component analysis of biomedical signals,‖ 2000, pp. 633–644.
[2] M. I. Owis, A.-B. Youssef, and Y. M. Kadah, ―Characterisation of electrocardiogram signals based on blind source separation,‖ Med. Biol. Eng. Comput., vol. 40, no. 5, pp. 557–564, 2002.
[3] K.-T. Chou and S.-N. Yu, ―Categorizing Heartbeats by Independent Component Analysis and Support Vector Machines,‖ in Intelligent Systems Design and Applications, 2008. ISDA‘08. Eighth International Conference on, 2008, vol. 1, pp. 599–602.
[4] C. J. James and C. W. Hesse, ―Independent component analysis for biomedical signals,‖ Physiol. Meas., vol. 26, no. 1, p. R15, 2005. [5] X. Jiang, L. Zhang, Q. Zhao, and S. Albayrak, ―ECG arrhythmias
recognition system based on independent component analysis feature extraction,‖ in TENCON 2006. 2006 IEEE Region 10 Conference, 2006, pp. 1–4.
[6] T. M. Nazmy, H. El-Messiry, and B. Al-Bokhity, ―Classification of Cardiac Arrhythmia based on Hybrid System,‖ Int. J. Comput. Appl., vol. 2, no. 4, 2010.
[7] S.-N. Yu and K.-T. Chou, ―A switchable scheme for ECG beat classification based on independent component analysis,‖ Expert Syst. Appl., vol. 33, no. 4, pp. 824–829, 2007.
[8] M. Sarfraz and F. Li, ―Independent Component Analysis for Motion Artifacts Removal from Electrocardiogram,‖ Glob. Perspect. Artif. Intell., vol. 1, no. 4, 2013.
[9] M. Sarfraz, F. Li, and A. A. Khan, ―Independent Component Analysis Methods to Improve Electrocardiogram Patterns Recognition in the Presence of non-Trivial Artifacts,‖ in ICBBS 2014, Copenhagen, Denmark, 2014, vol. III.
[10] J. Malmivuo and R. Plonsey, Bioelectromagnetism: principles and applications of bioelectric and biomagnetic fields. Oxford University Press, 1995.
[11] C. Ye, M. T. Coimbra, and B. V. Kumar, ―Investigation of human identification using two-lead electrocardiogram (ECG) signals,‖ in Biometrics: Theory Applications and Systems (BTAS), 2010 Fourth IEEE International Conference on, 2010, pp. 1–8.
[12] A. L. Goldberger, L. A. Amaral, L. Glass, J. M. Hausdorff, P. C. Ivanov, R. G. Mark, J. E. Mietus, G. B. Moody, C.-K. Peng, and H. E. Stanley, ―Physiobank, physiotoolkit, and physionet components of a new research resource for complex physiologic signals,‖ Circulation, vol. 101, no. 23, pp. e215–e220, 2000.
[13] G. B. Moody, W. Muldrow, and R. G. Mark, ―A noise stress test for arrhythmia detectors,‖ Comput. Cardiol., vol. 11, no. 3, pp. 381–384, 1984.
[14] N. Belgacem, M. A. Chikh, and F. B. Reguig, ―Supervised classification of ECG using neural networks,‖ 2003.
[15] G. B. Moody, R. G. Mark, and A. L. Goldberger, ―PhysioNet: a web-based resource for the study of physiologic signals,‖ Eng. Med. Biol. Mag. IEEE, vol. 20, no. 3, pp. 70–75, 2001.
[16] J.-S. Wang, W.-C. Chiang, Y.-T. C. Yang, and Y.-L. Hsu, ―An effective ECG arrhythmia classification algorithm,‖ in Bio-Inspired Computing and Applications, Springer, 2012, pp. 545–550. [17] J. Karhunen and E. Oja, ―Hyva¨rinen, A., & Independent component
analysis.,‖ John Wiley Sons, 2001.
[18] T. He, G. Clifford, and L. Tarassenko, ―Application of independent component analysis in removing artefacts from the electrocardiogram,‖ Neural Comput. Appl., vol. 15, no. 2, pp. 105– 116, 2006.
[19] A. Hyvarinen, ―Fast and robust fixed-point algorithms for independent component analysis,‖ Neural Netw. IEEE Trans. On, vol. 10, no. 3, pp. 626–634, 1999.
[20] A. Hyvärinen and E. Oja, ―A fast fixed-point algorithm for independent component analysis,‖ Neural Comput., vol. 9, no. 7, pp. 1483–1492, 1997.
[21] A. J. Bell and T. J. Sejnowski, ―An information-maximization approach to blind separation and blind deconvolution,‖ Neural Comput., vol. 7, no. 6, pp. 1129–1159, 1995.
[22] A. Hyvarinen, ―Fast and robust fixed-point algorithms for independent component analysis,‖ Neural Netw. IEEE Trans. On, vol. 10, no. 3, pp. 626–634, 1999.
[23] J. Pan and W. J. Tompkins, ―A real-time QRS detection algorithm,‖ Biomed. Eng. IEEE Trans. On, no. 3, pp. 230–236, 1985.
International Journal of Emerging Technology and Advanced Engineering
Website: www.ijetae.com (ISSN 2250-2459,ISO 9001:2008 Certified Journal, Volume 4, Issue 9, September 2014)
476
[25] N. Belgacem, M. A. Chikh, and F. B. Reguig, ―Supervised classification of ECG using neural networks,‖ 2003.
[26] J.-S. R. Jang, C.-T. Sun, and E. Mizutani, ―Neuro-fuzzy and soft computing-a computational approach to learning and machine intelligence [Book Review],‖ Autom. Control IEEE Trans. On, vol. 42, no. 10, pp. 1482–1484, 1997.