4909
MONITORING AND CONTROLLING BEHAVIORS OF
LIVESTOCK USING VIRTUAL FENCES
1AZAMJON MUMINOV, 2 DAEYOUNG NA, 3CHEOL WON LEE, 4 HYUN KYU KANG, 5HEUNG SEOK JEON
1,3,4,5 Konkuk University, Department of Computer Engineering, Chungju 27478, Rep. of Korea
2Handong Global University, Global Leadership School, Pohang 37554, Rep. of Korea
E-mail: 1[email protected], 2[email protected], 3[email protected], 4[email protected],
ABSTRACT
This paper describes our virtual fence system. The present invention is a method of controlling animals without visible physical fences and monitoring their condition. Control occurs through affecting to animals by using one or more signals and electric shocks when they attempt a restricted zone as well as to observe the condition, one of the best machine learning classifications named Support Vector Machines (SVM) is used. A virtual fence boundary can be any geometrical shape. A smart collar worn goats can be detected by using a virtual fence application. Each smart collar consists of an XBee communication module, a global positioning system (GPS), an electrical shocker, and an mp3 player. Stimuli and classification results presented from on-farm experiments with a goat equipped with a smart collar.
Keywords: Virtual Fence, Smart Collar, Livestock, Machine Learning, IoT, SVM.
1. INTRODUCTION
The Internet of Things (IoT) is capable of transforming the world in which we live; more efficient industries, related cars, and smarter cities are all part of the IoT equation. However, the application of technologies, such as IoT in agriculture, can have the most significant impact. Intelligent agriculture based on IoT technology will allow farmers and farmers to reduce waste and increase productivity. So, what is smart farming? Smart agriculture is a capital-intensive and high-tech system for the clean and sustainable development of agriculture for the masses. This is the application of modern communication technologies (ICT) in agriculture. In IoT-based intelligent agriculture, a system designed to monitor the field and control animals using sensors (light, humidity, temperature, soil moisture, etc.). Farmers can track field conditions from anywhere in the world. IoT-based smart farming is very productive compared to the traditional approach [1-3].
In some countries, the livestock industry has been conducted various studies on smart farming using ICT. First, Tiedemann and Quigley [4] began using a smart collar to control livestock in fragile conditions. Their first work, published in 1990 [5], describes experiments in which livestock could be
brought out of the region using remote manual sound and electrical effects. They note that cattle are soon learned the association and staying out of the area, although sometimes cattle can go the wrong way. Cattle are learning to associate a sound stimulus with an electric stimulus, and they suggest that an acoustic stimulus may be sufficient after training. In 1992, they conducted more comprehensive field trials with an improved intelligent collar. The idea of using GPS to automate the generation of stimuli was proposed by Marsh [6]. GPS technology is widely used to monitor the position of the animal world. Anderson [7] relies on the work of Marsh to enable two-way stimulation, different sound stimuli for each ear so that the animal can be better controlled. The actual stimulus used consists of sound signals followed by electric shocks.
Large farm owners can utilize wireless IoT virtual fence application to collect data regarding the location, well-being, and health of their cattle. This information helps them in identifying animals that are sick so they can be separated from the herd, thereby preventing the spread of disease. It also lowers labor costs as ranchers can locate their cattle with the help of IoT based sensors.
4910 Models use sets of adjacent time series segments from a triaxial accelerometer to represent the movement or orientation of a leg, neck, or head; a microphone for recording sound related to animal behavior; or the GPS method for representing spatial motion models [8–10]. These models are commonly known as interval-based classifiers.
Even several virtual fence systems have been confirmed to control goat farming but understanding and developing virtual fence technology for goats is less advanced than other animals. Research is needed to develop a virtual goat enclosure system, determine their activity, and improve goat control using sound stimuli with fewer electric shocks.
In this article, we are developing a virtual fence system for use in smart breeding. Our research is not limited to a virtual fence, but we also added some new features, such as monitoring the condition of animals using ML algorithms. Our IoT-based intelligent farming system is designed not only for traditional, large-scale farming operations, but it can also be new leverage to uplift other growing or general agricultural trends, such as organic farming, family farming, and to increase transparency Agriculture. Unlike previous studies, experiments were provided over a large area to exclude the potential use of virtual fence as a spatial grazing technology for goats.
The remainder of this paper is organized as follows. Section 2 explains the summarized information about our Virtual Fence Project. Section 3 extensively explains the implementation of principle work Client-side (smart collar) of the project, a detailed construction of smart collar hardware and software tools moreover, it discusses the “Server” side and its objectives in our project that
covers: creating virtual fences; real-time
communication with client-side; real-time activity monitoring using SVM classification. Moreover, we explain about experiment schedule. Section 4 describes the experiment process and its result. Section 5 concludes.
2. THE VIRTUAL FENCE PROJECT
Goat breeding is a very laborious activity. Goats and sheep graze on large pens that are created using fences. A typical farm has several pens separated by fences. Animals often rotate between pens to prevent grazing in the pasture. This laborious activity did not receive a technical revolution in the field of
automation, computer technology, and
communications. Farmers spend a massive amount
of time and money on the repair and maintenance of fences. Grazing animals are carried out by large groups of people for an extended period of time. This is physically hard work, often performed in extreme weather conditions.
By creating a Virtual Fence Project, we have tried to figure out a solution for the problems above. To make our project more useful, we decided to make two main functions such as monitoring and controlling animals
2.1 Monitoring
Under the term monitoring, there are two main features. The first one is monitoring the position of animals, and the second is monitoring animals' behavior.
2.1.1 Monitoring Animals Position
We looked at various ways of real-time positioning of animals that help to effectively control animals in our application. Therefore, we chose the most common and popular GPS and geographic information systems (GIS) [11]. We also included the GPS module in the smart collar (for complete information on the hardware components of the smart collar, see section 3).
The geographic information system is less well known, but without GIS, GPS could not possibly be used to its full potential. GIS is a software program designed to store and manipulate the data that GPS accumulates [11].
2.1.2 Monitoring Animals Behavior
To make more useful our Virtual Fence system, we have added activity classification to track animals’ activity in real-time. Another main reason for adding activity classification is to create new functions, which gives more information about the health of the animal. To get a high accurately classified result, we determined to include machine learning algorithm for our Virtual Fence system.
Machine learning offers additional methods for modeling data in classical statistics. In animal behavior, machine learning approaches can solve other formidable problems, such as classifying species, individuals, vocalization, or behavior within complex data sets. This allows us to answer important questions about animal behavior and health.
2.2 Controlling
4911 virtual fence and return the escaped animals to the virtual fence. If we can prevent the escape of the animal, then returning the escaped animals will not be difficult.
2.2.1 Keeping Animals within Virtual Fences
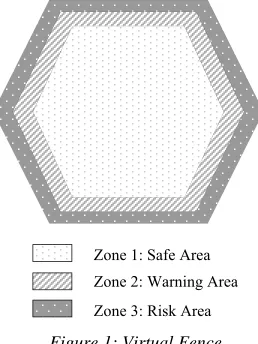
First of all, to keep animals in some area, we need to create virtual fences. Our software-controlled virtual fence is easy to install and move, etc. A virtual fence is an arbitrary polygon drawn by the user and consists of an array of stiffness values for each vertex, as shown in Figure 1. Virtual fence the fences are divided into three zones as shown in Figure 1, and zone 1 is a safe zone, zone 2 is a warning zone, zone 3 has been defined as a risk zone, and outside these zones, we have called the evacuation zone. Users are free to set the distance between each area. In this study, the default value is set taking into account GPS error and livestock speed, so the distance between safety zones and warnings is 5 meters, and the distance between warning zones and risks is 5 meters. The separation of virtual fence management is designed to provide effective management of animals on pastures, and, as we mentioned in the previous section, sound stimulation depends on the zone. If livestock is in a safe place, there is free activity and is not subject to any restrictions.
To keep animals inside virtual fences, we used the most common approaches, such as sound and electronic shockers. However, our goal is to get the best result using conventional approaches. In this regard, we use different sounds and electronic shockers with different lines in different areas, as well as several methods of reproducing sound to prevent animals from adapting to the stimulus.
3. IMPLEMENTATIONS
We have implemented a smart collar that wears on animals’ neck and a smart application for users’ comfortability to monitor and control their animals. In order to make it easier to explain, we called our smart collar as a client and the user program as a server.
3.1 The Virtual Fence Project Client Side
We have implemented a smart collar that wears around the neck of animals and a smart app for the convenience of users to monitor and control their animals. To make it easier to explain, we called our smart collar a client, and the user program a server.
3.1.1 The Smart Collar Hardware
Figure 2(a) shows the main components of a smart collar; it consists of a speaker (3w), halters, and central shield. Figure 2(b) shows the components of the central shield. There are Arduino NANO, GPS module, XBee communication module, MP3 Player, and electronic shocker. A fully assembled collar on the goat neck is shown in Figure 3. The following describes details about each module.
The Arduino Nano is a small, complete, and layout-friendly board based on the ATmega328. It has a pin layout that works well with Mini or Basic Stamp (TX, RX, ATN and GND on one top, power and ground on the other). ATmega328 has 32 KB of memory (also with 2 KB used for the bootloader).
The Adafruit GPS module is connected to the serial port (TX1, RX0) and the 3-volt Arduino NANO power port. The 66-channel MTK3339 Adafruit V3 patch board is based on the MTK3339 chipset, a high-quality GPS module capable of tracking up to 22 satellites via 66 channels, an excellent high-sensitivity receiver (-165 dB tracking) and an integrated antenna. It can do up to 10 location updates per second for high speed, high registration, or tracking sensitivity. Power consumption is incredibly low, only 20 mA during navigation.
To communicate with the server, we used XBee Pro with an XBee USB adapter board. The XBee USB adapter is connected to digital contacts (digital pins 8 and 9) and the Arduino NANO's 5-volt power port. This low-cost XBee USB adapter card comes as a partially assembled kit and provides a cost-effective solution for connecting a PC or microcontroller to any XBee module. A PC connection can be used to configure the XBee module using the Digi X-CTU software. We used the version of the popular XBee XBee Pro (higher power)! This module is a 60 mW Series 1 wireless module Zone 1: Safe Area
Zone 2: Warning Area
[image:3.612.123.252.417.589.2]Zone 3: Risk Area
4912
[image:4.612.99.531.51.252.2](a) (b)
Figure 2: Virtual Fence Smart Collar: (a) The main components of a collar, it consists of a speaker (3w), battery, electronic shocker, halters and central shield; (b) The components of the Smart Collar include an Arduino NANO, XBee communication module, electronic shocker controller, GPS module, accelerometer sensor, SD card reader, and MP3 Player with 8GB memory card.
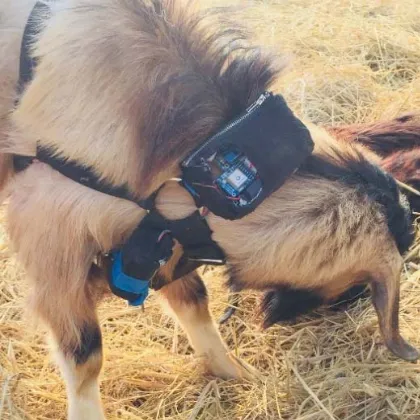
Figure 3: Fully assembled Smart Collar worn on the goat.
(802.15.4 protocol), suitable for point-to-point, multipoint communication and can be converted to a mesh point. They are much more potent than simple XBee modules, great for when we need more features.
We used the DFPlayer Mini to play audio signals. The DFPlayer Mini module is a serial MP3 module that provides perfect integrated hardware decoding of MP3, WMV. Using simple sequential commands, it determines sound reproduction and other functions. Besides, the most critical functions of this module are easy to use, stable, and reliable. The DFPlayer Mini is connected to the digital pins (digital pins 2 and 3) and the Arduino NANO's 5-volt
power port. Accordingly, we used an 8 GB memory card for DFPlayer to store MP3 files.
The electronic shocker is connected to the digital pin 4 of the Arduino NANO by a small shocker controller circuit, which we created.
Future versions of the smart collar are likely to use the same modules as they are now, and it will use a long-lasting battery and waterproof cover to ensure the safety of the smart collar in all weather conditions.
3.1.2 Software Infrastructure
The client-side software process is divided into two parts: sending and receiving data from the server. To meet the connection, we use the XBee wireless network:
[image:4.612.90.300.310.520.2]4913
(a) (b)
Figure 4: (a) An outgoing message example from the smart collar. 1) Area number of an animal, which it has to locate, the default area number is -1. 2) GPS data such as latitude, longitude, altitude, and speed 3) quaternion container to show the 3D position of the smart collar on the Server GUI. 4) Accelerometer and gyro data, (b) An incoming message example from Server. 1) UUID receiving smart collar. 2) State (it uses the command to playing sound) 3) Sound type 4) Sound volume 5) Command for electronic stimuli 6) Electronic stimuli strength volume.
(a) (b)
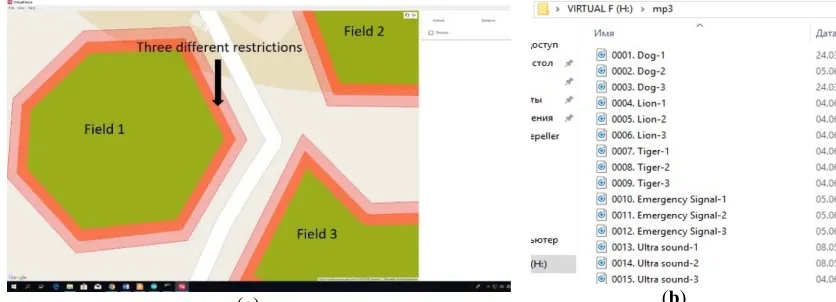
Figure 5: (a) An example of three different fields with three fences restriction. (b) Location MP3 files in the memory card.
only every second, so all GPS receivers can only receive every second.
2) Handling incoming data: After confirming the Server, the Client. The server will check the location of the Client and send commands. An example of an incoming message from the server is shown in Figure 4 (b).
The incoming data from the server depends on the location of the animal inside the virtual fence created by the server. The server creates virtual fields with a limit of three fences (as shown in Figure 5 (a)), this is described in detail in Section 3. If the animal is in the security zone, the Server sends the status number as zero, which means to stop the game or not play sounds. If the animal is between the first and second, or second and third, the server sends the appropriate commands to play the sound in case of going beyond the third fence. The server sends the command to use both the electronic shocker and the sound stimulus. Annoying sounds should be stored in the mp3 folder on the DFPlayer memory card (as shown in Figure 5 (b)) in MP3, WMA, or WAV files.
3.2 The Virtual Fence Project Server Side
We developed a Server that has an Internet connection and an XBee communication module to eliminate the need for physical barriers on farms, etc.
The main tasks of our server are to create virtual fences on a remote computer, view, track the location of an animal through a wireless network in real-time, and determine that livestock deviated from a position in the reception area. We will consider these processes gradually:
3.2.1 Virtual Fence
A geofence (geofence) is a feature in the software that uses a global positioning system or radio frequency identification (RFID) to determine
geographic boundaries. Geo-Fencing is a
combination of Geographic and Fencing, and the one-use case includes a location-based service location device (LBS) that enters or exits a geofence. A virtual fence is an extension of the geo-fence in conjunction with the livestock industry to determine if livestock is inside the virtual fence.
3.2.2 Virtual Fence Algorithms
[image:5.612.89.531.69.144.2] [image:5.612.108.526.210.361.2]4914
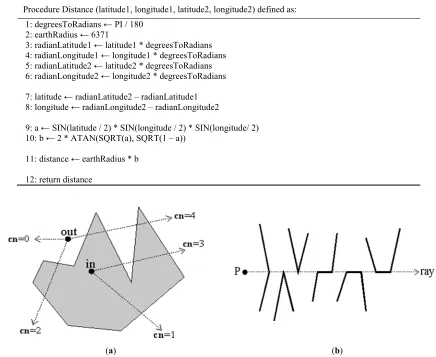
Table 1: Haversine Algorithm linear distance between two points of the spherical coordinate system.
Procedure Distance (latitude1, longitude1, latitude2, longitude2) defined as: 1: degreesToRadians ← PI / 180
2: earthRadius ← 6371
3: radianLatitude1 ← latitude1 * degreesToRadians 4: radianLongitude1 ← longitude1 * degreesToRadians 5: radianLatitude2 ← latitude2 * degreesToRadians 6: radianLongitude2 ← longitude2 * degreesToRadians
7: latitude ← radianLatitude2 – radianLatitude1 8: longitude ← radianLongitude2 – radianLongitude2
9: a ← SIN(latitude / 2) * SIN(longitude / 2) * SIN(longitude/ 2) 10: b ← 2 * ATAN(SQRT(a), SQRT(1 – a))
11: distance ← earthRadius * b
12: return distance
[image:6.612.98.520.325.470.2](a) (b)
Figure 6: Ray Casting algorithm: (a) Crossing Number algorithm (b) Ray Casting problem.
system uses the Mercator spherical projection method based on WGS84 to project objects. Since the Mercator’s spherical projection considers the Earth as a sphere, the Euclidean distance formula used in Cartesian coordinates cannot be used. Generally, the
distance between two points 𝐴 𝑥 , 𝑦 moreover,
𝐵 𝑥 , 𝑦 in the Euclidean space can be calculated by
the following formula:
𝐴𝐵 𝑥 𝑥 𝑦 𝑦 , (1)
However, since the Earth is round, the distance between the two points projected onto the map is a curved line on the surface. The Google Maps API provides a function that calculates the distance between two points in a spherical coordinate system. Two points in the Google Maps coordinate system consist of latitude and longitude. Table 1 shows the algorithm for finding the distance between two points
in a spherical coordinate system using the Harversin formula. Since the rectilinear distance between two points on a sphere is calculated using this formula, the greater the distance between two points, the greater the error. However, this is not a big problem in small areas.
4915
Table 2: Edge Crossing Rules
1. An upward edge includes its starting endpoint, and excludes its final endpoint; 2. A downward edge excludes its starting endpoint, and includes its final endpoint; 3. Horizontal edges are excluded.
4. The edge-ray intersection point must be strictly right of point P.
Table 3. Ray Casting algorithm
Procedure Crossing Number (Point, Vertices) defined as:
1: cn ← 0
2: for each i = 0 to Length(Vertices) do 3: Edge ← Vertices[i] Vertices[i + 1]
5: if Edge crosses upward or Edge crosses downward then // Rule 1 & 2 6: if Point.x < Intersect(Edge.x) and y = Point.y then // Rule 4 7: cn ← cn + 1
8: return cn & 1
using the Jordan curve theory [13]. The Jordan curve theory implies one closed curve with the same connection with a circle. If we move in the same direction along this curve, we will return to the starting point, and the inner and outer parts will be separated based on this curve. As shown in Figure 6, when there is a single polygon with a closed curve, a ray casting algorithm is used to determine if the intersection point is inside or outside the polygon, depending on whether the intersection point is an even or odd number. However, this algorithm has the problem that if a certain point is very close to the boundary, it may have an incorrect result due to a rounding error and that the solution is ambiguous when a line starting at one-point passes through the vertex of the polygon correctly. To solve this problem, the ray reduction algorithm was supplemented using the edge intersection rule, as shown in Table 2. As shown in Table 3, if an even number is returned through the ray reduction algorithm implemented by the intersection number, this is a point located outside the polygon. If an odd number is returned, you may find that the point is inside the polygon. Also, the PIP problem can be solved using the Winding Number, but in our Virtual Fence software, the PIP problem is solved using the Crossing Number algorithm.
3.2.3 Physical Activity Classification
We chose the machine learning algorithm “Support Vector Machines” to classify the activities of animals. SVMs have supervised learning models that analyze data and recognize patterns. An exceptional property is that they simultaneously
minimize the empirical classification error and maximize the geometric margin; therefore, they are also known as maximum margin classifiers. We decided to use SVM because it handles small and unbalanced data well.
However, our classification data is non-linear. It is difficult to categorize as non-linear. In this case, the Kernel Trick technique was used to classify non-linear data. Four types of kernel functions in SVM are presented in Table 2. The most common is the core of the radial basis function (RBF) [14]. So, in this article, we used the RBF core to classify the actions of goats.
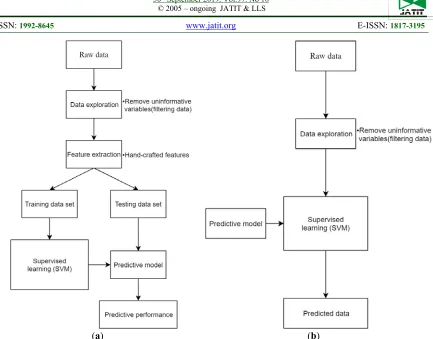
We developed two different functions, using SVM. The first of them create a forecasting model and checks the accuracy of forecasting, as shown in Figure 7 (a). The second performs real-time classification, as shown in Figure 7 (b). Chapter 4 briefly explains the practical use and its results in our research.
3.2.4 Stimulus and Stimuli Method
4916
[image:8.612.95.528.53.392.2](a) (b)
Figure 7: A typical supervised learning workflow (a) Exploratory data analysis is followed by a feature extraction step to derive putative discriminatory variables. The observations are split into training and testing data sets. The predictive model is trained on the training data set. Training involves SVM model generalization step. Finally, the model's generalization performance is computed using the testing dataset, (b) Real-time classification workflow. SVM real-time classification using a predictive model.
dynamic volume, and dynamic sound, as shown in Figure 8, and we also determined a different approach to using electronic shocker stimuli. We use a shocker in the worst situation, that is, when it is difficult to return the animals to a safe area using a single sound. After all, the use of an electronic shocker for animals several times can adversely affect their health and body. So, we developed a function that changes the strength of the shocker over the distance inside the danger zone. We decided to experiment with different
sounds when the animal crosses each fence. Sounds for each fence used in our experiments are included, as shown in Table 4.
3.2.5 Server GUI (Graphical User Interface)
Most of the advantages of our project are more natural to establish convenient server settings and control smart collars. When a user starts the server first time, the server configuration will be as a default (static). On the other hand, there are dynamic settings; it allows users to configure the server according to their desires (Figure 8). Figure 9 shows GUI that includes one animal, which is outside of the area.
4. Physical Experimental Results
[image:8.612.91.299.614.743.2]For the physical experiment, ten goats were chosen, and we have installed the smart collar to one of them. The reason for choosing ten goats is that goats are always used to be with a bunch of group goats. It may affect the experiment result if chose only one.
Table 4. List of sound stimuli for the experiment.
1-fence 2-fence 3-fence
Dog-1 Dog-2 Dog-3
Lion-1 Lion-2 Lion-3 Tiger-1 Tiger-2 Tiger-3 Emergency
Signal-1
Emergency Signal-2
Emergency Signal-3 Ultrasound-1 Ultrasound-2 Ultrasound-3
Dog-3 Lion-3 Tiger-3 Emergency
4917
Figure 8: Virtual Fence settings GUI.
Figure 9: Virtual Fence GUI with an animal outside of the virtual fence.
4.1 Experimental Environments
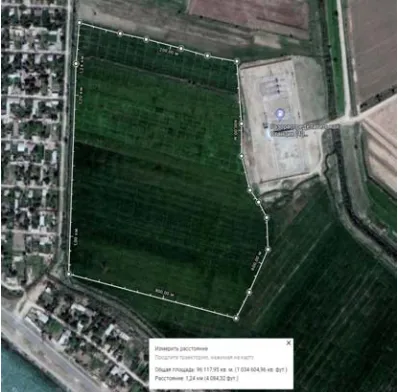
Firstly, we chose a convenient place in Uzbekistan farm to do a physical experiment. We prefer to choose farms with a large area, as shown in Figure 10, which helps to return expected experiment results. In all field experiments, we visually observed the behavior of individual goats with installed the smart collar (Figure 3).
4.2 Stimulation Experiment
The sounds used to stimulate the goats were chosen to explore the effectiveness of a range of sounds and electronic shocker. The sounds used in our experiments included shown in Table 4.
To make a difference and to get rid of adaptation, the Smart Collar plays different sounds with different volume in dB for each zone, as
[image:9.612.323.522.506.702.2]4918
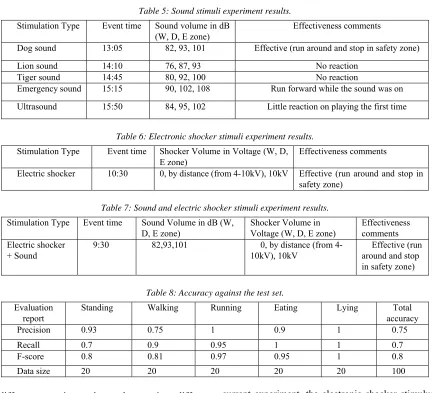
Table 5: Sound stimuli experiment results. Stimulation Type Event time Sound volume in dB
(W, D, E zone)
Effectiveness comments
Dog sound 13:05 82, 93, 101 Effective (run around and stop in safety zone)
Lion sound 14:10 76, 87, 93 No reaction
Tiger sound 14:45 80, 92, 100 No reaction
Emergency sound 15:15 90, 102, 108 Run forward while the sound was on
Ultrasound 15:50 84, 95, 102 Little reaction on playing the first time
Table 6: Electronic shocker stimuli experiment results. Stimulation Type Event time Shocker Volume in Voltage (W, D,
E zone)
Effectiveness comments
Electric shocker 10:30 0, by distance (from 4-10kV), 10kV Effective (run around and stop in safety zone)
Table 7: Sound and electric shocker stimuli experiment results. Stimulation Type Event time Sound Volume in dB (W,
D, E zone)
Shocker Volume in Voltage (W, D, E zone)
Effectiveness comments Electric shocker
+ Sound
9:30 82,93,101 0, by distance (from 4-10kV), 10kV
Effective (run around and stop in safety zone)
Table 8: Accuracy against the test set. Evaluation
report
Standing Walking Running Eating Lying Total accuracy
Precision 0.93 0.75 1 0.9 1 0.75
Recall 0.7 0.9 0.95 1 1 0.7
F-score 0.8 0.81 0.97 0.95 1 0.8
Data size 20 20 20 20 20 100
different experiment have done using different stimulations:
4.2.1 Experiment Using Only Sound Stimulations
In this experiment, we decided to test only sound stimulation. The setting mode of the sound volume for the warning zone: 50%, for the danger zone: 75%, for the escape zone: 100%. As illustrated in Table 5, the lion and tiger sounds were not effective to manipulate the goat. Observed reactions to the ultrasound such as stop eating and look up, but the dog and emergency sounds were more effective, we could see that goat was trying to find a safe place.
4.2.2 Experiment Using Electronic Shocker Stimulations
At this time of the experiment, we decided to use only electronic shocker as stimuli. The shocker mode in PWM between 0 – 250, it is about from 0V to 10kV. In our situation, the shocker mode changes by the distance from 100 to 250 (4 – 10kV). At the
current experiment, the electronic shocker stimulus was proven effectiveness itself. During the electric shock stimulus, the goat behavior had changed from eating activity to walking or running, usually forward.
4.2.3 Experiment Using Sound and Electric Shocker Stimuli
On this state, the experiment was about using shocker and sound stimulation together. During the current experiment, the stimuli were absolutely effective for all time, and several goat’s behaviors have been attended, such as varied widely, running ahead, etc.
4.2.4 Collecting Data for Goat Behavior
4919
4.3 SVM Experiment
RBF kernel non-linear SVM needs gamma and C parameters. In our experiments, we used the default parameters of SVM classifications with RBF [15].
After getting some conditions data from the last experiment, we made training sets for SVM. The training sets consist of 200 data for each condition, so the total training set data is 1000. To evaluate the accuracy of SVM using 20 data for each condition and the total testing set is 100. The result of total accuracy is 91% from Table 8.
5. Conclusion
In this article, we introduced the concept of a virtual fence, such as a server and a device that applies a stimulus to an animal depending on its position concerning one or more lines of the fence. The fencing algorithm is implemented using a small computer device that takes into account the position that the animal wears, which we call the “smart collar”, wears. We described a simulator based on potential fields and animal models with a state, the parameters of which are determined by field observations and track data obtained from Smart Collar. We examined the effects of sound and electrical effects on animals, but we had questions because of addiction. Moreover, we considered the possibility of infrequently using the electric shock stimulus, because we thought it would be ferocious if we used it often. Instead, we decided to use different sounds to scare and control the animals (as shown in Table 4). Users can select a sound from the list manually to avoid animals getting used to the same sounds.
The classification performance for five of the goat behaviors classes; grazing, walking, running, standing, and lying, were presented in this analysis. The RBF kernel-based SVM classification offered a significantly high classification performance for the five goat behaviors, as shown in Table 8. The RBF kernel-based SVM classification model classified lying behavior with an extremely high classification
accuracy (F-score of 1), while grazing, running,
walking, and standing behaviors were also classified
with high accuracy (F-score of 0.95, 0.97, 0.81, and
0.8, respectively).
Our future work has several different directions and different places. We want to create new features that provide more information about animal health, which will lead to the emergence of new and improved models. These models will lead to a better understanding of the behavior and control of
animals at the individual and group levels, which can affect not only the goat industry but also agriculture in a broader sense.
ACKNOWLEDGEMENT:
This research was supported by Basic Science Research Program through the National Research Foundation of Korea (NRF) funded by the Ministry of Education (2018R1D1A1B07043417)
REFERENCES:
[1] IoT Applications in Agriculture: Written by
Savaram Ravindra. Available online:
https://www.iotforall.com/iot‐applications‐in‐
agriculture/ (accessed on 3 January 2018). [2] Muminov, A.; Jeon, Y.C.; Na, D.; Lee, C.; Jeon,
H.S. Development of a solar powered bird
repeller system with effective bird scarer
sounds. In Proceedings of the 2017
International Conference on Information
Science and Communications Technologies
(ICISCT), Tashkent, Uzbekistan, 2–4 November
2017.
[3] Tiedemann, A.R.; Quigley, T.M.; White, L.D.;
Lauritzen, W.S.; Thomas, J.W.; McInnis, M.K.
Electronic (Fenceless) Control of Livestock; Tech.
Rep. PNW‐RP‐510; United States Department
of Agriculture, Forest Service: Washington, DC,
USA, January 1999.
[4] Quigley, T.M.; Sanderson, H.R.; Tiedemann,
A.R.; McInnis, M.K. Livestock control with
electrical and audio stimulation. Rangel. Arch.
1990, 12, 152–155.
[5] Marsh, R.E. Fenceless Animal Control System
Using GPS Location Information. U.S. Patent
5,868,100, 9 February 1999.
[6] Anderson, D.M.; Hale, C.S. Animal Control
System Using Global Positioning and
Instrumental Animal Conditioning. U.S. Patent
6,232,880, 15 May 2001.
[7] Smith, D.; Rahman, A.; Bishop‐Hurley, G.J.;
Hills, J.; Shahriar, S.; Henry, D.; Rawnsley, R.
Behavior classification of cows fitted with
motion collars: Decomposing multi‐class
classification into a set of binary problems.
Comput. Electron. Agric. 2016, 131, 40–50.
[8] Martiskainen, P.; Jarvinen, M.; Skon, J.‐K.;
Tiirikainen, J.; Kolehmainen, M.; Mononen, J.
4920
dimensional accelerometers and support vector
machines. Appl. Anim. Behav. Sci. 2009, 119, 32– 38.
[9] Gonzlez, L.A.; Bishop‐Hurley, G.J.; Handcock,
R.N.; Crossman, C. Behavioral classification of
data from collars containing motion sensors in
grazing cattle. Comput. Electron. Agric. 2015,
110, 91–102.
[10] Ungar, E.D.; Rutter, S.M.; Classifying cattle jaw
movements: comparing IGER Behaviour
Recorder and acoustic techniques. Appl. Anim.
Behav. Sci. 2006, 98, 11–27.
[11] Roth, S.D. Ray Casting for Modeling Solids.
Comput. Gr. Image Process. 1982, 18, 109–144,
doi:10.1016/0146‐664X(82)90169‐1.
[12] Shimrat, M. Algorithm 112: Position of Point
Relative to Polygon; Communication of the
ACM: New York, NY, USA, 1962; Volume 5, p.
434.
[13] Muminov, A.; Na, D.; Lee, C.; Kang, H.K.; Jeon,
H.S. Modern Virtual Fencing Application:
Monitoring and Controlling Behavior of Goats
Using GPS Collars and Warning Signals.
Sensors 2019, 19, 1598.
[14] Hales, T.C. Jordan’s Proof of the Jordan Curve
Theorem. Stud. Logic Gramm. Rhetor. 2007, 10,
45–60.
[15] Chang, C.; Lin, C. LIBSVM: A library for
support vector machines. ACM Trans. Intell.
Syst. Technol. 2011, 2, 27.
[16] Scikit‐Learn: Machine Learning in Python.
Available online: http://scikit‐learn.org/stable/