IJPSR (2014), Vol. 5, Issue 5 (Research Article)
Received on 09 December, 2013; received in revised form, 20 February, 2014; accepted, 09 March, 2014; published 01 May, 2014
PREPARATION AND CHARACTERIZATION OF SOLID LIPID NANOPARTICLES THROUGH RAPID EXPANSION OF SUPERCRITICAL SOLUTION
Zahra Akbari*1, Masoud Amanlou 2, Javad Karimi-Sabet 4, Abolfazl Golestani 3 and Mojtaba Shariaty
Niassar 1
School of Chemical Engineering, College of engineering, University of Tehran 1, Tehran, Iran
Departments of Medicinal Chemistry 2, Department of Biochemistry 3, Faculty of Pharmacy, Tehran
University of Medical Sciences, Tehran, Iran
Jaber Ebne Hayyan National Research Laboratory, NSTRI 4, Tehran, Iran
ABSTRACT: Rapid expansion of supercritical solution (RESS) has provided a promising alternative to produce ultrafine particles of heat-sensitive materials. Stearic acid is a good lipid for development of solid lipid nanoparticles (SLNs) in drug delivery systems. Therefore, currently, much research on the micronization of stearic acid is going on. In this study, formation of submicron stearic acid was reported by using RESS process. Thanks to high solubility of stearic acid in supercritical CO2, RESS can be used to produce stearic acid nanoparticles and so in this process, extraction temperature and pressure are a bit more than critical point of SC-CO2. The unprocessed and processed stearic acid powders were characterized by means of scanning electron microscopy (SEM), X-ray diffraction (XRD), differential scanning calorimetry (DSC) and Fourier transform infrared spectrophotometry (FT-IR). FT-IR analysis and XRD pattern of processed stearic acid showed that the degree of crystallinity was reduced without any chemical structural change. DSC analysis showed a 2.7◦C decrease in the melting point from that of bulk stearic acid. Also, the RESS processing of stearic acid leads to spherical particles in the range from40nm to 200 nm which are about 600 times smaller than the unprocessed powder as reflected by SEM observations.
INTRODUCTION: Supercritical fluid technology
has been widely used for various applications such as extraction, reaction, chromatography and
material processing. The most important
characteristic of particle formation from
supercritical fluid technology is the possibility of producing solids with unique morphology and small size.
QUICK RESPONSE CODE
DOI:
10.13040/IJPSR.0975-8232.5(5).1693-04
Article can be accessed online on: www.ijpsr.com
DOI link: http://dx.doi.org/10.13040/IJPSR.0975-8232.5(5).1693-04
However the understanding of applying
supercritical fluid to particle formation is still in
their infancy 1. Several papers have been published
about the applications of supercritical fluid on the
preparation of nano-materials 2-4. Supercritical
fluids (SCF) have several properties such as high diffusivity, low viscosity, and high compressibility. These make them attractive solvents for many
industrial processes. Supercritical CO2(SC-CO2) is
the most popular SCF, because it is toxic, non-flammable, easy to obtain and has a near-ambient
critical temperature 5. Small changes in the
temperature or pressure near the critical point result in significant changes in the solubilizing power of supercritical fluid and in turn density.
Keywords:
Rapid Expansion of Supercritical Fluid, Stearic Acid, Solid Lipid Nan particles,
Drug Delivery
Correspondence to Author:
Mojtaba Shariaty- Niassar
School of Chemical Engineering, College of engineering, University of Tehran, Tehran, Iran
Therefore, density depends on the applied temperature and pressure.
Currently, two common routes for particle formation in supercritical fluids are available:
supercritical antisolvent process (SAS) 6-8 and rapid
expansion of supercritical solutions (RESS) 9-11. In
SAS process, the solute of interest is dissolved in the organic solvent and then the solution is sprayed into an excess of antisolvent. While the solubility of the solute in the antisolvent is limited, the organic solvent is miscible with the antisolvent. Under contacting conditions, high mass transfer rates occur. It leads to the formation of solid
microparticles 12.
The RESS process consists of two steps. The first step is an extraction in which the supercritical fluid is saturated with the substrates of interest. This extraction is followed by a sudden depressurization in a nozzle which produces a large decrease in the solvent power and the temperature of the fluid, therefore causing the precipitation of the solute. The morphology of the resulting product, crystalline or amorphous, depends on the chemical structure of the material and on the RESS parameters (temperature, pressure drop, impact distance of the jet against a surface, nozzle
geometry, etc…) 3
.
This process can be applied to micronize non-polar
compounds soluble in SC-CO213. RESS process
omits the problems of the conventional
micronization methods to produce small particles
with narrow particles size distribution (PSD) 14.
Stearic acid is a saturated fatty acid, with 18 carbon-chain length and a high lipophilic character (Figure 1). It is often selected as solid lipid for the
production of lipid nanoparticle dispersions 15.
Stearic acid, like other lipids and related long-chain
compounds, may crystallize in different
polymorphic forms depending on the conditions in
[image:2.612.316.565.118.212.2]which the crystallization is performed 16.
FIG. 1: CHEMICAL STRUCTURE OF STEARIC ACID
Stearic acid as a SLN allows a high drug loading by the less ordinate structure of the lipid matrix. The other advantages of SLNs include: controlled and targeted drug release, feasibility of carrying both hydrophilic and lipophilic drug, improved drug
stability, easy to scale up and sterilize 17-20. Hence,
due to its extensive application in drug delivery system, preparation and characterization of stearic acid nanoparticles was studied.
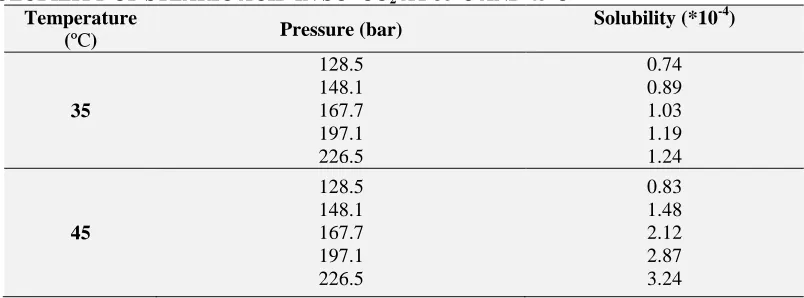
The solubility of solutes in supercritical CO2 is probably the most important property that is needed to be known for the production of micronized solutes by RESS. Solubility of stearic acid in pure
SCF CO2 is reported in literature 21-23. Because of
good solubility in SCF CO2, RESS can be used to
produce stearic acid nanoparticle (Table 1) The
aim of the present study is formation of ultrafine stearic acid by using RESS method as a good lipid for development of SLN application, and also to characterize the physicochemical properties of obtained samples, such as surface properties, crystallinity, morphology, chemical behavior and chemical structure.
TABLE 1: SOLUBILITY OF STEARIC ACID IN SC- CO2 AT 35ºC AND 45ºC 24 Temperature
(ºC) Pressure (bar)
Solubility (*10-4)
35
128.5 148.1 167.7 197.1 226.5
0.74 0.89 1.03 1.19 1.24
45
128.5 148.1 167.7 197.1 226.5
[image:2.612.104.506.584.733.2]MATERIALS AND METHODS:
Materials: Stearic acid (SA, purity: 99.9%, MW: 284.48, Merck Chemical Co.) was used for particles production. Carbon Dioxide with the purity of 99.99% was purchased from Farafan Gas Company which was used as extracting agent. Potassium Bromide was supplied from Merck. It should be stated that all the chemicals were used as received without any further purification.
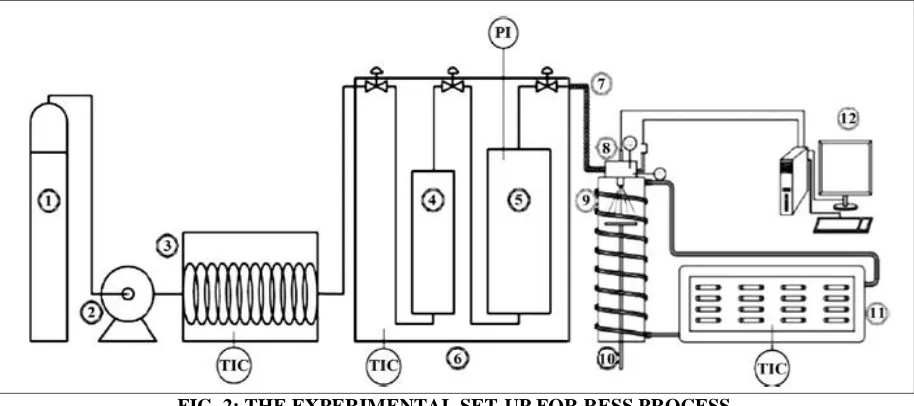
Apparatus: The RESS apparatus is shown
schematically in Figure 2. The system is consisted
of two sections: extraction and precipitation. In order to keep the temperatures of the equilibrium cells constant, a high accurate
temperature-controlled water bath with an uncertainty of ±0.1oC
was used (Type WPE 45, Memmert Germany). The capacity of the equilibrium cells placed in the water bath, vessels 4 and 5 in the schematic diagram, was
200 and 300 cm3, respectively. The body of the
equilibrium cells, valves, and tubes were all made of stainless steel and supplied from Swagelok Company (USA). Two vessels were used in series in order to ensure achieving equilibrium condition. The cells were filled with stearic acid at various temperature and pressure. The pressure of the cells was measured with a digital pressure transducer with an uncertainty of ±0.1MPa (Type KM11, Ashcroft instruments, Germany). The purified gaseous CO2 is liquefied and sub-cooled in a chiller and afterwards compressed to the desired pressure with a reciprocating pump type SFT-10 (Supercritical fluid technologies INC., USA). Sinter metal filter was used on both ends of the vessels 4 and 5 to avoid flooding of the undissolved
material imposed by CO2 flow. Preheating coils
[image:3.612.79.536.357.560.2]and the extraction vessel were immersed at constant temperature water bath. As shown in Fig. 2, the precipitation unit consists of a cell, an expansion device and a collection device. Equipment of material is made of aluminum.
FIG. 2: THE EXPERIMENTAL SET-UP FOR RESS PROCESS
(1) CO2 tank, (2) pump, (3) heat exchanger, (4, 5) equilibrium vessels, (6) constant temperature water bath, (7) preheating tube,
(8) expansion device, (9) precipitation unit, (10) collection sample holder, (11) refrigerated water bath circulator, (12) data acquisition system (TI: temperature indicator; TIC: temperature indicator controller; PI: pressure indicator).
The main part of the expansion device is nozzle (SITEC Co., Switzerland). During rapid expansion and in order to avoid freezing and plugging within the nozzle that is heated by a cartridge heater, which is controlled by a PID controller (Type TPR- 2N, Han Young NUX Co., Republic of Korea). The temperature of the gas flowing through the nozzle was measured by a thermocouple (J-type) and a digital display (Type TPR-2N, Han Young NUX
Co., Republic of Korea). The thermocouple was
placed precisely into the solution stream
the precipitation cell. The top part of the collection device, namely the collection table, is made of Teflon. For collection of the particles, the glass slides are located on this table. The spray distance (the distance between the tip of the nozzle and the surface of the glass slide) can be changed via adjustable bolt and nut mechanism. In previous studies, this apparatus has been used for
nanoparticles production14, 25.
Characterization:
Scanning Electron Microscopy analysis (SEM):
The morphology and size of the precipitated particles were examined by SEM (KYKY, EM-3200, and China). For analysis, the particles were attached to the carbon tape that is on the top of SEM aluminum stubs and were then coated with gold using a sputter coater.
Determination of the particles size distribution was performed with the CLEMEX particles image-analysis package. The SEM figures which were taken from the collected glass slide were introduced to the image processing software. All SEM analyses were done at accelerating voltage of 24 and 26 kV.
X-Ray Diffraction Analysis (XRD): To study the polymorphism and crystalline properties of the lipid, XRD was carried out in a diffractometer
X-ray (Philips, model Xpert PW3040/60,
Netherlands).The conditions were: 40 kV voltages; 30 mA current; at room temperature. The samples were loaded on to the diffractometer and scanned over a range of 2θ values form 10 to 100at a scan rate of 0.020º/ sec.
Fourier Transform Infrared Spectrophotometer
analysis (FTIR): Chemical analysis of
unprocessed and RESS processed stearic acid particles were performed by Fourier Transform
Infrared (FTIR) spectrophotometer (Bruker-
Tenasor 27, Germany). About 1–2 mg of sample was mixed with dry potassium bromide and the samples were examined at transmission mode over
wave number range of 4,000 to 400 cm−1.
Differential scanning calorimetry Analysis (DSC): Thermal behavior of lipid matrices was assessed by DSC and it was performed using DSC Q100 (Mettler Toledo, DSC1, Switzerland). For DSC measurement, 10 mg of powdered stearic acid nanoparticles were put in 40 μl aluminum pans. A scan rate of 10◦C/min was employed in the 0–
[image:4.612.61.546.449.544.2]200oC temperature range.
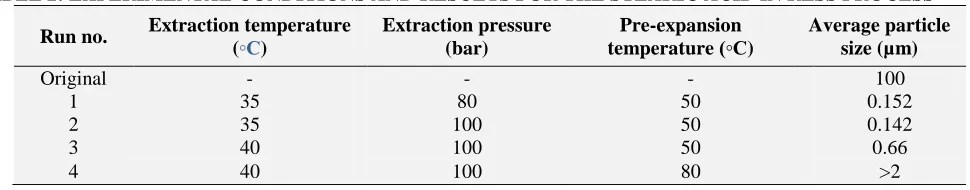
TABLE 2: EXPERIMENTAL CONDITIONS AND RESULTS FOR THE STEARIC ACID IN RESS PROCESS
Run no. Extraction temperature (◦C)
Extraction pressure (bar)
Pre-expansion temperature (◦C)
Average particle size (µm)
Original - - - 100
1 35 80 50 0.152
2 35 100 50 0.142
3 40 100 50 0.66
4 40 100 80 >2
RESULTS AND DISCUSSION:
Particle formation: Summarized in Table 2 are experimental conditions carried out in this study. In each experiment, 2 g (additional material to ensure the attaining of equilibrium conditions) of stearic acid was charged into each equilibrium vessel. It is worth pointing out that glass granular beads were
introduced into the equilibrium vessel in
association with the chemicals to increase the contact surface area. Prior to running the experiments, entrapped air was purged out from the
vessels and piping by CO2 injection.
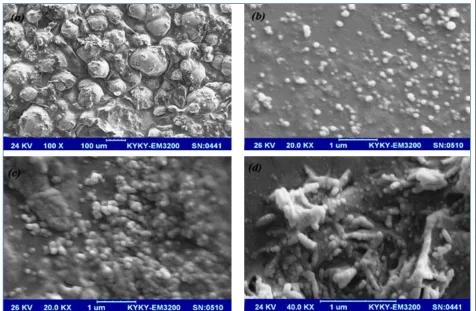
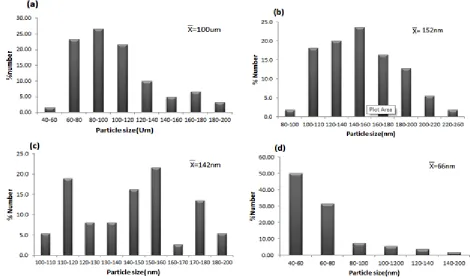
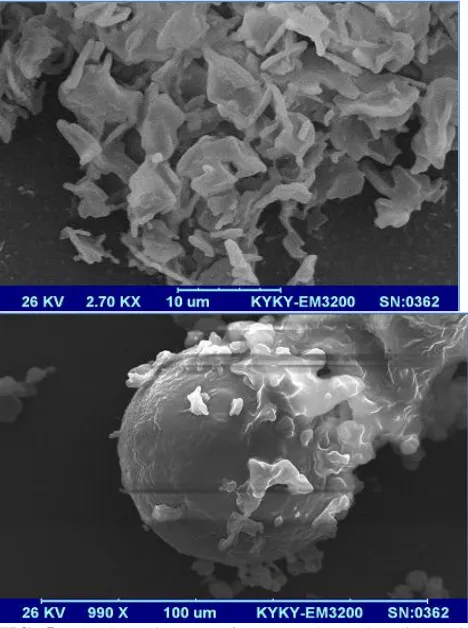
FIG. 3: The SEM images of (a) unprocessed stearic acid particles and processed stearic acid particles prepared by the RESS process (b) at extraction pressure of 80bar, extraction temperature of 35◦C and pre-expansion temperature of 50◦C, (c) at extraction pressure of 100 bar, extraction temperature of 35◦C and pre-expansion temperature of 50◦C, (d) at extraction pressure of 100 bar, extraction temperature of 40◦C and pre-expansion temperature of 50◦C
SEM analysis: For external morphology and shape, the formulation was characterized by scanning electron microscopy. Unprocessed stearic acid particles have an average size of 100 micrometer and are nearly spherical in shape
illustrated in Figure 3a and 4a. After the RESS
process, stearic acid samples which were subject to
SC-CO2 at the extraction temperature of 35◦C ,
pre-expansion temperature of 50oC and extraction
pressure of 80 bar exhibits a smaller average
diameter size of 152nm illustrated in Figure 3b
and 4b. Therefore, the SEM image shows a modification on the morphology of the precipitated particles and they are in spherical shape after RESS processing. It is quite evident that there is a slight change in the particle morphology and a sharp decrease in particle size after processing with RESS. However, under the same treatment condition but with a further increase in the extraction pressure to 100 bars, a lower average diameter size of 142 nm could be achieved for
stearic acid nanoparticles with similar appearance as illustrated in Figure 3c and 4c. Results reveal that there is no significant change in the average diameter size of stearic acid but it is less agglomerated. This could be explained by the following two aspects.
Firstly, the concentration of solution was increased by increasing the extraction pressure; therefore, according to the classical nucleation theory, higher concentration of solution made a decrease of
particle size 26. Secondly, a higher pre-expansion
[image:5.612.70.546.58.369.2]FIG. 4: Particle size distribution of (a) unprocessed stearic acid particles and processed stearic acid particles prepared by the RESS process (b) at extraction pressure of 80 bar, extraction temperature of 35◦C and pre-expansion temperature of 50◦C, (c) at extraction pressure of 100 bar, extraction temperature of 35◦C and pre-expansion temperature of 50◦C, (d) at extraction pressure of 100 bar, extraction temperature of 40 ◦C and pre-expansion temperature of 50◦C
An increase in extraction temperature from 35◦C to 40◦C caused a decrease of average particles size. This could be explained as follows. Increasing the extraction temperature leads to reduce the density of CO2 and simultaneous increase in the solutes vapor pressure. In addition, reduction in the solvent density causes a decrease in the solvent power. On the other hand, increase in the solutes vapor pressure leads to an increase in the stearic acid solubility.
Therefore, the total effect of the two opposing phenomena increases the solubility of stearic acid
in the supercritical fluid 14, 26 and 27. Therefore, high
extraction temperature induces high stearic acid solubility at a constant extraction pressure and leads to increase in the supersaturation. According to classical nucleation theory, the increase of supersaturation leads to decrease in critical nucleus size and therefore the smaller particles were
obtained 14, 28–31. Huang et al1 reported the similar
result for aspirin. Also, our results reveal that an
increase in the extraction temperature to 40oC and
extraction pressure of 100 bar result in a decrease
in the average particle sizes but the agglomeration happened rather quickly and the final products were in fact largely aggregates of nanoscale
particles as shown in Fig. 3d and 4d. The resultant
trend in these series of experiments could be related to the solubility of stearic acid in supercritical carbon dioxide. In evaluation of agglomeration of stearic acid particles, it could be noted that high solubility leads to presence of more particles which provide the situation for them to be in contact. This agglomeration of particles occurred in expansion zone as the particles have ample time to collide with each other and coagulate to form bigger particles.
Hence, these results would show that further increase in extraction pressure and decrease in extraction temperature would decrease particle size but cause the more agglomeration of stearic acid nanoparticles, attributed to increase of stearic acid
solubility in supercritical CO2. Therefore, due to
high solubility of stearic acid in supercritical CO2,
extraction temperature and pressure have been
[image:6.612.73.543.59.338.2]Compared to traditional RESS processes, this process will be more efficient and cost saving when is used for production of solid lipid nanoparticles in large scale. Hence, production of drug loaded solid lipid nanoparticles with different drugs through RESS process is part of our current research activities.
FIG. 5: The SEM images of processed stearic acid particles prepared by the RESS process at extraction pressure of 100bar, extraction temperature of 35◦C and pre-expansion temperature of 80◦C
The pre-expansion temperature for stearic acid in
this study ranges from 50oC to 80oC. As shown in
Fig. 5, when pre-expansion temperature is more than the melting temperature of stearic acid; liquid droplets were formed and quickly solidified within the expansion unit and leads to form larger particles (more than 2 µm). Therefore, pre-expansion
temperature should be less than melting
temperature of micronized stearic acid.
X-Ray Diffraction: X-ray powder diffraction is a rapid analytical technique primarily used for phase identification of a crystalline material. Small changes in the X-ray powder patterns due to the appearance of new peak(s), additional shoulders or
shifts in the peak position may imply the presence of a new polymorph. In this study, the XRD patterns for the unprocessed stearic acid particles are given in Fig. 6(a) which exhibits sharp peaks at 2θ scattered angles 20.92 and 23.32.This is an indication of a crystalline nature of stearic acid. Sharp peaks for micronized stearic acid were exhibits at 2θ scattered angles 21.48 and 23.72,
respectively. XRD analysis patterns for Figure 6a
and 6b are nearly at the same angles and the intensity of the peaks are lower for the RESS processed particles of stearic acid. Lower intensity can be attributed to lowering of crystallinity of the particles. Formation of the nanoparticles can be another reason for lowering the intensity. In other words, both the unprocessed and the stearic acid nanoparticles showed approximately similar X-ray diffraction patterns. This implies that the crystalline form of the micronized stearic acid was approximately unchanged by the RESS process.
[image:7.612.50.284.157.471.2] [image:7.612.313.566.338.667.2] [image:7.612.314.567.342.488.2]Stearic acid exhibits polymorphism, which is defined as the ability of a substance to exist in two or more crystalline phases. Stearic acid has four
polymorphs: A, B, C and E. Polymorph A is
triclinic, whereas forms B, C and E are monoclinic.
The C form is thermodynamically most stable in
the high temperature region (> 32 ◦C) and A and B
forms transform to the C form irreversibly 32.
X-ray diffraction of A, B and C polymorph and
their mixture were studied by Garti et al 33. Their
results show that C polymorph shows two strong peaks at 2θ scattered angles between 20 and 25.
Therefore, Fig. 6(a) and 6(b) reveals that unprocessed and micronized stearic acid may be in C form and there is no any change in crystal structure of stearic acid under high pressure in RESS process.
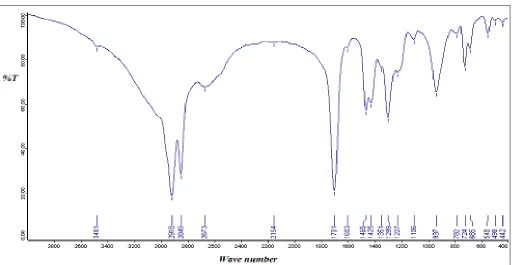
FT-IR analysis: FT-IR spectroscopy was
employed to obtain conformational information about the lipid molecule. In regard to chemical structure of stearic acid, it is shown that stearic acid is composed of two important sections; carboxylic head (COOH) and hydrocarbon tail. The principle
FT-IR peak (Figure 7) of unprocessed stearic acid
obtained at 1,701 cm−1 is due to the absorption of
C=O stretching group. The FT-IR spectrum shows the other characteristic peak of stearic acid such as
hydrogen-bonded O-H stretching at 2849cm−1
which have obscured other peaks in this region.
The other principal peaks respectively, are obtained
2918 cm–1 (C-H stretching) and 1424 cm−1 - 1500
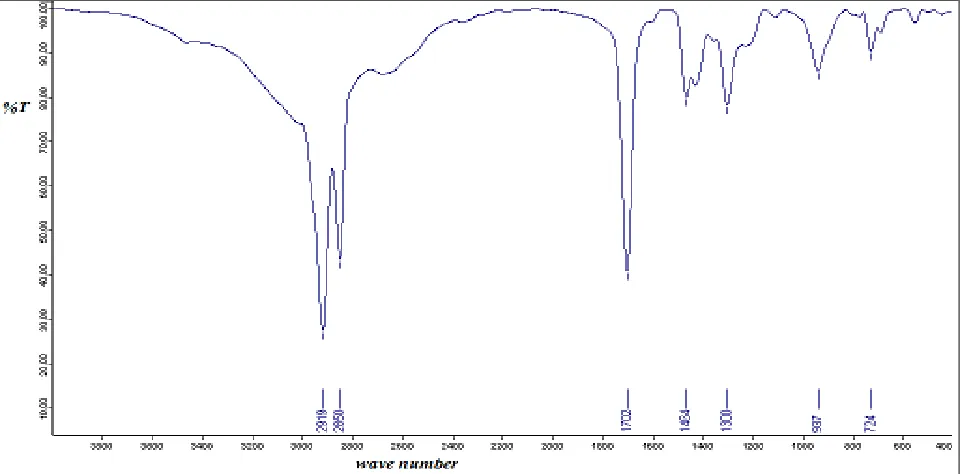
cm−1 (C-H bend). As illustrated in Figure 8, in the
spectrum of micronized stearic acid, principal
peaks were obtained at1702 cm–1 (C=O stretching),
2850 (hydrogen-bonded O-H Stretching) and 2919
cm–1 (aliphatic C-H stretching). This indicates that
[image:8.612.55.568.387.652.2]there is no any change in chemical structure of stearic acid under high pressure in this process.
FIG. 8: FT-IR ANALYSIS OF PROCESSED STEARIC ACID PARTICLES PREPARED BY THE RESS METHOD AT EXTRACTION PRESSURE OF 100BAR, EXTRACTION TEMPERATURE OF 40◦C AND PRE-EXPANSION TEMPERATURE OF 50◦C
The C polymorphic form shows a single strong IR
band at 937 cm-1 corresponding to the OH bending
vibration band of the carboxyl group.
Consequently, comparison of the FT-IR spectrum and XRD pattern of processed and unprocessed
stearic acid (Figure 6, 7 and 8) with the published
FT-IR spectrum of different polymorphic forms of
stearic acid 34 indicates that the crystal structure
was unchanged and confirmed to be as polymorph form C before and after the RESS process.
DSC Analysis: Differential Scanning Calorimetry is a suitable thermal analysis technique for
determining the purity, the polymorphic forms, crystallinity and the melting point of lipids. The obtained nanoparticles were characterized by DSC
analysis. Figure 9 shows the heat flow with
temperature plot of unprocessed and RESS processed stearic acid.
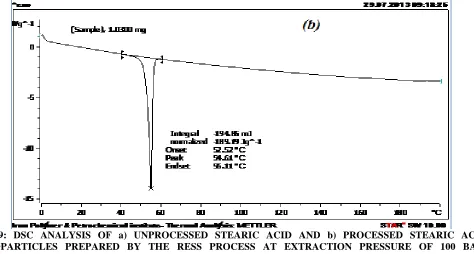
In Figure 9a, only one pronounced melting point peak of unprocessed SA at 57.3 °C was observed, different from literature of 69.6 °C of pure SA. Of course the same result with our study was presented for thermal behavior and melting point of
[image:9.612.67.548.55.292.2]FIG. 9: DSC ANALYSIS OF a) UNPROCESSED STEARIC ACID AND b) PROCESSED STEARIC ACID NANOPARTICLES PREPARED BY THE RESS PROCESS AT EXTRACTION PRESSURE OF 100 BAR, EXTRACTION TEMPERATURE OF 40◦C AND PRE-EXPANSION TEMPERATURE OF 50◦C
The DSC analysis of stearic acid nanoparticles
showed a 2.7oC decrease in the melting point from
that of bulk stearic acid and nanoparticles had the same melting behavior compared to unprocessed
stearic acid in literature 36. The lower melt point
observed for processed stearic acid may be due to its lower crystallinity, which agrees with our XRD analysis. Because for the less-ordered crystal structure, the melting process requires less energy than the perfect crystalline substance to overcome lattice force.
Lipid crystallinity can be determined with DSC by measurement of the heat of fusion of the lipid. Percent of crystallinity is reported by normalizing the measured heat of fusion to that of a100 % crystalline sample of the same lipid. As standard enthalpy change of fusion of pure stearic acid is202.70kj/kg and normalized enthalpy change of fusion of micronized stearic acid is 189.19kj/kg, therefore stearic acid nanoparticles crystallinity is nearly 95%.
Hence, it has less effect on lowering melting point. Besides, lower melting point is possibly due to the fact that small particles obtained from the RESS have higher specific surface area leading to decrease in melting enthalpy.
The thermodynamic relationship between of polymorphs of stearic acid can be studied by DSC analysis. Transition between polymorphs (for example polymorph A to polymorph C or polymorph B to polymorph C) exhibits a weak endothermic peak with a transition enthalpy. Any weak endothermic peak is not observed in DSC curves of unprocessed and micronized stearic acid.
Therefore, DSC analysis confirms that there are not two or more different polymorphs within unprocessed and micronized stearic acid. Hence, X-ray diffraction and IR spectrum along with DSC
reveals that product is composed of
thermodynamically most stable polymorph C.
CONCLUSION: This work investigates the
micronization of stearic acid by using RESS
process of SC-CO2. Our experimental results show
that rapid expansion of stearic acid with SC-CO2 could provide micronized particles.
[image:10.612.77.551.56.310.2]In the results obtained for XRD of micronized stearic acid more diffuse and low intensity peaks were observed as compared to the sharper and high intensity peaks obtained for the bulk lipid.
ACKNOWLEDGMENTS: No financial support
has been used for this study.
REFERENCES:
1. Huang Z, Sun G.B, Chiew Y.C, Kawi S: Formation of ultrafine aspirin particles through rapid expansion of supercritical solutions (RESS). Powder Technology 2005; 160: 127-134.
2. Jung J, Perrut M: Particle design using supercritical fluids: Literature and patent survey. Journal of Supercritical Fluids 2001; 20:179-219.
3. Reverchon E, Adami R: Nanomaterials and supercritical fluids. Journal of Supercritical Fluids 2006; 37:1-22.
4. Martin A, Cocero M.J: Micronization processes with supercritical fluid: fundamentals and mechanisms. Advanced Drug Delivery Reviews 2008; 60:339-350. 5. Ting S. S. T, Macnaughton S. J, Tomasko D. L, Foster
N. R: solubility of Naproxen in supercritical Carbon dioxide with and without cosolvents. Industrial Engineering Chemistry Research 1993; 32:1471-1481. 6. Reverchon E, Della Porta G, De Rosa I, Subra P,
Letourneur D: Supercritical antisolvent micronization of some biopolymers. Journal of Supercritical Fluids 2000; 18: 239-245.
7. Reverchon E, Adami R, CaputoG, De Marco I: Spherical microparticles production by supercritical antisolvent precipitation: Interpretation of results. Journal of Supercritical Fluids 2008; 47:70-84.
8. Tavares Cardoso M.A, Monteiro G.A, Cardoso J.P, Prazeres T.G.V, Figueiredo J.M.F, Martinho J.M.G, Cabral J.M.S, Palavra A.M.F: Supercritical antisolvent micronization of Minocycline hydrochloride. Journal of Supercritical Fluids 2008; 44:238-244.
9. Perrut M, JungJ, Leboeuf F: Enhancement of dissolution rate of poorly-soluble active ingredients by supercritical fluid processes, part I: micronization of neat particles. International Journal of Pharmaceutics 2005, 288: 3-10.
10. Kerc J, Srcic S, Knez Z, Sencar-Bozic P: Micronization of drugs using supercritical carbon dioxide . International Journal of Pharmaceutics 1999; 182, 33- 99.
11. Satvati H.R, Lotfollahi M.N: Effects of extraction temperature, extraction pressure and nozzle diameter on micronization of cholesterol by RESS process. Powder Technology 2011; 210:109-114.
12. Werling J.O, Debenedetti P.J: Numerical modeling of mass transfer in the supercritical antisolvent process. Journal of Supercritical Fluids 1999; 16:167-181. 13. Zeinolabedini Hezave A, Esmaeilzadeh F:
Micronization of drug particles via RESS process. Journal of Supercritical Fluids 2010; 52: 84-98. 14. Karimi-Sabet J, Ghotbi C, Dorkoosh F: Application of
response surface methodology for optimization of
Paracetamol particles formation by RESS Method. Journal of Nanomaterials 2012; 15: Article ID 340379. 15. Severino P, Pinho S.C, Souto E.B, Santana M.H.A:
Polymorphism, crystallinity and hydrophilic–lipophilic balance of stearic acid and stearic acid–capric/caprylic triglyceride matrices for production of stable nanoparticles. Colloids and Surfaces B: Biointerfaces 2011; 86: 125-130.
16. Sala S, Elizondo E, Moreno E, Calvet T, Cuevas-Diarte M, Ventosa N, Veciana J: Kinetically driven crystallization of a pure polymorphic phase of Stearic Acid from CO2-expanded solutions. Crystal Growth Design 2010; 10: 1226-1232.
17. Ramtekek H, Joshi S.A, Dhole S.N: Solid Lipid Nanoparticle: A Review. IOSR Journal of Pharmacy 2012; 2: 34-44.
18. Campardelli R, Cherain M, Perfetti C, Ioriob C, Scognamiglio M, Reverchon E, DellaPorta G: Lipid nanoparticles production by supercritical fluid assisted emulsion–diffusion. Journal of Supercritical Fluids 2013; 82: 34-40.
19. Mueller R.H, MaederK, Gohla S: Solid lipid nanoparticles (SLN) for controlled drug delivery: a review of the state of the art. European Journal of Pharmaceutics and Biopharmaceutics 2000; 50:161-177.
20. Ekambaram P, HasanSathali A, Priyanka K: Solid Lipid Nanoparticle: A Review. Science Reviews Chemistry Community 2012; 2: 80 - 102.
21. Guan B, Han B, Yan H: Solubility of stearic acid in supercritical CO2,-acetic acid and CO2-n-octane mixtures at 308.15 K. Journal of Supercritical Fluids 1998; 12:123- 128.
22. Can M, Jie L, Bu-Xing H, Hai-Ke Y: Solubility of stearic acid in supercritical CO2 acetonitrile mixture. Chinese Journal of chemistry 1999; 17.
23. Chia Huang C, Tang M, Tao1W.H, Chen Y.P: Calculation of the solid solubilities in supercritical carbon dioxide using a modified mixing model. Fluid Phase Equilibria 2001; 179:67-84.
24. Garlapati C, Madras G: Solubilities of palmitic and stearic fatty acids in supercritical carbon dioxide. Journal Chemistry Thermodynamics 2010; 42: 193-197.
25. Keshavarz A, Karimi-sabet J, Fattahi A, Golzary A.A, Rafiee-Tehrani M, Dorkoosh F.A: Preparation and characterization of Raloxifene nanoparticles using rapid expansion of supercritical solution (RESS). Journal of Supercritical Fluids 2012; 63:169-179.
26. Bristow S, Shekunov B.Y, and York P: Solubility analysis of drug compounds in supercritical carbon dioxide using static and dynamic extraction systems. Industrial and Engineering Chemistry Research 2001; 40:1732- 1739.
27. Karimi-sabet J, Ghotbi C, Dorkoosh F, Striolo A, Solubilities of Acetaminophen in supercritical carbon dioxide with and without menthol cosolvent: measurement and correlation. Scientia Iranica, Transactions C 2013. In press.
29. Atila C, Yildiz N, alimli A.C: Particle size design of Digitoxin in supercritical fluids. Journal of Supercritical Fluids 2010; 51:3, 404-411.
30. Turk M, Lietzow R: Formation and stabilization of submicron particles via rapid expansion processes. Journal of Supercritical Fluids 2008; 45:346-355. 31. Turk M, Bolten D: Formation of submicron poorly
water-soluble drugs by rapid expansion of supercritical solution (RESS): Results for Naproxen. Journal of Supercritical Fluids 2010; 55:778-785.
32. Monirozzaman M, Sundararajan P.R: Morphology of blend of self-assembling long chain Carbamate and stearic acid. Pure Application Chemistry 2004; 76: 1356-1363.
33. Garti N, Wellner E and Sarig S: Stearic acid polymorphs in correlation with crystallization conditions and solvents. Kirstal and technik 1980; 15: 1303-1310.
34. Bailey A.V, Mitcham D, Pitmman R.A, Sumerll G, Fatty acid polymorph identification by Infrared. Journal of the American Oil Chemists Society 1972; 49: 419-421.
35. Pawara A, RenChen D, Venkataraman C: Influence of precursor solvent properties on matrix crystallinity and drug release rates from nanoparticle aerosol lipid matrices. International Journal of Pharmaceutics 2012; 430: 228–237.
36. Marilene D.M, Ribeiro M, Arellano D.B, Ferreira Grosso C.R : The effect of adding oleic acid in the production of stearic acid lipid microparticles with a hydrophilic core by a spray-cooling process. Food Research International 2012; 47:38–44
37. Sari A, Akcay M, Soylak M, Onal A: Polymer- stearic acid blends as form stable phase change material for thermal energy storage. Journal of Scientific & Industrial Research 2005; 6: 991-996.
All © 2013 are reserved by International Journal of Pharmaceutical Sciences and Research. This Journal licensed under a Creative Commons Attribution-NonCommercial-ShareAlike 3.0 Unported License
This article can be downloaded to ANDROID OS based mobile. Scan QR Code using Code/Bar Scanner from your mobile. (Scanners are available on Google Playstore)
How to cite this article: