http://dx.doi.org/10.4236/jsip.2015.63020
P-Wave Detection Combining Entropic
Criterion and Wavelet Transform
Sawsan Rekik, Noureddinne Ellouze
Department of Electric Engineering, National School of Engineering of Tunis, Tunis, Tunisia
Email: [email protected], [email protected]
Received 2 June 2015; accepted 17 July 2015; published 21 July 2015
Copyright © 2015 by authors and Scientific Research Publishing Inc.
This work is licensed under the Creative Commons Attribution International License (CC BY).
http://creativecommons.org/licenses/by/4.0/
Abstract
The objective of this paper is to develop an efficient P wave detection method in electrocardio-gram (ECG) using the local entropy criterion (EC) and wavelet transform (WT) modulus maxima. The detection of P wave relates to the diagnosis of many heart diseases and it is also a difficult point during the ECG signal detection. Determining the position of a P-wave is complicated due to the low amplitude, the ambiguous and changing form of the complex. In a first step, QRS complex-es are detected using the pan-Tompkins method. Then, we look for the bcomplex-est position of the analy-sis window and the value of the most appropriate width to the P wave. Finally, the determination of P wave peaks, as well as their onsets and offsets. The method has been validated using ECG-re- cordings with a wide variety of P-wave morphologies from MIT-BIH Arrhythmia and QT database. The P-wave method obtains a sensitivity of 99.87% and a positive predictivity of 98.04% over the MIT-BIH Arrhythmia, while for the QT, sensitivity and predictivity over 99.8% are attained.
Keywords
ECG, P-Wave, Entropy, Wavelet Transform, Modulus Maxima
1. Introduction
segment of the ECG.
The P wave is caused by atrial depolarization. The duration is normally not greater than 120 ms. The normal shape of the P wave does not include any notches or peaks. It can be positive, negative, or biphasic in the re-maining leads. An absent P wave in the ECG may signify sinoatrial block [1]. Some researchers present some P wave detection method based on wavelet transform [2]. Wavelet analysis provides important information about the mathematical morphology of a signal. Using this method, it is possible to describe the characteristic ele-ments of a complex quasi-periodic signal. But P wave’s amplitude is much smaller than other waves, so the ac-curacy of detection is limited.
We present here a new method for P wave’s location combines entropic criterion and wavelets transform (ECWT). We are interested in entropy as a measure of the amount of information contained in a signal. The amount of information can also be interpreted as the unpredictability of events in a signal. More events are un-predictable, the more information it contains is important and its entropy is high. This measure is favorable to the segmentation or an unpredictable event will be proportional to the increase in entropy. The entropic criterion can indicate the maximum of P wave’s energy.
The wavelet transform provides a description of the signal in the time-scale domain, allowing the representa-tion of the temporal features of a signal at different resolurepresenta-tions; therefore, it is a suitable tool to analyze the ECG signal, which is characterized by a cyclic occurrence of patterns with different frequency content (QRS com-plexes, P and T waves). Moreover, the noise and artifacts affecting the ECG signal also appear at different fre-quency bands, thus having different contribution at the various scales.
For the singularity detection through local maxima, we rely on the approach Mallet and Hwang [3], using a first derivative Gaussian function as the prototype wavelet. The principle of this approach is, firstly, to use the entropy function for identifying the concentrated energy of the P wave and on the other hand to link the result with that of the modulus maxima allowing an exact location.
The paper is organized as follows: in Section 2, we present the theory of entropic local criterion and the no-tion of wavelets transforms modulus maxima. We show the detecno-tion method of P wave. Onsets and ends are performed in Section 3. Then, we interpret the results of P wave detection. The results of the validation on two databases (MIT-BIH, QT) and their comparison to other algorithms are given in Section 4. Finally, the conclu-sion is presented in Section 5.
2. Entropy and Wavelet Transform Modulus Maxima
This article proposes a method combining entropic criterion and Wavelet Transform Modulus Maxima to detect P wave. The two theories are introduced in the following.
2.1. Entropic Local Criterion
In the case of the representation of the signal, entropy comes to measuring the fineness and precision of the lo-cation information, lolo-cation in both time and frequency. Entropy will allow us to see where the energy signal is localized in the time-frequency plane. Specifically, it will allow us to know what time-frequency representation allows the best location information in the plan. The entropy associated with a discrete scalar random variable with X achievements
{
x1,,xN}
and the probability distribution{
p1,,pN}
measures its mess [4]. It is de-fined by:[ ]
1 ln N k k kH X p p
=
= −
∑
, with1 1 N k k p = =
∑
(1)Since entropy operator will be applied to a channel signal
{ }
x n[ ]
,n∈[
0,N−1]
, it has implicitly been norma- lized to 1, so that:[ ]
1 2 0 1 N k X k − = =∑
, where[ ]
[ ]
1 1
2 2
0 0
N N
k n
X k x n
− −
= =
=
∑
∑
(2)[ ]
1[ ]
2π0
1
e n
N i k
N
k
X k x k
N
− −
=
=
∑
⋅ (3)For any signal
{ }
x n[ ]
,n∈[
0,N−1]
, the entropy in the sense of the energy distribution of frequencies is legi- timate with the following definition:[ ]
( )
[ ]
[ ]
2 2 1 0, 1 0 log N N kX k X k
H x
υ
υ
− − = = ⋅ ∑
(4)where
[ ]
1 2 0 N n x n υ − = =∑
2.2. Wavelet Transform Modulus Maxima
Most of the information in a signal is carried by its irregular structures and its transient phenomena, called sin-gularities. A method that excels in finding and identifying these singularities is the Wavelet Transform; because of its capability of decomposing a signal into elementary building blocks that are well localized in both time and frequency. Because of this capability, the Wavelet Transform is capable of defining the local regularity of a sig-nal. The local regularity of a function is often measured with the Lipschitz exponents [5], also called the Hölder exponent. We define what we mean by a local maximum of the wavelet transform modulus [3]. Let Wf(x) is the wavelet transform of a function f(x)
• We note a local extremum any point x0 such that
( )
(
)
d
d Wf x
x has a zero crossing at x = x0, when x varies.
• We note a modulus maximum; any point x0 such that Wf x
( )
<Wf x( )
0 when x belongs to either a right orleft neighborhood of x0, and Wf x
( )
≤Wf x( )
0 when x belongs to the other side of the neighborhood of x0.• We call maxima line, any connected curve in the scale space x along which all points are modulus maxima.
3. P-Wave Detection
Based on the waveform, Laurent Clavier [6] divide the different P waves encountered in five classes.
• Class 1: the P wave has a relatively symmetrical reflecting normal patient.
• Class 2: P wave has a normal climb, but relatively slow down.
• Class 3: the P wave has a relatively slow rise but a normal descent.
• Class 4: the P wave has a double hump.
• Class 5: P wave is biphasic; usually it is a pathological wave.
3.1. P-Peak Detection
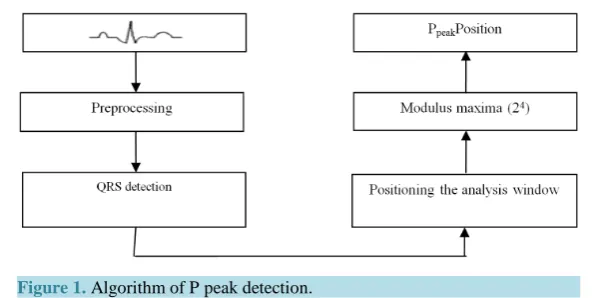
The detection algorithm of P wave is generally designed according to three steps (Figure 1).
The first is based on a preliminary localization of the QRS complex and consists in seeking, in a window pre-ceding the QRS, a trace of the P wave. The second step is based on the research for an analysis window well adapted to the width and to the position of the P wave by means of the local entropy criterion which measures the temporal unpredictability and disorder in the frequency signals and is an index for the segmentation. As part of the segmentation, the entropy changes reflect the presence of a change in the signal. The entropy is going to help us to adopt the width of the window to that of the P wave. In this case, our research becomes more efficient and more objective. By the way, we will gain in computing time for the next step of this method. We succeed and optimization the algorithm. The third is based on the detection of the P wave by modulus maxim’s method.
3.1.1. Step 1
Figure 1. Algorithm of P peak detection.
good filtering [7]. We apply a band pass filter [8] to eliminate the noises caused by the breathing, the move-ments of muscles and the baseline. This filter is constituted by the combination of a passes low filter and another passes loud. The two are based on a sampling rate of 360 Hz [9].
In general, the normal ECG rhythm means that there is a regular rhythm and waveform. However, the ECG rhythm of the patient with arrhythmia will not be regular in certain QRS complexes. We use the different cha-racteristics that arrhythmias exhibit to detect the abnormal ECG waveform. We first need to find the location of every QRS complex.
The locations of QRS complex have the maximum variation in the slopes. This property was used to detect the location of QRS complex. The method of Pan-Tompkins was adopted to detect the QRS complex [10]. The Pan and Tompkins QRS detection algorithm identifies the QRS complexes based upon digital analysis of slope, amplitude, and width of the ECG data. The algorithm implements a special digital band pass filter. It can reduce false detection caused by the various types of interference present in the ECG signal.
3.1.2. Step 2
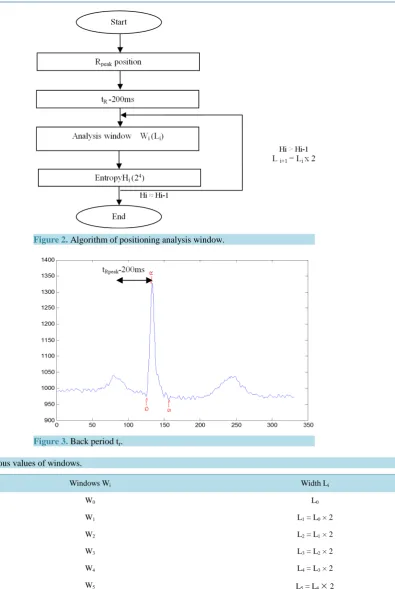
The P wave is a rounded peak occurred before the QRS complex. Therefore, the P wave can be found based on the location of the QRS complex. The method consists in finding the right and better position of the analysis window (Figure 2).
The detection algorithm P-wave refers to the R peak backwards tr (tRpeak-200 ms) so as to be in advance
phase by report to the QRS complex (Figure 3).
tr depends on the RR period in 5 seconds. Statistically, over a period for many patients and healthy on a
re-cording time of one hour for each, P wave holds 10%, the QRS complex occupies 8% and the T wave occupies 20% of the RR period. The choice of the window is taken of such way as the energy in the side of lobes being as small as possible to minimize the errors in the entropy and increase the accuracy of positional. We perform the decomposition of the ECG signal for 4 levels (21, 22, 23 and 24) in which his higher energy is. For scales larger than 24, the energy of the QRS complex is very low, only the P and T waves have significant components.
The detection of the P wave is based on the variations in local entropy rather than the entropy itself. It uses the local entropy criterion. Entropic Local Criterion is a time function, measuring variations in the energy con-centration of the short-term spectrum of the signal. The measurement of concon-centration of energy or spectral dis-order is used Shannon [11] entropy (Equation (1)). Due to significant changes in this measure in the context of the one part and the position of the analyzed frequencies, we add to this extent the notion of stability. In this case, we talk about the criterion entropic local stabilized
We set the first Wi analysis window, which Li its width, from tr. For that, we calculate the normalized and
localized entropy of analysis window Wi (Li) for 24 scale according to the Equation (4). The value of entropy Hi
calculated through the Wi window is saved in a table.
The search for the best width of the window operates according to an iterative algorithm. In every iteration the width of the window is multiply by 2 (Li × 2) to look for the maximum of quantity of information contained in
the wave P. The same steps are applied on the next analysis window Wi+1 with Li+1 = Li × 2. So, we create an
in-creasing dyadic table for the window’s various values (Table 1).
Figure 2.Algorithm of positioning analysis window.
Figure 3.Back period tr.
Table 1. Various values of windows.
Windows Wi Width Li
W0 L0
W1 L1 = L0 × 2
W2 L2 = L1 × 2
W3 L3 = L2 × 2
W4 L4 = L3 × 2
W5 L5 = L4
×
2width.
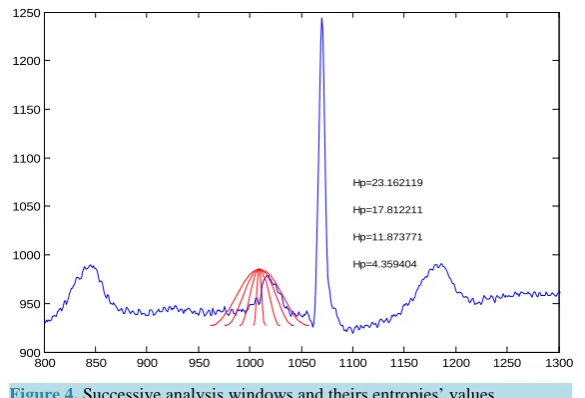
Figure 4 shows three successive analyzes of windows (W0, W1, W2, W3) showing the growth of their width.
[image:5.595.173.455.86.308.2]Figure 4.Successive analysis windows and theirs entropies’ values.
detection of the information is more and more centralized on the P wave.
3.1.3. Step 3
At this level of the algorithm, we have a window (Wn) adapted in width and in position to the P wave. Once the
analysis window is fixed, we calculate the modulus maxima for the 24 scale to detect the position of the P peak applied to the Wn. Mainly at scales 2
4
, P wave has its major component, whereas artifacts produce isolated maximum or minimum lines which can be easily discarded. If the signal is contaminated with high-frequency noise, the most affected scales are and, being higher scales essentially immune to this sort of noise.
Using a first derivative Gaussian function as mother wavelet due to having one zero moment. It is therefore well adapted to detect the amplitude discontinuities in the signal; it delivers more to the spread of the maximum fine scales [12]. It is defines as follows
( )
1 423 2 22exp , with 0.25
π 2
t
t t σ
σ σ
−
Ψ = − =
(5)
The waves produce a positive maximum-negative minimum pair along the scales, with a zero crossing be-tween them. Each sharp change in the signal is associated to a line of maxima or minima across the scales. The passages by zero or zeros-crossings of the wavelet transform correspond in maxima premises or minima of the signal smoothed in the various scales and the maximal absolute values of the transformed it waves are associated with the maximal slopes. Using the information of local maxima, minima and zero crossings at 24 scales, the al-gorithm identifies the significant points P wave detection and delineation.
3.2. Onset/Offset Detection
Our detection method of P wave is also responsible for detecting Pon/Poff which is the start and end of the P
waves. Our algorithm comprises two steps defined as follows (Figure 5), the beginning and the end of the P wave is determined based on the detection of Ppeak.
The onset of P wave is before the first slope of the position of P peak. In the same way, the offset of P wave is after the last slope of the position of P peak. We calculate the modulus maxima of the (first/last) slope of the P peak’s position for the 24 scale. We considered the modulus maxima calculated for the analysis window Wn
al-ready attached to the P peak search step.
4. The ECWT Method Results and Performance
The ECG signals under test of the transformations are taken from the website of MIT-BIH Arrhythmia Database
[13]. The sampling frequency of the data is 360 Hz. We will discuss certain parts of signals chosen.
800 850 900 950 1000 1050 1100 1150 1200 1250 1300 900
950 1000 1050 1100 1150 1200 1250
Figure 5.Successive analysis windows and theirs entropies’ values.
4.1. Baseline Drift
The ECWT based method only considers variations of the signal that has a certain resemblance with the P-wave. Therefore, it is insensitive to baseline drift (Figure 6).
4.2. Noise (EMG)
Most methods require frequently adapted thresholds in order to detect a low amplitude P-wave. In most cases these thresholds are used to distinguish the wave from the noise. By using scales that contain most part of the energy of the P-wave it is possible to acquire a precise detection (seeFigure 7).
4.3. Low Amplitude
Most methods require frequently adapted thresholds in order to detect a low amplitude P-wave. In most cases these thresholds are used to distinguish the wave from the noise(Figure 8). By using scales that contain most part of the energy of the P-wave it is possible to acquire a precise detection.
4.4. Ambiguous Amplitude
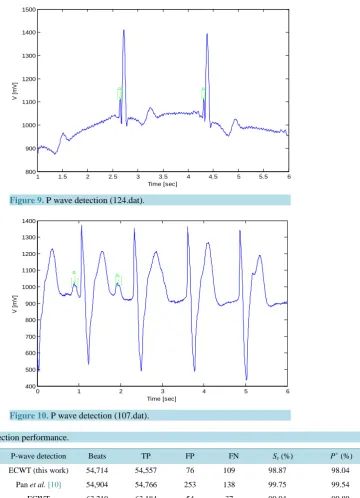
As most methods, the ECWT method uses certain decision rules to distingue different kinds of P-waves. The difference with the other methods lies in the fact that the rules are applied to the transformation instead of to the pure signal. The transformation gives a clearer view of the signals information and therefore it is better suited for decision rules (Figure 9).
4.5. Absent Wave
In some cases, the P-wave is absent. The figure below illustrates the case where the P wave is present with an important amplitude in start of signal but absent after (Figure 10).
4.6. P-Wave Performance
The datasets are signals coming from the MIT-BIH Arrhythmia Database [13] and QT Database [14]. However not every long signal contains large amounts of useful information. When there is no change in a wave through- out the whole signal, it is not useful to analyze every peak. Therefore, only the parts which define the ECG will be discussed. The performance of the methods will be tested by using several cases with certain difficulties. The results are detailed in the table below (Table 2).
• Number of True Positive detections (TP).
• Number of False Positive detections (FP).
• Number of False Negative detections (FN).
• Percentage of detected P-waves (Se).
TP
TP FN
e S =
+ • Percentage of positive predictivity (P+)
TP
TP FP
P+ =
Figure 6.P wave detection (121.dat).
[image:8.595.166.466.75.708.2]Figure 7. Pwave detection (232.dat).
Figure 8.P wave detection (200.dat).
1 1.5 2 2.5 3 3.5 4 4.5 5 5.5 6
800 850 900 950 1000 1050 1100
Time [sec]
V [
m
V]
<
--- P
<
--- P
<
--- P
---0 1 2 3 4 5 6
900 950 1000 1050 1100 1150
Time [sec]
V [
m
V] <
--- P
<
--- P
<
--- P
--- --- --- --- ---
---2 2.5 3 3.5 4 4.5 5 5.5 6
850 900 950 1000 1050 1100 1150 1200 1250 1300
Time [sec]
V [
m
V]
<
--- P
<
--- P
<
--- P
<
--- P
---
---
---Figure 9.P wave detection (124.dat).
Figure 10. P wave detection (107.dat).
Table 2. P wave detection performance.
Database P-wave detection Beats TP FP FN Se (%) P+ (%)
MITBIH ECWT (this work) 54,714 54,557 76 109 98.87 98.04
Pan et al. [10] 54,904 54,766 253 138 99.75 99.54
QT ECWT 63,210 63,184 54 37 99.94 99.89
Martinez et al. [15] 64,387 64,395 57 41 99.92 99.88
The detection results on the MITDB and QTDB obtained by our ECWT of P detection and other published detectors are given inTable 2. Our algorithm does not need any learning period. The proposed ECWT detection algorithm achieves very good detection performance on the two studied databases. This algorithm attains Se =
98.87% and P+ = 98.04% for the MITDB. On QTDB, our algorithm presents a positive predictivity (P+) about 99.89% and sensitivity (Se) about 99.94%.
5. Conclusions
We have presented in this paper a new method for P wave’s locations using the local entropic criterion, in order
1 1.5 2 2.5 3 3.5 4 4.5 5 5.5 6
800 900 1000 1100 1200 1300 1400 1500
Time [sec]
V [
m
V]
<
--- P <--- P
--- --- ---
---0 1 2 3 4 5 6
400 500 600 700 800 900 1000 1100 1200 1300 1400
Time [sec]
V [
m
V]
<
--- P
<
--- P
---
[image:9.595.88.537.529.601.2]---to focus on the maximum of P wave’s energy, and wavelet transform over some successive scales. The algo-rithm has been validated using two standards databases MIT-BIH Arrhythmia and QT, with different sampling rates and a wide diversity for P wave forms.
Our method achieves very good detection performance on the two studied databases. This algorithm attains Se =
98.87% and P+ = 98.04% for the MITDB. On QTDB, it presents a positive predictivity (P+) about 99.89% and sensitivity (Se) about 99.94%.
References
[1] Le Page, R. and Boucher, J. (2001) Détection et Analyse de l’Onde P d’Un Electrocardiogramme. Colloque GRETSI’01, France.
[2] Li, C., Zheng, C. and Tai, C. (1995) Detection of ECG Characteristic Points Using Wavelet Transform. IEEE Transac-tions on Biomedical Engineering, 42, 21-28. http://dx.doi.org/10.1109/10.362922
[3] Mallat, S. and Hwang, W.L. (1992) Singularity Detection and Processing with Wavelets. IEEE Transactions on Infor-mation Theory, 38, 617-643. http://dx.doi.org/10.1109/18.119727
[4] Djafari, M. (1998) Entropy in Signal Processing. Laboratory of Signal and System CNRS-SUPELEC-UPS, 15, 541- 551.
[5] Mallat, S. (1991) Zero-Crossings of a Wavelet Transform. IEEE Transactions on Information Theory, 37, 1019-1033. http://dx.doi.org/10.1109/18.86995
[6] Clavier, L. (1997) Analyse du signal électrocardiographique en vue du dépistage de la fibrillation auriculaire. Thèse de l’Université de Rennes I.
[7] McNames, J. (2005) Optimal Rate Filters for Biomedical Point Processes.27th Annual International Conference of the Engineering in Medicine and Biology Society, Shanghai, 17-18 January 2006, 145-148.
http://dx.doi.org/10.1109/iembs.2005.1616363
[8] Belgacem, N., Chikh, M. and Reguig, F. (2003) Détection et Identification des Arythmies Cardiaques Par Application des Réseaux de Neurones. Conférence Internationale sur les Systèmes de Télécommunications d’Electronique Médi-cale et d’Automatique CISTEMA, Tlemcen, 27-29 September 2003, 236-239.
[9] Khelil, B., Kachouri, A. and Ben Messaoud, M. (2006) Nouvelle Tendance Technologiques en Génie Electrique et In-formatique. Springer, New York.
[10] Pan, J. and Tompkins, W. (1985) A Real Time QRS Detection Algorithm. IEEE Transactions on Biomedical Engi- neering, 32, 230-236. http://dx.doi.org/10.1109/TBME.1985.325532
[11] Shannon, C. and Weaver, W. (1948) The Mathematical Theory of Communication. Bell System Technical Journal, 27, 379-423, 623-656. http://dx.doi.org/10.1002/j.1538-7305.1948.tb00917.x
[12] Mallat, S. and Zhong, S. (1992) Characterization of Signals from Multiscale Edge. IEEE Transactions on Pattern Analysis and Machine Intelligence, 14, 710-732. http://dx.doi.org/10.1109/34.142909
[13] Moody, G.B. and Mark, R.G. (2001) The Impact of the MIT-BIH Arrhythmia Database. IEEE Engineering in Medi-cine and Biology Magazine, 20, 45-50. http://dx.doi.org/10.1109/51.932724
[14] QT ECG Database (1997) Massachusetts Institute of Technology. http://www.physionet.org/physiobank/database/qtdb