Research Article
Big Data Visualization Collaborative Filtering Algorithm
Based on RHadoop
Lijun Cai, Xiangqing Guan, Peng Chi, Lei Chen, and Jianting Luo
Information Science and Engineering, Hunan University, Changsha, Hunan 410082, China Correspondence should be addressed to Peng Chi; [email protected]Received 20 August 2014; Accepted 6 October 2014 Academic Editor: Yu Gu
Copyright © 2015 Lijun Cai et al. This is an open access article distributed under the Creative Commons Attribution License, which permits unrestricted use, distribution, and reproduction in any medium, provided the original work is properly cited.
With the rapid growth of various data, it is becoming increasingly important to extract useful information from big data. While the analysis tools of big data visualization is very rare, in this paper, we propose a new big data visualization algorithm analysis integrated model. The model integrates the processing of big data and the visualization of data as a whole. It is a good analysis tool of timely big data visualization. We use hadoop 1.X as the data storage and use R as the compiler environment in the model. If you are skilled in R, it is easy to design kinds of paralleling algorithms, and analyze and process the kinds of big data. Secondly we design and implement a paralleled collaborative filtering algorithm with the model. Finally we analyze the various performance indicators with kinds of experiments. The indicators show that the model has good scalability and easy operability, and contains all the advantages of Map Reduce. In conclusion, the big data visualization algorithm analysis integrated model has high performance to process and visualize the big data.
1. Introduction
1.1. Motivation and Problem Statement. With data generated rapidly by the Internet and bioinformatics and sensors and so on, the data visualization and the big data with distributed processing have become a more popular topic today. At the same time, the analysis of big data, particularly mining valuable information from big data, and the data visualization with a very good tool are the research trend in the big data and visualization field. However, the kind of product, which is combined by the big data processing framework and visualization tools, is rare. In the information age, all kinds of data are just like natural resources, and the demand for the product becomes more imminent.
As is well known, the concept of precision marketing [1– 3], which recommends the interested product to the users and improves the user experience when people buy something in
the Online Shopping Mall [1,2,4], especially the personalized
recommendation [5–7], is more and more important in the electronic commerce and the information system domain. Because the accurate personalized recommendation can bring huge economic benefits for E-business at the same time [7]. But the electronic commerce data is so big, while the
algorithm’s design of the recommendation systems is facing more and more challenges with the ZB or PB data in the electronic commerce business [8].
In this paper, we aim to design a big data visualization algorithm analysis model based on RHadoop. The model includes two parts, the first part is used as big data storage and processing, the second part is used as algorithm’s design and analysis. The details are shown in the III part. On the other hand, we design and implement a new collaborative filtering algorithm using the model. Afterwards through a large num-ber of experiments, this new thought, in which we design the big data visualization algorithm analysis integrated model, solves properly the poor scalability bottleneck problem of the collaborative filtering algorithm and adds to the divine one pen for the big data analysis and visualization.
1.2. Limitation of Prior Art. There are two major limitations of the big data analysis and visualization. Big data processing tools can process ZB and PB data quite naturally but it cannot analyze and visualize the ZB and PB data. On the contrary, the data visualization tools can analyze and visualize all kinds of data but it cannot process ZB and PB data. At present, big data processing tools include Hadoop, High Performance
Volume 2015, Article ID 271253, 9 pages http://dx.doi.org/10.1155/2015/271253
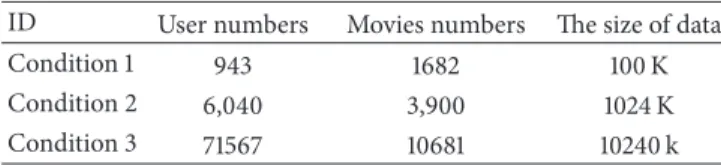
Table 1: Experimental data information table.
ID User numbers Movies numbers The size of data
Condition 1 943 1682 100 K
Condition 2 6,040 3,900 1024 K
Condition 3 71567 10681 10240 k
Computing and Communications, Storm, Apache Drill, RapidMiner, and Pentaho BI [9–11]. And data visualization tools include NodeBox, R, Weka, Gephi, Google Chart API,
Flot, Rapha¨el, D3, and Visual.ly, [9,12].
1.3. Our Approach. In this paper, we propose a big data visu-alization algorithm analysis integrated model. The integrated model can process ZB and PB data naturally, and then it can analyze the data, and finally it can show the valuable result with visualization picture. The integrated model is suitable for the design of parallel algorithm with ZB and PB data. Particularly, it is very convenient for data analysis of scientists, who use R skillfully. Because we use Hadoop to store the big data, use MapReduce to process the big data, use R as the analysis and visualization the data in the integrated model. Moreover, we design and implement a new collaborative filtering algorithm using the model.
1.4. Summary of Experimental Results. We use nine machines as the hardware server, and install operator system with the Red Hat Enterprise Linux Server6.4 in those servers. Simi-larly, we deploy the distributed cluster with the Hadoop 1.2.1 and R3.0.2 as the compiler environment and configure a serial of file with kinds of component. We use a large real world data set from the Group Lens Research Project, through horizontal dimension and vertical dimension to show our results. At horizontal dimension, we use the standalone mode and cluster mode to test the new collaborative filtering algorithm based our integrated model. The experimental data are shown
in the Table1. The experimental results are shown in Figure10.
From Figure10, as the growth of the data, it is shown that the
speed of the cluster mode is faster than the standalone mode. At vertical dimension, we use the cluster mode, with different data nodes, and test the new collaborative filtering algorithm. The result shows that with the data nodes increasing, the time consumed linearly. The indicators show that the model has good scalability and easy operability and contains all the advantages of Map Reduce.
1.5. Key Contributions. We make three key contributions in this paper as follows.
(1) We propose a big data visualization algorithm analysis integrated model.
(2) We design a paralleled collaborative filtering algo-rithm with the big data visualization algoalgo-rithm anal-ysis integrated model.
(3) We implement the paralleled collaborative filtering algorithm with the big data visualization algorithm analysis integrated model.
2. Related Work
2.1. The Development of Hadoop and R. Hadoop is a
distrib-uted system framework [9, 11,13]; the initial design idea is
mainly used to deploy on the cheap hardware. The framework implements a distributed file system, referred to as “HDFS,” which has high fault tolerance and high speed and scalability to store large amounts of data and implements a computation model of parallel processing large data sets; this model is of high speed computing in big data processing field. In addi-tion to these advantages, the distributed system framework is open source software. With the advent of big data, it is becoming a good technical solution, which can process and store big data, for IT company. While currently it has become a big data processing framework in the field of the big data domain, at the same time, Hadoop ecosystem, with contin-uous improvement and optimization, is becoming more and more large and perfect. In the Hadoop ecosystem, Hive data warehouse software facilitates querying and managing large datasets residing in distributed storage. Pig is a platform for analyzing large data sets that consists of a high-level language for expressing data analysis programs, coupled with infras-tructure for evaluating these programs. HBase is the Hadoop database, a distributed, scalable, big data store. Sqoop is a tool designed for efficiently transferring bulk data between Apache Hadoop and structured data stores such as relational databases. ZooKeeper is an effort to develop and maintain an open-source server which enables highly reliable distributed coordination. Mahout project’s goal is to build a scalable machine learning library. Avro is a data serialization system. Ambari project is aimed at making Hadoop management simpler by developing software for provisioning, managing, and monitoring Apache Hadoop clusters. Chukwa is an open source data collection system for monitoring large distributed systems. However in order to improve the performance of the distributed system framework, many companies and supporters provide their first-class good components and high performance code for Hadoop, such as YARN, Hcatalog, Oozie, and Cassandra [9], which make the performance of Hadoop become more and more strong, and the application field of Hadoop is becoming more and more wide.
R language [12], as a data analysis and visualization tool, is widely used for statistical analysis, drawing, data mining, machine learning, and visualization analysis. Particularly, R tool has been built in a variety of statistical and digital analysis functions and drawing functions; furthermore R language is an open source software, and massive third-party packages which are written by the users around the world can be down-loaded freely. Therefore, its application field is wide, such as being used for statistical analysis, applied mathematics, econometrics, financial analysis, financial analysis, human science, data mining, artificial intelligence, bioinformatics, biomedical, global geographical science, and data visualiza-tion.
2.2. Parallel Computing Theory of Big Data Processing. Since the birth of the computer, it is an immortal topic to improve the computing performance and the processing speed of the
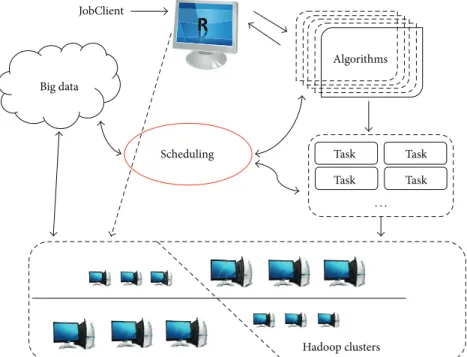
Scheduling Hadoop clusters Task Task Task Task JobClient Algorithms Big data · · ·
Figure 1: The big data visualization algorithm analysis integrated model.
physical devices, parallel computing is more and more famous and has become a comprehensive computer science. The discipline includes the hardware concurrent design technology and software concurrent design technology [15]. According to the hardware concurrent design from computer, hardware architecture can be divided into (1) single instruc-tion stream and data stream (SISD); (2) single instrucinstruc-tion multiple data (SIMD) flows; (3) multiple instruction stream data flow (MISD); (4) the instruction stream and data stream (MIMD). However the software concurrent design mainly includes the algorithm of concurrent design, high-speed internet clustering framework, and high-efficiency concur-rent calculation model. Hardware concurconcur-rent design is skilled in numerical analysis and the floating point precision but will face a technical bottleneck in large-scale data, especially, in the unstructured data, while the software concurrent design, which includes parallel computing model and cluster system design, will be very good to make up for the defects above.
For example, cluster system is constituted with the work-station or PC, which is linked by high-speed network with a certain optimizing structure, with unified dispatching visual human-computer interface, and efficient parallel processing system. Those cluster systems have the good expansibility, the good programming model, and the system development
cycle is little short [7,8,11]. While with the rapid development
of efficient communication mechanism, the cluster system is becoming more and more popular, now the kind of cluster system is a good solution to process the unstructured big data. Hadoop is one of the most popular cluster systems, which includes the high-performance calculation model Map Reduce and Spark.
3. System Model and Problem Statement
3.1. System Model. We integrate the advantage of Hadoop and R, respectively, and design the big data visualization
algorithm analysis model. Processing and analysis of big data makes the original impossible possible with the big data visualization algorithm analysis model. In the system Model, people can easily implement parallel algorithms using R and can use ZB and PB data to analyze and visualize. In this way, the statistician must first conduct the sample extraction, hypothesis testing and various regression calculations, when analyzing and processing the large data. But now statistician can complete mathematical analysis with the total big data
based on the system Model. Figure1shows the whole process
of the system integrated model.
In this system Model, we use Hadoop Distributed File Systems to store big data, use MapReduce calculation model to implement distributed computation, and use R to control the algorithm and data streaming. While people, who are skilled in using R, can easily use the system Model to imple-ment kinds of parallel algorithms with R, the system model has three divisions; the first part is the client; people can use the Client to control and monitor the data streaming. The second part is the design of parallel algorithms, in which people can use R to program their own thought and idea. The third part is the storage of big data with the Distributed File Systems. Through this new perspective, it is of great practical significance, with large-scale data storage and data processing and data analysis as and data visualization a whole, to process the big data and analysis.
3.2. Algorithm Model. Algorithm model is the most flexible portion in our big data visualization algorithm analysis integrated model. People can program kinds of parallel algo-rithms with their thoughts based our system model, the only requirement that the parties understand the theory of Map-Reduce, While they do not need to care about the data
pro-cessing details. Figure2shows the finer details. The algorithm
Scheduling Kinds of algorithms
DAG
Task Task Task
Hadoop clusters Programming Calculation model · · · · · ·
Figure 2: The architecture of kinds of algorithms.
layer; people can program kinds of algorithms. The middle and bottom parts are the processing and analysis layers; people can control the data streaming with the application layer through kinds of algorithms. In the next sections, we design a paralleled collaborative filtering algorithm with the algorithm model. The experimental results can show the algorithm model’s advantages. The sixth part of Experimental Results explains the details.
3.3. Design Analysis. In this paper, the main characteristic of the big data visualization algorithm analysis integrated model can implement parallel algorithms easily. This is also the focus of this paper. As we all know, many algorithms are only cal-culated on a single computer basically. When the quantities of data reach a certain level, the performance of algorithm restricts. In other words, the performance bottleneck appears. Using the big data visualization algorithm analysis integrated model can solve the performance bottleneck, because we use the Distributed File Systems, and the divide-and-conquer
logical thought, to process the problem. As shown in Figure3.
In the image on the left you can see the traditional stand-alone processing data model, while on the right you can see the extended parallel processing model. The paper is also using the extended parallel processing model to process and analyze the big data.
4. Algorithm Design and Implementations
4.1. Algorithm Design. In this section, we design and imple-ment the collaborative filtering algorithm based on our design’s model. The primal collaborative filtering algorithm can only calculate in a single computer basically [5–7]. In addition to this characteristic, the primal collaborative filter-ing algorithm also has defectiveness in the high dimensional sparse matrix and the poor scalability, while, through our design, it can be calculated paralleling on the cluster.
This paper proposes the big data visualization algorithm analysis integrated model to solve the above problems. The
Data preprocessing Data
Bottle neck
Data analysis and visualization
Data preprocessing Data
Data analysis and visualization Hadoop cluster
Hadoop cluster · · ·
Figure 3: The traditional stand-alone processing data model (left) and the extended parallel processing model (right).
design of the parallel collaborative filtering algorithm
frame-work is shown in Figure4. There are three parts in the
algo-rithm design. The first part is the Directed Acyclic Graph, short for DAG, including kinds of matrix computation, for example, the kinds of computations which have cooccurrence matrix and rating matrix. We design them as a Directed Acyclic Graph, because they have same correlation in kinds of computation. Only in this way can the parallel collabo-rative filtering algorithm run correctly. After we format the cooccurrence matrix and rating matrix, we can compute the combination of cooccurrence matrix and score matrix. Finally, we can obtain the results of recommendation using the algorithm model.
4.2. Algorithm Implementations. At first, we upload the data to the distributed file system. Then through the data pre-treatment model, convert data into key-value pairs, while we group all users by these formatted key-value pairs; then we use the output data computing the cooccurrence matrix. The
design thought shows Algorithm1. We use a simple example
to explain Algorithm1. For example, there existm items. If a
user like⟨1001, 1003, 1004⟩is three items, we first define
the items asΘ. Through the correlation of the item, in other
words, the mathematical expressionΘ ⋈ Θ, we can obtain the
pairs⟨1001 1001⟩,⟨1003 1003⟩, and⟨1004 1004⟩, and the
pairs⟨1001 1003⟩,⟨1001 1004⟩, and⟨1003 1004⟩. Then we
can calculate the count of the pairs. After that, we can obtain
m∗m cooccurrence goods matrix from all users by such rules.
The previous part of the algorithm design shows that the Directed Acyclic Graph includes the cooccurrence matrix and the rating matrix. The design’s algorithm can run in the distributed file system correctly, because the DAG can control the data’s streaming. The detail of rating matrix algorithm
shows Algorithm 2. In order to explain the algorithm in
a detailed way, we use a sample to elaborate. We continue using the formatted key-value pairs from the distributed
Load data model
Rating matrix model Co-occurrence matrix model Formatting data DAG MAP Combination of co-occurrence matrix and score matrix The results of recommended Recommended item sets Preferences item sets Preferences values Hadoop clusters
Rating matrix model Kinds of algorithms Itema Itemb Itemm Itemx Itemy Itemz Valuex Valuey Valuez
Figure 4: The whole framework of paralleling collaborative filtering algorithm.
(1) Input: HDFS (2) Output:<key,value> (3) Map: (4) keyval(k,v$item) (6) Reduce: (7) m<-merge(v,v) (8) keyval(m$x,m$y) (1) Input:<key,value> (2) Output:<key,value> (3) Map: (4) d<-data.frame(k,v) (5) d2<-ddply(d,.(k,v),count) (6) key<-d2$k (7) val<-d2 (8) keyval(key,val)
Algorithm 1: The combination list and cooccurrence algorithm.
file system. For example, firstly we use C grade for each item on 1001, 1002, 1004 to 3.0, 2.0, and 5.0; then we use
the standard format⟨user ID, project ID, score⟩to format
the data. Therefore the score matrix can be expressed as
⟨C, 1001, 3.0⟩,⟨C, 1002, 2.0⟩, and⟨C, 1004, 5.0⟩. After that, we can compute the score matrix from all users by such rules.
Merging cooccurrence matrix and scoring matrix is a key operation and is also a special step in the entire algorithm, mainly because the output data of score matrix and item cooccurrence matrix are two heterogeneous data sources in the above processing. We use the equijoin function of rmr2 package to process the two heterogeneous data sources
matrix. Algorithm3shows the finer details. In other words,
with the mathematical formula, through the score matrix
⟨item user value⟩and cooccurrence matrix⟨item1 item2
counts⟩, we merge them by taking item as the reference
vari-ables and then get⟨item1 item2 counts item user value⟩
data format. These tips also bring a great help to design the parallel algorithm in the distributed file system.
Through the above design, the last step, we will compute the items’ recommended results.
The design formula is as follows:
A∗B=C (1)
A: cooccurrence matrix, B: the user rating matrix, and C:
the recommended calculation results. The first part of
Algo-rithm 4 shows the details. We calculate the recommended
items through the design formula, while the user score result
list is⟨item1, item2, user, value⟩. In order to display the
better results to the user, we further design, as shown in the
second part of Algorithm4. After that, we can obtain the score
value recommendation list⟨user, item, value⟩.
5. Analysis
In this section, we analyze the complexity and performance of the paralleling collaborative filtering algorithm. The com-plexity analysis focuses on the time consumed and the proportion of time for processing data on different nodes. The performance analysis focuses on the speedup ratios in
(1) Input: HDFS (2) Output:<key,value> (3) Map:
(4) df<-v # the parameter of v is from the key-value pairs in HDFS (5) key<-df$item
(6) val<-data.frame(item=df$item,user=df$user,pref=df$pref)
(7) keyval(key,val) # achieve the key value pair from the above information Algorithm 2: The rating matrix algorithm.
(1) Input:<key,value> (2) Output:<key,value>
(3) Equijoin: # the merged operation of the two matrix (4) left.input=step2.mr,
(5) right.input=train2.mr,
(6) Map.left # achieve the key value pair from the left side (7) keyval(k,v)
(8) Map.right # achieve the key value pair from the right side (9) keyval(k,v)
Algorithm 3: Merging cooccurrence matrix and scoring matrix.
(1) Input:<key,value>
(2) Output:<item1,item2,user,value> (3) Map:
(4) val<-v # the parameter of v is from the key-value pairs in HDFS (5) na<-is.na(v$user.r)
(6) if(length(which(na))>0) (7) val<-v[-which(is.na(v$user.r)),]
(8) keyval(val$k.l,val) # through the value of v$user.r to achieve the key-value (9) Reduce:
(10) val<-ddply(v,.(k.l,v.l,user.r),summarize,v=freq.l∗pref.r)
(11) keyval(val$k.l,val) # through an algorithm to calculate the recommendation list (1) Input:<item1,item2,user,value>
(2) Output:<user,item,value>. (3) Map:
(4) input=cal.mr, # the parameter of cal.mr is the input key-value pairs
(5) keyval(v$user.r,v) # achieve the key-value pairs through the new combinations (6) Reduce:
(7) val<-ddply(v,.(user.r,v.l),summarize,v=sum(v)) (8) val2<-val[order (val$v,decreasing=TRUE),] (9) names(val2)<-c(“user”, “item”, “pref ”)
(10) keyval(val2$user,val2) # achieve the key-value pairs from the above information Algorithm 4: The recommended result list algorithm.
kinds of conditions. For the descriptions of experimental data, please refer to the next section of experiment results.
5.1. Complexity Analysis. Evaluation of parallel algorithm mainly includes the following aspects, for example, the parallel part of the whole algorithm and the speedup ratios with the incremental machines. In this paragraph, we use the Amdahl law to analyze the collaborative filtering algorithm, and then in the next paragraph, we analyze the speedup ratios by experiment. Through the experimental records, we
obtained the experimental data with the pie chart by the original collaborative filtering algorithm. The pie chart is
shown in Figure5.
Then using the improved algorithm, the design of the paralleling collaborative filtering algorithm is shown in
Fig-ure4; we obtained the experimental data with the pie chart by
the improved algorithm. The pie chart is shown in Figure6.
The design of the paralleling collaborative filtering algorithm is more significant by the big data visualization algorithm analysis integrated model.
12% 29% 28% 11% 12% 8%
Time distribution of the original state
Load data Co-occurrence matrix Rating matrix Formatting data Score matrix Recommendations
Figure 5: Time distribution of the original state.
80% 12%
8%
Time distribution of the optimized condition
Directed acyclic graph Score matrix Recommendations
Figure 6: Time distribution of the optimized condition.
5.2. Performance Analysis. In this paragraph, we show supe-riority of the paralleling collaborative filtering algorithm by speedup ratio. In the part of the Complexity Analysis, we refer to Amdahl’s law. In order to analyze the performance, we explain Amdahl’s law in some detail. The law of Amdahl is important in computer science; it defines the upper limit ratio through the acceleration calculation formula and the theoretical with parallel system from serial system.
The defined Ratio is
Ratio= 𝑇0 𝑇1, (2) 3 4 5 6 7 8 9 1 1.21 1.59 1.83 2.8 3.2 4.3 1 2 3 4 5 6 7
The speedup of the condition 1
Nodes number Speedup
Figure 7: The speedup of condition 1.
Nodes number Speedup 3 4 5 6 7 8 9 1 1.23 1.66 1.76 2.32 3.05 4.14 1 2 3 4 5 6 7
The speedup of the condition 2
Figure 8: The speedup of condition 2.
where𝑇0: the time-consuming before the optimization
oper-ation and 𝑇1: the time-consuming after the optimization
operation.
Amdahl’s law gives a formula; the formula shows the rela-tionship between the quantity of processor system and the parallelism of system. There are
Speedup≤ 1
𝐹 + ((1 − 𝐹) /𝑁). (3)
The parameter of 𝐹 indicates the proportion of serial
procedures, the parameter of𝑁indicates the number of
pro-cessors. From the pie chart shown in Figures 5and 6, we
can know that the collaborative filtering algorithm has 80%+ coding which can be concurrent execution. Therefore the speedup is 4+.
We analyze the speedup ratio with three groups of exper-imental data. For the detailed description of experexper-imental data, please refer to the next section of experiment results.
The experimental results are shown in Figures7, 8, and9.
Now we give a detailed description of the experimental results. The blue line represents the nodes number, while the
3 4 5 6 7 8 9 1 1.23 1.71 1.75 2.34 3 3.9 1 2 3 4 5 6 7
The speedup of the condition 3
Nodes number Speedup
Figure 9: The speedup of condition 3.
0 2 4 6 8 10 12 14 16 18
Condition 1 Condition 2 Condition 3 Stand-alone mode of R
Parallel model based on RHadoop
Figure 10: Time comparison of the Stand-alone mode and our design model.
red line represents the speedup ratio. So we can know that the speedup ratio is higher with the incremental node number.
6. Experimental Results
There are nine machines as the hardware server in our experiments. In this hardware server, the operating system platform is used with The Red Hat Enterprise Linux Server6, while Hadoop1.2.1 is our framework version as data stored [10], and the R3.0.2 is taken as the compiler environment. The data source comes from the Group Lens Research Project (http://grouplens.org/datasets/movielens/). Movie Lens data set is divided into three parts. According to the number
0 1 2 3 4 5 6 7 8
Three nodes Five nodes Seven nodes Nine nodes Condition 1
Condition 2 Condition 3
Figure 11: Time comparison of variable nodes by our algorithm model.
of users, the first data files include 943 user numbers, the second data files include 6040 user numbers, and the third data files include 71567 user numbers. The experimental data
information is shown in Table1, including the user number
and the film’s number and the size of the file.
We analyze the complexity and performance in above section, while in this section we analyze experimental result by two aspects. Firstly, we compare the performance of using the R stand-alone mode and the advanced parallel algorithm by our big data visualization algorithm analysis integrated model mode. Secondly, we compare the performance by changing the clusters’ node numbers with our big data visu-alization algorithm analysis integrated model mode.
Firstly, from the comparison with the performance of using the R stand-alone mode and the advanced parallel algorithm by our big data visualization algorithm analysis integrated model mode, it is shown that the big data visual-ization algorithm design model mode has better high ratio
than R stand-alone mode. The result is shown in Figure10.
As shown in Figure10, we use the R stand-alone mode and
the advanced parallel algorithm by our big data visualization algorithm analysis integrated model mode with five data
nodes to run the three kinds of experimental data. Figure10
shows that our big data visualization algorithm analysis integrated model is far superior to the R stand-alone mode. Particularly, when the amounts of data are very large, our big data visualization algorithm analysis integrated model shows the absolute advantage.
Besides, we compare the performance by changing the clusters’ node numbers with our big data visualization algo-rithm analysis integrated model mode. The experimental
results are shown in Figure11. As seen from Figure10, the R stand-alone mode responses take longer time than our design model with five data nodes, because the processing speed of multinode in cluster is quicker than a single node. In
Fig-ure10, we know that, with the increasing amount of data, the
consumption of time grows exponentially with the R stand-alone mode, while the data quantity is very large and up to the TB, ZB data; the R stand-alone mode will appear bottleneck when processing these data, while using the advanced parallel algorithm by our big data visualization algorithm analysis integrated model mode with five data nodes is almost linear growth.
In order to prove this view better, this paper also alone takes the cluster data nodes as the reference to run the exper-imental data and record operation time. The experexper-imental
results are shown in Figure11. In addition, we find that, with
3 data nodes processing data, the consumption of time is a bit higher. The reasons are attributed to the underlying data partitioning mechanism of Hadoop 1.2.1. In other words, a data block appears in different machines, the scheduling of
this data spends some time. In a word, from Figure11it is
shown that the cluster increased number and cluster data processing time are nearly linear function. It shows that our big data visualization algorithm analysis integrated model to process big data is of good scalability and good superiority.
7. Conclusions
This paper designs a big data visualization algorithm analysis integrated model based on RHadoop. At first, we analyze the superiority based on the software design of parallel comput-ing model from the computer parallel theory to demonstrate the epidemic and practicability of Hadoop. Secondly we analyze the advantage of the ecological system of Hadoop and the disadvantage of R and propose the superiority of the big data visualization algorithm analysis integrated model based on RHadoop. Finally, we design and implement the paralleling collaborative filtering algorithm based on the big data visualization algorithm analysis integrated model. Because the original collaborative filtering algorithms have some shortcomings, for example, the sparse matrix and the poor scalability, while our big data visualization algorithm analysis integrated model can solve the problem well, through a lot of experiments, we verify that our big data visualiza-tion algorithm analysis integrated model is a good design. Particularly, it is good at the practical problems of the combination with big data and visualization. Certainly given the limitations of the Map Reduce calculation model, in the next step we will add up the Spark calculation model to the big data visualization algorithm analysis integrated model and conduct further research and analysis.
Conflict of Interests
The authors declare that there is no conflict of interests regarding the publication of this paper.
Acknowledgments
This work is supported by the national science and technol-ogy support program of China (Grant no. 2012BAH09B02) and key science and technology project of Hunan Province (Grant no. K1204006-11-1).
References
[1] A. Paterek, “Improving regularized singular value decomposi-tion for collaborative filtering,” inProceedings of the KDD Cup and Workshop (KDDCup ’07), pp. 5–8, San Jose, Calif, USA, August 2007.
[2] Q. Liu, E. Chen, H. Xiong, C. H. Q. Ding, and J. Chen, “Enhanc-ing collaborative filter“Enhanc-ing by user interest expansion via per-sonalized ranking,”IEEE Transactions on Systems, Man, and Cybernetics Part B: Cybernetics, vol. 42, no. 1, pp. 218–233, 2012. [3] C. Birtolo, D. Ronca, and R. Armenise, “Improving accuracy of recommendation system by means of item-based fuzzy clus-tering collaborative filclus-tering,” inProceedings of the 11th Interna-tional Conference on Intelligent Systems Design and Applications (ISDA ’11), pp. 100–106, IEEE, November 2011.
[4] S. Zhang, W. Wang, J. Ford et al., “Learning from incomplete ratings using non-negative matrix factorization,” inProceedings of the 6th SIAM Conference on Data Mining (SDM ’06), 2006. [5] S. Wei, N. Ye, S. Zhang, X. Huang, and J. Zhu, “Collaborative
fil-tering recommendation algorithm based on item clusfil-tering and global similarity,” inProceedings of the 5th International Con-ference on Business Intelligence and Financial Engineering (BIFE ’12), pp. 69–72, IEEE, Lanzhou, China, August 2012.
[6] Z. Liu, W. Qu, H. Li, and C. Xie, “A hybrid collaborative filtering recommendation mechanism for P2P networks,”Future Gener-ation Computer Systems, vol. 26, no. 8, pp. 1409–1417, 2010. [7] R. Pan and M. Scholz, “Mind the gaps: weighting the unknown
in large-scale one-class collaborative filtering,” inProceedings of the 15th ACM SIGKDD International Conference on Knowledge Discovery and Data Mining (KDD ’09), pp. 667–675, July 2009. [8] A. Bahga and V. K. Madisetti, “Analyzing massive machine
maintenance data in a computing cloud,”IEEE Transactions on Parallel and Distributed Systems, vol. 23, no. 10, pp. 1831–1843, 2012.
[9] S. Perera, Hadoop MapReduce Cookbook, Packt Publishing, 2013.
[10] S. Guo,Hadoop Operations and Cluster Management Cookbook, Packt, Birmingham, UK, 2013.
[11] T. White,Hadoop: The Definitive Guide, O’Reilly Media, 2012.
[12] http://journal.r-project.org/.
[13] J. Dean and S. Ghemawat, “MapReduce: simplified data process-ing on large clusters,”Communications of the ACM, vol. 51, no. 1, pp. 107–113, 2008.
[14] Y. Zhao, A. Padmanabhan, and S. Wang, “A parallel computing approach to viewshed analysis of large terrain data using graphics processing units,”International Journal of Geographical Information Science, vol. 27, no. 2, pp. 363–384, 2013.
[15] D. A. Patterson and J. L. Hennessy,Computer Organization and Design: The Hardware/Software Interface, Newnes, 2013.
Submit your manuscripts at
http://www.hindawi.com
VLSI Design
Hindawi Publishing Corporation
http://www.hindawi.com Volume 2014
Machinery
Hindawi Publishing Corporation
http://www.hindawi.com Volume 2014 Hindawi Publishing Corporation
http://www.hindawi.com
Journal of
Engineering
Volume 2014
Hindawi Publishing Corporation
http://www.hindawi.com Volume 2014 Shock and Vibration
Hindawi Publishing Corporation
http://www.hindawi.com Volume 2014
Mechanical Engineering Advances in
Hindawi Publishing Corporation
http://www.hindawi.com Volume 2014
Civil Engineering
Advances inAcoustics and VibrationAdvances in
Hindawi Publishing Corporation
http://www.hindawi.com Volume 2014
Hindawi Publishing Corporation
http://www.hindawi.com Volume 2014
Electrical and Computer Engineering
Journal of
Hindawi Publishing Corporation
http://www.hindawi.com Volume 2014 Distributed Sensor Networks International Journal of
The Scientific
World Journal
Hindawi Publishing Corporation
http://www.hindawi.com Volume 2014
Sensors
Journal ofHindawi Publishing Corporation
http://www.hindawi.com Volume 2014
Modelling & Simulation in Engineering
Hindawi Publishing Corporation
http://www.hindawi.com Volume 2014
Hindawi Publishing Corporation
http://www.hindawi.com Volume 2014
Active and Passive Electronic Components Hindawi Publishing Corporation
http://www.hindawi.com Volume 2014 Chemical Engineering International Journal of Control Science and Engineering Journal of
Hindawi Publishing Corporation
http://www.hindawi.com Volume 2014
Antennas and Propagation International Journal of
Hindawi Publishing Corporation
http://www.hindawi.com Volume 2014
Hindawi Publishing Corporation
http://www.hindawi.com Volume 2014 Navigation and Observation International Journal of Advances in OptoElectronics
Hindawi Publishing Corporation
http://www.hindawi.com Volume 2014
Robotics
Journal ofHindawi Publishing Corporation