R E S E A R C H
Open Access
Research on financial network big data
processing technology based on fireworks
algorithm
Tao Luo
Abstract
Big data is a hot issue in both theoretical and practical circles. Although many scholars have analyzed the risk of internal control of venture capital information system from different angles, there is still a lack of research on the risk of internal control of venture capital system under big data environment. Aiming at the concept and characteristics of large data, this paper proposes the research of internal control system of venture capital information system based on large data processing technology. The risk prediction model based on improved quantum support vector machine is used to verify the accuracy of the model. This paper divides the risk critical control process one by one for the hardware, software, personnel, information and operation rules of the venture capital object; probes into the main risks of different control objects in the process of information system construction under the big data environment; and puts forward the corresponding risk management methods of system internal control. Simulation experiments verify the reliability of the model and algorithm.
Keywords:Big data, Risk venture, Predict model, Control model, Support vector
1 Introduction
With the rapid development of modern science and technology, the amount of data has increased explo-sively. Traditional computing technology cannot meet the needs of large amount of data calculation and ana-lysis [1–3]. The processing center of software has chan-ged from process control to data value mining, which has become an irresistible trend. Value mining of huge data is widely used in trend prediction, personalized rec-ommendation, and relevance of things. Under the influ-ence of the big data research and development plan put forward by the USA, the big data mining strategy has gradually become an important part of the national core strategy. The UK, Japan, and other countries have followed suit to put forward the big data development strategy. In recent years, China has also issued the big data development strategy [4, 5]. The concept of large data is first proposed in the fields of physics, meteor-ology, bimeteor-ology, and other sciences. Facing the problems encountered by a large number of scientific mathematics in acquisition, storage, search, sharing, and analysis,
some new distributed computing technologies have been studied and developed accordingly [6].
The rapid popularization of the mobile Internet has brought a lot of new changes to society and also made service providers accumulate a large number of individ-ual user data. Big data is a kind of huge information data with high growth rate and various types. It cannot be collected, managed, and analyzed by common software in a certain time scale [7, 8]. New processing methods and methods must be used to ensure that the company has more correct decision-making power, insight, and process than before [9]. At present, the development of a venture capital enterprise depends more and more on the ability to extract effective information from massive data as the basis for decision-making-level investment activities [10]. Faced with the new era background, ven-ture capital enterprises should speed up the transform-ation of the inherent thinking, actively embrace new technologies and ideas, and constantly find and solve problems, so as to make it in the future development of an invincible position [11,12]. Based on the background of big data, venture capital enterprises have welcomed the possibility of greater development than before [13].
© The Author(s). 2019Open AccessThis article is distributed under the terms of the Creative Commons Attribution 4.0 International License (http://creativecommons.org/licenses/by/4.0/), which permits unrestricted use, distribution, and reproduction in any medium, provided you give appropriate credit to the original author(s) and the source, provide a link to the Creative Commons license, and indicate if changes were made.
Correspondence:[email protected]
In the new era, we should pay more attention to the es-sence of the problem behind the massive data informa-tion, and paying more attention to the huge economic benefits brought by the data has become the consensus of major enterprises. The traditional sense of venture capital enterprises in the face of huge amounts of data information, the corresponding level of organization, and management has been unable to meet the market requirements. The changes of the times require that the venture capital enterprises should have more efficient and discriminative data processing ability. The decision-making level should analyze the information obtained from the data processing so as to forecast the market development direction and start the investment business according to the company’s investment ability. This will help the enterprises to optimize their business plans and make accurate decisions and to promote the development of enterprises.
2 Methods
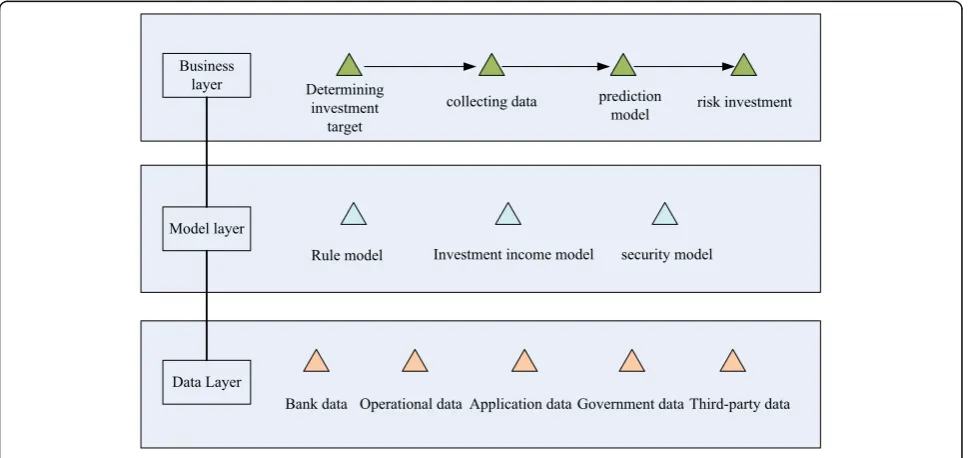
2.1 The big data platform for venture capital
Venture capital is a very complex and related process with many factors (Fig. 1). It is a nonlinear time series with many conditions. It has the characteristics of dy-namic, uncertain, nonlinear, and catastrophic. It is ne-cessary to apply large data theory to collect a large number of historical actual venture capital data and knowledge. Through data mining and data analysis, the standard, structure, and standardized description of vari-ous factors which have certain impact on risk prediction are established. Accurate risk prediction will help to grasp the state of line investment object in time and
provide a reliable basis for investment risk classification. At the same time, investment risk research is a branch of research involving finance, economy, disaster manage-ment, and other fields. It is the result of the deepening and refinement of financial system risk theory research and the foundation of establishing risk prevention system.
The data source layer integrates multi-energy data and other internal and external data to form structured data, such as relational database and two-dimensional table. The data warehouse is composed of unstructured data, history, quasi-real time, real-time data, and GIS data.
The business application layer introduces a multi-tenant model, provides various data access control methods and graphical programming framework, and provides decision support for data applications such as intelligent prediction, intelligent investment consulting, and intelligent venture capital control.
The model layer provides some model to deal with the data that come from the data layer and provides some information to the business layer. It is the link bridge be-tween the raw data and intelligent decision.
2.2 Model construction of big data platform based on Spark
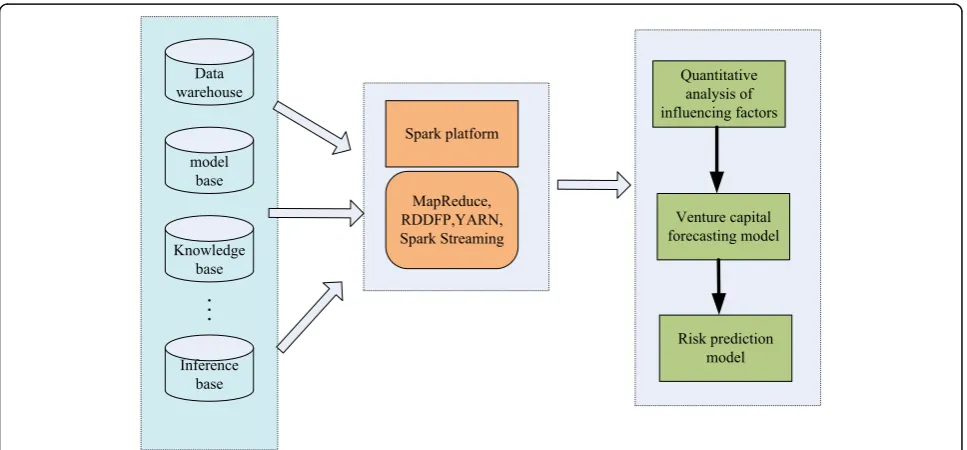
Spark platform is a new generation of large data analysis framework based on Hadoop MapReduce. It is mainly used to speed up the running and reading and writing of data analysis. It has all the advantages of Hadoop MapReduce. But unlike MapReduce, Spark platform stores the results of calculation directly in memory, so as to make the data analysis faster and faster. The
procedure is more efficient. The related tests show that the performance of the Spark platform can exceed 10~100 times of the Hadoop platform. In addition, Spark platform can realize machine learning and inter-active analysis of online data. Each thread task can dir-ectly fetch the required data from memory, thus realizing the high sharing of data, improving the effi-ciency of data processing and the speed of algorithm op-eration. While Hadoop MapReduce needs to write multiple parallel or serial MR tasks when performing data tasks, the data between tasks cannot be shared, resulting in low performance, long analysis time, large memory occupancy, and other issues, and it is only suit-able for offline large data analysis. With the rapid devel-opment of modern intelligent monitoring equipment, it is very important to mine and apply large data online in real time and efficiently. Therefore, the characteristics of Spark large data platform make it have more advantages in iterative algorithm and interactive data mining algorithm.
The process of venture capital is complex and change-able, and the financial environment changes all the time will produce a huge amount of data. Therefore, estab-lishing the quantitative model of influencing factors, risk prediction model, and risk assessment model based on Spark platform can effectively improve the processing ef-ficiency of massive financial data and reduce the redun-dancy of information. Thus, it can help to improve the performance of the model, improve the accuracy of the algorithm, and provide a reliable support for the relevant research of venture capital. The related models based on Spark platform are shown in Fig.2.
As can be seen from Fig. 2, this paper mainly, based on the data warehouse, model base, and knowledge base of venture capital, put the quantitative analysis model of investment factors, risk prediction model, and invest-ment risk assessinvest-ment model on the Spark platform for data processing and algorithm operation, in order to im-prove the efficiency of data processing and knowledge base and enhance the performance of the algorithm. Quantitative analysis of influencing factors is an import-ant basis for other models. The study of a large number of historical investment data, such as data classification, bad data processing, missing data supplement, and data dimension unification, can provide good large data prep-aration for subsequent wind prediction models, invest-ment state risk assessment models, and other operations. In addition, it is necessary to deal with struc-tured data, unstrucstruc-tured data, or mixed data by MapRe-duce, which is based on the quantification of influencing factors, risk prediction, and investment risk assessment of large-scale data. Parallel computation is realized by developing multiple Spark Streaming processes, param-eter optimization, and variable selection, and redun-dancy is reduced. Information can effectively improve the efficiency and accuracy of the algorithm.
3 Investment risk prediction model based on Spark big data platform
3.1 Quantum fireworks optimization algorithm model (QFA)
The fireworks algorithm (FA) is the simulation of the entire fireworks explosion process. When the fireworks explode, a large number of sparks will be generated, and
the sparks can continue to explode, resulting in beautiful and colorful patterns. In the fireworks algorithm, each firework can be regarded as a feasible solution in the so-lution space of the optimization problem, so the spark generated by fireworks explosion can be regarded as a process of searching for the optimal solution. In the spe-cific optimization problem, the fireworks algorithm needs to consider the number of sparks produced by each fireworks explosion, the explosion radius, and how to select a set of optimal fireworks and sparks to carry out the next explosion.
In the fireworks algorithm, the most important three components are explosion operator, mutation operator, and selection strategy.
(1) Explosion operator: The number Si and radius Ai of sparks produced by each firework xi(i= 1, 2⋯n) are calculated according to the fitness of the fireworks.
Si¼MXNymax−f xð Þ þi ε
In the above formula,ymaxandyminrepresent the max-imum and minmax-imum fitness values of the current popu-lation,f(xi) is the fitness value of fireworksxi, andMis a constant, which is used to adjust the number of sparks produced.R^is a constant, which is used to adjust the ex-plosion radius of fireworks. εis the smallest part of the machine to avoid zero operation.
(2) Mutation operator: The mutation operator is set to increase the diversity of the explosive spark population. The mutation spark in the fireworks algorithm is to gen-erate the Gaussian mutation spark by the Gaussian mu-tation of the explosive spark. Assuming that fireworksxi is selected for Gaussian mutation, the k-dimensional Gaussian mutation operation is ^xik¼xike, where xik represents k-dimensional variant fireworks ande repre-sentsN(1, 1) Gaussian distribution.
The explosive sparks and mutation sparks generated by the explosive operator and mutation operator in the spark algorithm may exceed the boundaries of the feas-ible region Ω, which is mapped to a new position by mapping rules. The formula is as follows:
^xik¼xLB;kþj j^xik% xUB;k−xLB;k
ð3Þ
wherexUB, kand xLB,kis the upper and lower bounds of solution space onkdimension respectively.
(3) Selection strategy: In order to transmit the infor-mation of the excellent individuals in the group to the
next generation, it is necessary to select a certain num-ber of individuals as the fireworks of the next generation from the explosive sparks and variant sparks.
Assuming K candidates and N populations, the indi-viduals with the best fitness in the candidate set will be identified as the next-generation fireworks. The remaining N−1 fireworks are selected by probability. For fireworksxi, the probability formula for its selection is: tween all the individuals in the current individual candi-date set. In the candicandi-date set, if the individual density is high, that is, when there are other candidates around the individual, the probability of the individual being se-lected will be reduced.
3.2 Quantum evolutionary algorithm
The development of quantum mechanics makes quantum computation more and more applied in all as-pects. In quantum computation, the representation of quantum states is performed by quantum bits. Usually, the representation of quantum information is performed by the 0 and 1 binary method; besides the “0” and “1” states which can be in the basic state, the quantum states can also be in the arbitrary linear superposition of the “0” and “1” states, that is, the two states can be in the same state at the same time. To a great extent, it challenges the representation of classical positions in classical mechanics. The superposition state of quantum state can be expressed by the lower form:
ψ≥α
j j0>þβj1>;j jα2þj jβ2¼1 ð6Þ
In the above formula, 0 and 1 denote two states of a quantum;αand βdenote the probability amplitude of a quantum; |α|2 denotes the probability of a quantum state at 0; and |β|2denotes the probability of a quantum state at 1. Quantum algorithm is updated through quantum revolving door, and its adjustment strategy is as follows:
is a quantum revolving gate andθis
a quantum rotation angle.
quantum bit and quantum superposition makes quantum evolutionary algorithm have many advantages, such as better population diversity and strong global optimization ability, especially the algorithm has strong robustness and can be well combined with other algorithms.
3.3 Quantum fireworks algorithm
(1) Solution space
In the solution space,Nfireworks are randomly gener-ated and their coordinates are initialized. Here, we use the probability amplitude of the quantum bit as the en-coding of the current position of the fireworks.
pi¼ the number of solution space.i= 1, 2,⋯n.Therefore, the probability amplitudes of the quantum states of∣0> and
∣1> are as follows:
pic¼ð cosð Þθi1 cosð Þθi2 ⋯ cosð Þθin Þ ð9Þ
pis¼ð sinð Þθi1 sinð Þθi2 ⋯ sinð Þθin Þ ð10Þ
(2) Solution space transformation
The searching process of fireworks optimization algo-rithm is carried out in the actual parameter space [a, b]. Since the probabilistic amplitude of fireworks location is within [0, 1], it is necessary to decode the probabilistic amplitude into the actual parameter space [a, b], so as to facilitate the searching of fireworks algorithm; if the fire-work on the individual firefire-workspiis ½αij;β
j
i, the
corre-sponding solution space is changed. The formula is
Xicj ¼0:5 bi 1þαij
where rand() is the random number between [0, 1];
Xicj is the actual parameter value of the position of the
jth dimension when the quantum state of the first fire-works individual is∣0>;Xisj is the actual parameter value
of the position of the jth dimension when the quantum state of the second fireworks individual is ∣1>.aiandbi
are the upper and lower limits of individual pi search range respectively.
(3) Fitness valuef(xi) of each firework was calculated,
and the number of sparks produced by the explosion radiusRiof each firework was calculated
as formulas (1 and 2)
(4) Fireworks individual location update
In this paper, the quantum revolving gate is used to re-place the uniformly distributed U(a,b) to update the position of fireworks.
jd is the probability amplitude of thej-firework d-dimension space in the firstk+ 1 iteration. θkþjd 1 is the rotation angle. In addition, to adapt to the operation mechanism of fireworks algorithm, the updated prob-ability amplitudes αkþjd1 and βkþjd1 are transformed into solution spaces.
And then calculate the position offset:
hdjc¼RiXdjc ð16Þ
hdjs ¼RiXdjs ð17Þ
In cross-boundary detection, if the spark of explosion exceeds the boundary of feasible region, the particle pos-ition is updated according to formula (3):
(5) Individual mutation operation
The main reason for premature convergence and local optimum of fireworks population is that the diversity of the population is lost in the process of searching. In quantum fireworks algorithm, quantum mutation is used to replace the Gaussian mutation in the original algorithm to increase the diversity of the population, thus effectively avoiding the abovementioned problems; random selecting of fireworksxi, quantum variation spark M^ is generated. Its operation is shown in the following formula:
01
The probability of individual variation of fireworks is
rand() <pm, the above formula is used to mutate the in-dividual fireworks, change the probability amplitude in the quantum bit, and finally transform the mutated indi-vidual fireworks into a solution space and save it to the mutated spark population.
(6) Using the probability selection formula from fireworks, explosive sparks and Gaussian variant spark populationp(xi) selectsNindividuals as fireworks for next-generation iteration calculation
3.4 QFA-SVM risk prediction under Spark big data platform
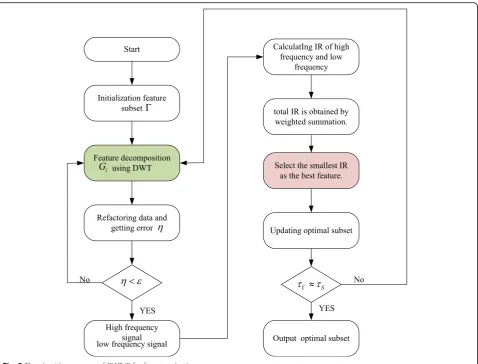
DWT-IR feature extraction and QFA-SVM model risk prediction process based on Spark platform is shown in Fig.3. As can be seen from the graph, the risk prediction system proposed in this paper mainly includes three Spark working groups: the first working group is mainly based on discrete wavelet inconsistency feature selection (part 1), the second working group is sample training (part 2), and the third working group is mainly based on QFA-SVM risk prediction (part 3). When the feature subset cannot satisfy the stopping condition of the algo-rithm, it will return to the program and continue to loop until the desired accuracy is achieved and the optimal feature subset is output. Therefore, in the risk prediction system proposed in this paper, the first part is to find the optimal feature subset and the optimal regression model parameters by iterative calculation; the second part is to calculate the prediction accuracy of training samples in each iteration, so that the fitness function value can be calculated; and the third part will be that the optimal feature subset and parameters obtained from the above two parts are used to predict the risk probabil-ity values of the test samples through the retraining of the regression model.
4 Experience
4.1 Prediction of big data selection and pre-processing
4.1.1 Discrete wavelet transform
Discrete wavelet transform (DWT) has been widely used in digital signal processing, petroleum exploration, earthquake prediction, medical fault diagnosis, coding theory, quantum physics, and probability theory. Various fast Fourier transform (FFT) and DWT algorithms have emerged constantly and become the most active
research field in numerical algebra. Their significance is far beyond the scope of algorithm research, thus opening up a new situation for many scientific and technological fields. Continuous wavelet transform is often redundant. In order to solve this problem, we use discrete wavelet transform to deal with practical problems, that is, dis-crimination of wavelet basis functions. This discrimin-ation method is not for the time t, but for the scaling factor and translation factor in the wavelet basis func-tion. Usually, the wavelet basis function can be repre-sented by the following expression:
ψa;tð Þ ¼t a−
where arepresents the wavelet scaling factor and τis the wavelet shift factor. The discrete wavelet coefficient WTf can be used to construct function f(t), which is as
The process of wavelet transform can be expressed as a decomposition tree composed of low-frequency signal and high-frequency signal. In the wavelet decomposition tree, the decomposition process of the signal can be iter-ated, the multi-level decomposition can be carried out, the low-frequency signal can be decomposed, more low-frequency signal can be obtained, the high-frequency signal can be decomposed, and more resolution can be obtained. In practice, the decompos-ition frequency of low-frequency signal and high-frequency signal is determined by the coefficient WTf.
4.1.2 Data inconsistency rate calculation (IR)
The purpose of feature selection under financial and other historical data is to distinguish the data features with the strongest correlation with risk data, so that the input value of the risk prediction model has a strong pertinence; reduce data redundancy; and help to im-prove the accuracy of risk prediction to the greatest ex-tent. Data inconsistency rate can accurately describe the discrete characteristics of input features, different feature attributes can get different partition patterns, different partition patterns can get different frequency distribu-tion, the calculation of inconsistency rate can just be used to distinguish the ability of data categories, and the greater the data inconsistency rate, indicating the feature vector, the worse the classification ability.
the sample data set and select the feature with the least data inconsistency to maximize the features of the sam-ple data set, which can reduce the redundancy caused by information duplication.
4.1.3 DWT-IR feature extraction model
The key of feature extraction method based on the consistency rate of discrete wavelet is to calculate the in-consistency rate of different signal groups accurately and judge them accurately. Through the discrete decompos-ition of the ice-covered feature data, the change of the data characteristics can be reflected more directly. The redundancy of the data can be judged intuitively by the calculation of the inconsistency rate, and the features can be extracted from the large-scale ice-covered data quickly and effectively, thus helping the model to proceed in a favorable direction. The algorithm flow based on DWT-IR feature selection is shown in Fig.3.
As is shown in Fig.3, the core of the DWT-IR is how to refractor the data and select the smallest IR as the best feature.
4.2 Feature extraction based on DWT-IR
The main purpose of feature selection is to find the opti-mal subset from a specific problem to describe the ac-curacy of the prediction system, so as to avoid the redundancy of information caused by too many input vectors, resulting in the decline of prediction accuracy and prediction inaccuracy. Therefore, choosing the ap-propriate fitness function in the risk prediction system is of great help to determine the optimal feature subset. In this paper, the fitness function based on the double fac-tors of prediction accuracy and feature selection quantity is established:
fitnessð Þ ¼xi − ar xð Þ þi b
1
Numfeatureð Þxi
ð22Þ
where in the formula, r(xi) represents the accuracy of risk prediction for each iteration, Numfeature(xi) is the optimal number of features selected for each iteration, and a and b are constants between [0,1]. It can be
inferred from the formula that the fitness function value will be higher when the risk prediction accuracy is higher and the number of features is less.
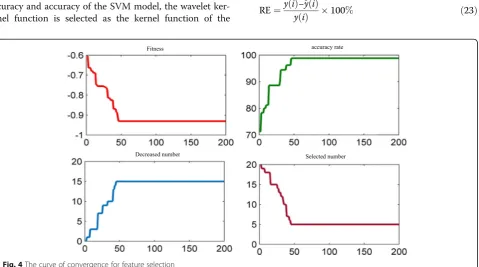
Figure 4 is an iterative process chart of the discrete wavelet inconsistency model for feature extraction of training samples.
The fitness curve shown in the figure above describes the fitness function values calculated during each iter-ation; the accuracy curve describes the predictive accur-acy values of the training samples for different iterations; the number of features reduced is the number of fea-tures eliminated in the convergence process; and the number of choices represents the convergence of the al-gorithm. The optimal number of features obtained from the DWT-IR model is calculated. As can be seen from Fig.4, the algorithm converges when the number of iter-ations is 46, and the optimal fitness function is −0.93. At the 46th iteration, the prediction accuracy of the training samples is 98.8%, which shows that the fitting ability of the model is strengthened by the learning and training of the algorithm, and the prediction accuracy of the training samples is the highest. In addition, when the algorithm runs to the 46th time, the number of selected features tends to be stable. It can be seen that the algo-rithm eliminates 15 redundant features from 20 candi-date features.
4.3 Risk model prediction based on QFA-SVM
After obtaining all the optimal features of the sample data, the input vector is brought into the QFA-SVM model for training and testing. In order to ensure the ac-curacy and acac-curacy of the SVM model, the wavelet ker-nel function is selected as the kerker-nel function of the
QFA-SVM regression model, and the important parame-ters of the model are optimized by the QFA algorithm.
The parameters of the QFA model are as follows: the maximum number of iterations is Maxgen = 500, the popu-lation number is PopNum = 30, the spark number is con-stantM= 100, the explosion radius is constantR= 150, and the upper and lower bounds of the individual search space of fireworks are Vtop= 512 andVdown=−512 respectively. The QFA-SVM model parameters calculated by running program areγ= 4756.42 andσ= 8812.18 respectively.
In order to prove the prediction performance of the proposed ice thickness prediction model, support vector machine (SVM), BP neural network (BPNN), and multi-variable linear regression model (MLRM) are se-lected to predict the risk of this case. Then, the predic-tion results of the four models are evaluated and analyzed. In a single SVM prediction model, the selec-tion of its parameters is as follows: C= 913.10, ε= 0012.0, σ= 2.4532. In the BPNN icing prediction model, the number of neurons in the input layer, hidden layer, and output layer is set to 5, 7, and 1 respectively; the neuron activation function is chosen to be sigmoid func-tion; the maximum allowable error of model training is 0.001, and the maximum number of iterations is set to 5000. This paper selects relative error (relative error, RE) and average absolute percentage error, and the absolute percentage error (MAPE) and root mean square relative error (RMSE) are used as the evaluation indexes of the prediction results (Table1). The formulas are as follows:
RE¼y ið Þ−^y ið Þ
y ið Þ 100% ð23Þ
MAPE¼ 1 N
XN
i¼1
y ið Þ−^y ið Þ y ið Þ
100% ð24Þ
MAPE¼
ffiffiffiffiffiffiffiffiffiffiffiffiffiffiffiffiffiffiffiffiffiffiffiffiffiffiffiffiffiffiffiffiffiffiffi
1 N
XN
i¼1
y ið Þ−^y ið Þ y ið Þ
2
v u u
t ð25Þ
Through program operation calculation, the prediction results of the total icing thickness of the four models are shown in Fig.5.
First, the maximum and minimum relative distance between the original risk and the predicted value can be seen from Fig. 5. In the MLRM model, the maximum relative distance is 0.77 and the minimum relative
distance is 0.25. In the BPNN model, the maximum and minimum relative distances are 0.56 and 0.16 respect-ively. The two values of BPNN are less than MLRM, in-dicating that the prediction accuracy of BPNN is higher than that of MLRM. In the SVM model, the maximum and minimum relative distances are 0.47 and 0.11 re-spectively. The deviation between the maximum and minimum relative distances is 0.36, which is smaller than that of the BPNN and MLRM models. It shows that the stability of the SVM icing prediction model is higher than that of the BPNN and MLRM. In the proposed QFA-SVM icing prediction model, the maximum relative distance is only 0.2, the minimum relative distance is 0.064, and the deviation between the maximum and minimum relative distances is only 0.136. Compared
Table 1Part of the forecasting values and relative errors of each model
Real data (%)
QFA-SVM SVM BPNN MLRM
Prediction Error% Prediction Error% Prediction Error% Prediction Error%
1 11.67 11.84 1.46 11.29 −3.26 11.21 −3.94 11.28 −3.34
2 12.49 12.23 −2.08 11.89 −4.80 11.97 −4.16 13.2 5.68
3 11.67 11.42 −2.14 11.39 −2.40 12.02 3.00 10.94 −6.26
4 10.65 10.83 1.69 10.13 −4.88 11.31 6.20 11.03 3.57
5 9.8 9.98 1.84 10.19 3.98 10.32 5.31 9.23 −5.82
6 10.67 10.44 −2.16 10.29 −3.54 10.16 −4.78 11.29 5.81
7 10.14 10.42 2.76 10.62 4.73 10.46 3.16 10.84 6.90
8 11.29 11.46 1.51 10.89 −3.54 11.8 4.52 10.76 −4.74
9 12.01 12.24 1.92 11.6 −3.41 12.42 3.41 11.26 −6.24
10 12.39 12.62 1.86 11.84 −4.44 12.97 4.68 11.64 −6.05
MAPE 2.02 3.85 4.41 5.28
RMSE 2.05 3.94 4.50 5.38
with the other three prediction models, the three values of the QFA-SVM model are smaller; it shows that the proposed icing prediction model has higher values. It has prediction accuracy and higher prediction stability.
4.4 Dynamic assessment of risk status
According to the possible influence degree, influence range, and development trend of venture capital events, the risk grade of investment state is divided into five grades according to the ice thickness range. Grade I (mild), grade II (general), grade III (moderate), grade IV (severe), and grade V (very serious) are repre-sented in gray, blue, yellow, orange, and red in turn, as shown in Table 2.
Usually, the state parameters of investment risk assess-ment will change with time, and the investassess-ment data have dynamic changes. If the state parameters of large amount of data are directly input into the DBN-ANFIS model, the operation efficiency of the risk assessment model will be slow, and the state evaluation will be in-accurate. Therefore, in order to improve the data pro-cessing efficiency and model accuracy, this paper puts the DBN-ANFIS model on the Spark large data platform for the state risk assessment of large amount of data.
The convergence times of the DBN-ANFIS model, ANFIS model, and BPNN model are 354, 417, and 442 respectively, and the model precision is 0.0855, 0.1132,
and 0.1285 respectively. The convergence times and model precision of the DBN-ANFIS model are better than those of the ANFIS and BPNN model, which shows that the convergence speed and global search ability of the DBN-ANFIS model are important. It is better than the other two models. Through the improvement of dy-namic Bayesian reasoning, the global fitting ability of the ANFIS model is improved, and the algorithm converges quickly and achieves the expected precision in the train-ing of samples, thus enhanctrain-ing the robustness of the ANFIS model.
As shown in Table 3, the MAPE value of the DBN-ANFIS model is 2.74%, less than 4.69% and 4.98% of the ANFIS model and BPNN model; in addition, the MSE value of the DBN-ANFIS model is 0.17, also less than the ANFIS model (0.68) and BPNN model (0.74); the smaller the MSE value, the higher the prediction ac-curacy of the DBN-ANFIS model for output value 1Y. And the stability is stronger. In addition, the recognition rate of the DBN-ANFIS model for risk degree and color identification was 97.31%, and the number of identifica-tion errors was 7, including 1 LR sample, 5 NR sample, and 1 MR sample; the recognition rate of the ANFIS model was 92.69%, and the number of identification er-rors was 19, including 1 LR sample, 9 NR sample, and 1 MR sample. The recognition rate of the BPNN model is 91.92%, and the number of recognition errors is 21, in-cluding 1 NR sample, 5 MR sample, 10 SR sample, and 5 HR sample. The above data show that the DBN-ANFIS model is more accurate than the ANFIS and BPNN models in identifying the degree of risk and color identification, especially for SR and HR levels.
5 Results and discussion
Financial network based on fireworks algorithm big data processing technology research, mainly discusses the
Table 2The risk grade of the venture
Risk probability (%) Risk grade Degree of risk Color
0–5 1 LR Gray (g)
5–10 2 NR Blue (b)
10–20 3 SR Yellow (y)
20–30 4 SR Orange (o)
30+ 5 HR Red (r)
Table 3 The MAPE value of the DBN-ANFIS, ANFIS, and BPNN models
Real data (%)
DBN-ANFIS ANFIS BPNN
Prediction Color Prediction Color Prediction Color
1 5.26 4.95 g 4.91 g 4.90 Gray (g)
2 9.61 10.1 y 10.22 y 9.01 Blue (b)
3 13.66 13.41 y 14.18 y 12.44 Yellow (y)
4 15.38 15.67 y 15.86 y 14.76 Yellow (y)
5 20.71 20.20 o 20.13 o 19.11 Yellow (y)
6 18.42 18.65 y 19.65 y 20.06 Orange (o)
7 30.47 31.15 r 29.36 o 29.33 Orange (o)
8 29.12 28.66 o 31.07 r 27.77 Orange (o)
9 19.45 19.68 y 21.38 o 17.73 Yellow (y)
10 19.92 20.16 o 20.68 o 19.20 Yellow (y)
advancement of fireworks algorithm, the fireworks algo-rithm has the ability of intelligent processing, at the same time has a comprehensive processing of a large number of statistical data analysis ability, in the process of a variety of data fusion analysis play an important role, for the pro-cessing of financial data have very good reference.
Abbreviations
DWT:Discrete wavelet transform; FFT: Various fast Fourier transform; MLRM: Multi-factor linear regression model; MR: Magnetic resonance
Funding
Youth fund for the humanities and social sciences research of China’s Ministry of Education. Research on the incentive mechanism of economic development of China’s model—based on the perspective of stochastic dynamic optimization. 15XJC630005.
Availability of data and materials
The data sets used and/or analyzed during the current study are available from the corresponding author on reasonable request.
Author’s information
Tao Luo, Doctor of Finance, Assistant Professor, graduated from Southwestern University of Finance and Economics in 2013 and worked in Xihua University. His research interests include real option, game, and corporate finance.
Competing interests
The author declares that he has no competing interests.
Publisher’s Note
Springer Nature remains neutral with regard to jurisdictional claims in published maps and institutional affiliations.
Received: 8 January 2019 Accepted: 18 April 2019
References
1. A. Sahaym, S.Y. Cho, K.K. Sang, et al., Mixed blessings: how top management team heterogeneity and governance structure influence the use of corporate venture capital by post-IPO firms. J. Bus. Res.69(3), 1208–1218 (2016) 2. S. Anokhin, S. Peck, J. Wincent, Corporate venture capital: the role of
governance factors. J. Bus. Res.69(11), 4744–4749 (2016) 3. T.L. Galloway, D.R. Miller, A. Sahaym, et al., Exploring the innovation
strategies of young firms: corporate venture capital and venture capital impact on alliance innovation strategy. J. Bus. Res.71-79(2016) 4. T. Minola, S. Vismara, D. Hahn, Screening model for the support of
governmental venture capital. J. Technol. Transfer.1(1), 1–19 (2016) 5. Madni, S.H.H., Latiff, M.S.A., Coulibaly, Y., Abdulhamid, S.I.M.: An appraisal of
meta-heuristic resource allocation techniques for IaaS cloud. Indian J. Sci. Technol.9(4), 1–14 (2016)
6. S.U. Lee, G. Park, J. Kang, The double-edged effects of the corporate venture capital unit’s structural autonomy on corporate investors’explorative and exploitative innovation. J. Bus. Res.88, 141–149 (2018)
7. M. Scarlata, J. Walske, A. Zacharakis, Ingredients matter: how the human capital of philanthropic and traditional venture capital differs. J. Bus. Ethics145(3), 1–13 (2017) 8. C. Bock, A. Huber, S. Jarchow, Growth factors of research-based spin-offs and
the role of venture capital investing. J. Technol. Transfer.2017(1), 1–35 (2017) 9. M.G. Colombo, D.J. Cumming, S. Vismara, Governmental venture capital for
innovative young firms. J. Technol. Transfer.41(1), 10–24 (2016)
10. N. Wasserman, Revisiting the strategy, structure, and performance paradigm: the case of venture capital. Organ. Sci.19(2), 241–259 (2016)
11. A. Jolink, E. Niesten, The impact of venture capital on governance decisions in collaborations with start-ups. Small Bus. Econ.47(2), 1–14 (2016) 12. C. Weber, B. Bauke, V. Raibulet, An empirical test of the relational view in the