UC Santa Barbara Electronic Theses and Dissertations
Title
Data-driven Graph Analysis Permalink https://escholarship.org/uc/item/89z8k2r7 Author Liu, Qingyun Publication Date 2017 Peer reviewed|Thesis/dissertation
Santa Barbara
Data-driven Graph Analysis
A Dissertation submitted in partial satisfaction
of the requirements for the degree of
Doctor of Philosophy
in
Computer Science
by
Qingyun Liu
Committee in Charge:Professor Ben Y. Zhao, Co-Chair Professor Haitao Zheng, Co-Chair
Professor Xifeng Yan
Qingyun Liu is approved:
Professor Xifeng Yan
Professor Haitao Zheng, Co-Chair
Professor Ben Y. Zhao, Co-Chair
Copyright © 2017 by
grandparents
,
parents
,
husband
and
close friends
My most sincere thanks go to my advisors, Prof. Ben Y. Zhao and Prof. Haitao Zheng. I greatly appreciate their efforts for mentoring me throughout the challenging PhD program. It is not often that one has the luck to find advisors that are always there for their students’ needs, either in research or in life. I could always get timely and helpful feedbacks and advice from them. Sometimes they gave me direct advices on technical or editorial issues to help me avoid obvious roadblocks from their rich academic experience. And in most times, they tried to train me into an independent researcher, where they gave me guidance, encouragement and also freedom to think in my own way. I especially want to express my gratitude for being granted freedom in choosing research directions, where I could give trials in different topics and pursue what I am really fond of. Their continuous guidance, care and support were essential to the completion of my Ph.D. study. I have learnt innumerable lessons and gained great experience both academically and in life, which are valuable in both my career and life in general.
I also want to give my earnest gratitude to my Ph.D. committee member Prof. Xifeng Yan, for his guidance through my Ph.D. program. Prof. Xifeng Yan served on my MAE (Major Area Exam), Ph.D. proposal and Ph.D. defense committee, and gave me great advice and feedbacks.
I benefitted a lot from my four internships at different research labs and com-panies. I collaborated with Dr. Matti Hiltunen, Dr. Abhinav Srivastava and Dr. Yu Jin at AT&T Labs Research for a traffic monitoring project, worked on adver-tisement in online social networks with Dr. Smriti Bhagat and Dr. Anmol Sheth at Technicolor Research Center, tracked lateral movements across computers with Dr. Jay Stokes and Dr. Weidong Cui at Microsoft Research, and mentored by Dr. Li Yu and Dr. Junfeng Pan in the Feed Ads Ranking Team in Facebook. It was amazing experiences to work on such great projects with both interesting topics and big impact. I also felt quite lucky to work with such outstanding researchers and learnt from them. Especially I want to thank Dr. Jay Stokes, who is such a nice and kind person and always so pleasant to talk with. And he provided such enormous help for my project to get bigger impact in both application and publication.
My sincere thanks also go to all the members of our great SAND laboratory. I have enjoyed my Ph.D. life with you all, and greatly appreciate the collaboration with Shiliang Tang, Xiaohan Zhao, Xinyi Zhang and Megan McQueen. Thanks for our discussion and debates on research projects, which most of the ideas flourished. Thanks for working together towards the same goals, for being aside to share the joy when papers were accepted, and for encouraging each other when projects
from whom I have learnt a lot: Ana Nika, Xia Zhou, Gang Wang, Yibo Zhu, Zengbin Zhang, Christo Wilson, Alessandra Sala, Bimal Wiswanath, Bolun Wang, Lin Zhou, Tianyi Wang, Yanzi Zhu, Zhijing Li, Yuanshun Yao, Zhujun Xiao, Yun Zhao, Jenna Cryan, Divya Sambasivan, Pritha D.N., Sujaya Maiyya, Kirti Bhandari and Abhay Chennagiri. Thanks for your encouragement, sharing my joy and sadness, and most of all, made my Ph.D. experience full of valuable memories. I am also always thankful for all my collaborators. It is so lucky to have the chance to work with those outstanding researchers. I would like to thank Dr. Walter Willinger, Dr. Scott Counts, Dr. Apurv Jain and Xiao Wang, and also collaborators at my undergraduate study: Dr. Bin Cui, Dr. Junjie Yao and Zijun Xue.
Finally, and most importantly, I would like to express my special thanks to my intimate relationships. Thanks for my beloved grandparents Yunjin and Hao, you have taught me what is love. I will love and miss you forever. Thanks to my parents Lu and Jin , for your endless care, support and always being there for me. And Xin, my dear husband, I have always felt so lucky to have met you. We have walked down so many roads, seen so many views, and shared so many feelings. With your company, I do not feel alone in the journey of life. Also, I want to sincerely thank Isa for giving me the key to explore the world outside and inside, for letting me into a much broader, mysterious, amazingly beautiful world that I have ever seen. I also want to thank myself, for being brave enough to make mistakes and explore different possibilities in life, being acute enough to learn from the past and others’ experiences, be persistent enough for the continuous efforts to learn about myself and life, and gradually become who I am. And finally, my closest friends, thanks for giving me the chance to share my life with you, and to let me accompany your journey. Thank you all, for letting me feel the richest and luckiest person in the world.
Qingyun Liu
Education
2012-2017 Ph.D. in Computer Science
University of California, Santa Barbara, USA 2012-2016 Master of Science in Computer Science University of California, Santa Barbara, USA
2008-2012 Bachelor of Science in Information Science and Technology Peking University, Beijing, China
Field of Study
Major Field Computer Science with Prof. Ben Y. Zhao and Prof. Haitao Zheng.
Professional Experience
09/2012-03/2017 Research Assistant, University of California, Santa Barbara. 06/2016-09/2016 Software Intern, Facebook, Menlo Park, CA.
06/2015-08/2015 Research Intern, Microsoft Research, Redmond, WA.
06/2014-09/2014 Research Intern, Technicolor Research Center, Los Altos, CA. 06/2013-08/2013 Research Intern, AT&T Labs Research, Florham Park, NJ.
Publications
ICWSM’17 Shiliang Tang,Qingyun Liu, Megan McQueen, Scott Counts, Apurv
Jain, Haitao Zheng, and Ben Y.Zhao. “Echo Chambers in Investment Discussion Boards. ” International AAAI Conference on Web and Social Media, May 2017.
IMC’16Qingyun Liu, Shiliang Tang, Xinyi Zhang, Xiaohan Zhao, Ben Y.Zhao,
and Haitao Zheng. “Network Growth and Link Prediction Through an Empirical Lens. ” In Proceedings of Internet Measurement Conference, November 2016.
ToMPECS’16 Qingyun Liu, Xiaohan Zhao, Walter Willinger, Xiao Wang, Ben
Y.Zhao, and Haitao Zheng. “Self-similarity in Social Network Dynamics. ” ACM Transactions on Modeling and Performance Evaluation of Computing Systems,
November 2016.
COSN’15 Xiaohan Zhao, Qingyun Liu, Haitao Zheng, and Ben Y.Zhao.
“To-wards Graph Watermarks.” In Proceedings of ACM Conference on Online Social Networks, November 2015.
Indexing Support in Micro-blog Platforms.” In Proceedings of IEEE International Conference on Data Engineering, April 2012.
submitted Qingyun Liu, Shiliang Tang, Megan McQueen, Scott Counts, Apurv
Jain, Haitao Zheng, and Ben Y.Zhao. “Herd Behavior and Inefficiency in Stock Markets. ”
submitted Qingyun Liu, Jack W. Stokes, Rob Mead, Tim Burrell, Ian Hellen,
John Lambert, Andrey Marochko and Weidong Cui. “LATTE: Tracking Malicious Lateral Movement Across a Computer Network. ”
Patent
09/2012-03/2017 Bin Cui, Junjie Yao, Hongzhi Yin, and Qingyun Liu. “A
lan-guage model based expert recommendation method.” China, Patent Number 102495860, October 2013.
Data-driven Graph Analysis
Qingyun Liu
The ever-expanding demands for network utilities today have greatly changed people’s lives. We are all around by various networks, from Internet, social net-works, to World Wide Web. Graphs are fundamental abstraction for netnet-works, which set the basis to systematically analyze and understand networks. Analyzing graphs is critical to provide insights on the fundamental process that drive the evolution of networks, and the essence for many real world applications, e.g.,
so-cial recommendations. Despite years of research in graph analysis, there has been little opportunity to study graphs from an empirical perspective. Prior studies are often limited by the size and granularity of public available datasets, which can-not accurately capture real graph complexity. In recent years, things are changing with the proliferation of online social networks (OSNs), which provides access to large traces of network dynamics.
In this dissertation, we take the opportunity by OSNs and seek to understand-ing graphs from a data-driven perspective. Followunderstand-ing this goal, we address several graph problems which are of high impact, and also with great challenges in terms of scalability, high level of graph dynamics and privacy. We use empirical
large-come in analyzing fundamental graph problems, and also investigate how we can improve by leveraging real graph datasets.
Specifically, we first work on how to analyze and model graph dynamics, and we focus on the perspective of self-similar properties. Self-similarity is a
fun-damental property which defines hard limits on network modeling. Our work identifies the presence of self-similarity in the time dynamics of social graphs, and we incorporate the findings into a complete graph evolutionary model that can accurately capture key properties from both temporal and structural aspects. We validate our model against network dynamics in two real large-scale graphs, and show that it produced desired properties in both temporal patterns and graph structural features.
In our second work, we step back and reassess the space of the fundamental graph problem, i.e., link prediction. Link prediction is the problem of predicting
formation of new edges on a given graph, and applies to networking in numerous contexts. We perform an empirical study using different large traces of network growth to reassess the predictive power of current proposals, and augment them by leverage graph dynamic data.
Finally, we are concerned with graph privacy issues, i.e., how to securely share
graph watermarks. Graph watermarks are small graphs tailor-made for a given
graph dataset, which are difficult to remove, and serve to associate to a particular user. In this work, we identify the goals and requirements of a graph water-mark system, propose our basic and improved implementation, and evaluate the effectiveness and efficiency on various large graphs.
In summary, our research work demonstrates that data-driven graph analysis provides great insights, and is key to better understanding graph properties. We have addressed important graph problems in terms of scalability, high level of graph dynamics and graph privacy, and validated our proposals on large-scale real graphs.
Contents
Curriculum Vitae vii
Abstract ix
List of Figures xv
List of Tables xx
1 Introduction 1
1.1 Dissertation Overview . . . 5
1.2 Analyzing and modeling graph dynamics . . . 6
1.3 Reassessing current status of link prediction . . . 7
1.4 Secure graph sharing system . . . 9
1.5 Contributions . . . 10
1.6 Thesis organization . . . 14
2 Analyzing and Modeling Graph Dynamics 17 2.1 Introduction . . . 17
2.2 Background and Datasets . . . 23
2.3 Preliminary Analysis . . . 28
2.3.1 Experiment Setup . . . 29
2.3.2 Measurement Results . . . 31
2.3.3 The Reliability of ourH Estimates . . . 34
2.3.4 Summary of Observations . . . 35
2.4 Wavelet-based Analysis . . . 36
2.4.1 The Wavelet Method . . . 36
2.4.2 Measurement Results . . . 37
2.5 Validation via Facebook Dataset . . . 43
2.6 A Model of Network Dynamics . . . 48
2.6.1 The Temporal Component . . . 48
2.6.2 The Spatial Component . . . 52
2.7 Model Validation . . . 57
2.7.1 Validating the Temporal Component . . . 57
2.7.2 Validating the Spatial Component . . . 64
2.7.3 Facebook Results . . . 70
2.7.4 Summary . . . 71
2.8 Related Work . . . 72
2.8.1 Self-similarity Measurements and Models. . . 72
2.8.2 Graph Models . . . 73
2.9 Summary . . . 75
3 Reassessing Current Status of Link Prediction 78 3.1 Introduction . . . 78
3.2 Background: Link Prediction . . . 84
3.3 Datasets and Methodology . . . 87
3.3.1 Datasets . . . 87
3.3.2 Methodology . . . 90
3.4 Metric-Based Prediction . . . 94
3.4.1 Experimental Setup. . . 95
3.4.2 Metric-based Prediction Accuracy . . . 96
3.4.3 Choosing Metric-based Algorithms . . . 103
3.4.4 Sources of Low Prediction Accuracy . . . 105
3.5 Classification-based Prediction . . . 108
3.5.1 Evaluation Configuration . . . 109
3.5.2 Link Prediction Accuracy . . . 113
3.5.3 Comparing to Metric-based Algorithms . . . 115
3.6 Improving Link Prediction . . . 118
3.6.1 Temporal Properties on Edge Creation . . . 119
3.6.2 Temporal Filtering . . . 122
3.6.3 Comparing to Other Temporal Methods . . . 124
3.7 Related Work . . . 126
3.8 Summary and Discussion . . . 128
4 Secure Graph Sharing System 130 4.1 Introduction . . . 130
4.4 Basic Watermark Design . . . 141 4.4.1 Watermark Embedding . . . 142 4.4.2 Watermark Extraction . . . 148 4.5 Fundamental Properties . . . 152 4.5.1 Watermark Uniqueness . . . 153 4.5.2 Watermark Detectability . . . 156
4.6 More Robust Watermarks . . . 168
4.6.1 Attacks on Watermarks . . . 168
4.6.2 Improving Robustness against Attacks . . . 170
4.6.3 Impact on Watermark Uniqueness . . . 175
4.7 Experimental Evaluation . . . 177
4.7.1 Graph Distortion from Watermarks . . . 179
4.7.2 Robustness against Attacks . . . 181
4.7.3 Computational Efficiency. . . 186 4.8 Summary . . . 189 5 Conclusion 191 5.1 Conclusion . . . 192 5.2 Lessons . . . 194 5.3 Future Work . . . 199
5.3.1 Studying More Categories of Graphs . . . 199
5.3.2 Securely Sharing Graphs . . . 201
5.3.3 User Studies in Graph Analysis . . . 203
List of Figures
2.1 Daily edge growth in Renren. . . 27 2.2 Daily edge growth in Facebook. . . 27 2.3 Edge growth in sampled dataset of Renren, in terms of the number of new edges created per second. It shows a clear diurnal pattern. . . . 32 2.4 Variance analysis of sampled dataset of Renren: the slope changes greatly when m>104 seconds (≈ 3 hours), preventing direct analysis on
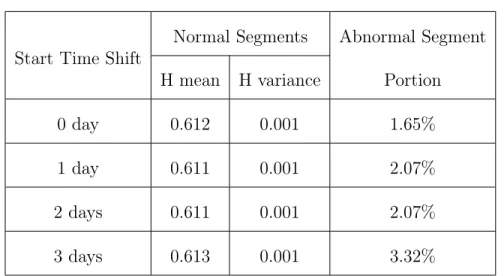
self-similarity. . . 32 2.5 R/S analysis of sampled dataset of Renren: Hestimation is beyond range of self-similarity, and data shape changes significantly for n>104 seconds (≈ 3 hours). . . 32 2.6 An example of edge growth of a randomly chosen 3-hour segment in the sampled dataset of Renren. It is highly bursty, appears stationary and suggests further exploration for self-similar scaling behavior. . . 33 2.7 Estimates of H by both Variance and R/S analysis on disjoint 3-hour segments in the sampled dataset of Renren, where 98%+ of H estimates fall within (0.5,1). . . 33 2.8 An example of poor line fitting in variance analysis, which has poor R2=0.0458. This is also confirmed by the inset which displays the raw edge growth during the corresponding time period, and shows a clearly non-stationary event. . . 34 2.9 Wavelet analysis on data segments with segment length = 3 hours (sampled dataset of Renren). . . 38 2.10 Wavelet analysis on data segments with segment length = 6 hours (sampled dataset of Renren). . . 38 2.11 Wavelet analysis on data segments with segment length = 9 hours (sampled dataset of Renren). . . 38 2.12 Wavelet analysis on data segments with segment length = 12 hours (sampled dataset of Renren). . . 38
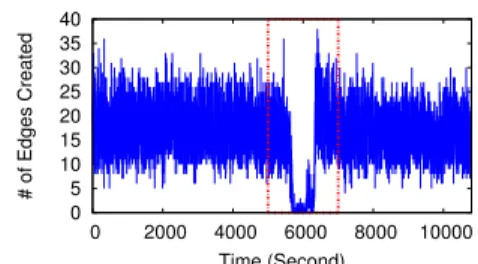
red dot boxes show the unusual edge creation events (sampled dataset of Renren). . . 41 2.14 Examples of abnormal segments in terms ofmomentary outage,
where the red dot boxes show the unusual edge creation events (sampled dataset of Renren). . . 41 2.15 Examples of abnormal segments in terms of ramp up/down,
where the red dot boxes show the unusual edge creation events (sampled dataset of Renren). . . 41 2.16 TheH-estimates of all the disjoint 3-hour segments between Septem-ber - DecemSeptem-ber 2007 of the Renren dataset, after performing wavelet analysis on the entire dataset without sampling (full Renren). The re-sults align with those with sampling (labeled as “sampled dataset of Renren” in caption). . . 42 2.17 An example of edge growth of a randomly chosen 3-week data (Facebook). . . 44 2.18 Variance analysis on the entire data: doubtable fitting with curves around 103 units (Facebook). . . 45 2.19 R/S analysis on the entire data: doubtable fitting since the shape changes greatly after 103 units (Facebook). . . . . 45
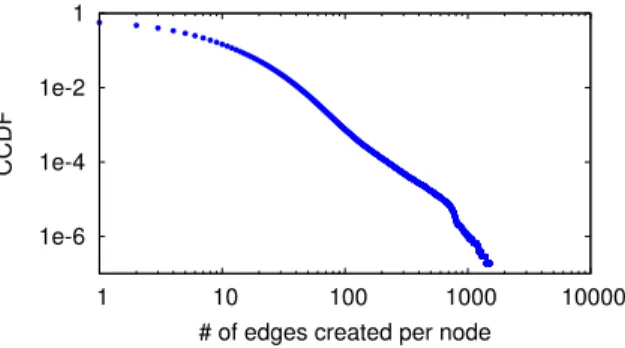
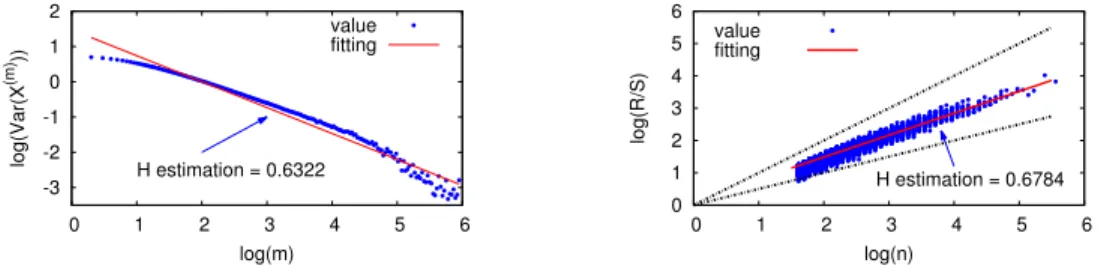
2.20 Wavelet analysis on data segments with segment length = 3.5 days (Facebook). . . 46 2.21 Wavelet analysis on data segments with segment length = 5 days (Facebook). . . 46 2.22 Wavelet analysis on data segments with segment length = 7 days (Facebook). . . 46 2.23 CCDF of # of edges created per user in Dec. 2007 in Renren dataset. 50 2.24 An example of edge growth of a randomly chosen 3-hour segment in the synthetic self-similar module (Renren). . . 60 2.25 Variance analysis of synthetic self-similar module: H estimation = 0.67, and in good linear fitting (Renren). . . 60 2.26 R/S analysis of synthetic self-similar module: Hestimation = 0.63, and in good linear fitting (Renren). . . 60 2.27 The synthetic non-stationary module (red curve) well captured the smoothed diurnal pattern in the original dataset (blue curve) (Renren). 61 2.28 Synthetic trace by our temporal component (red) vs. original edge creation process (blue) (Renren). . . 61 2.29 Variance analysis of the entire synthetic trace: like the original data, slope also changes for m>104 seconds (≈3 hours) (Renren). . . . 61
estimate is beyond the self-similar range, and data shape changesn>104
seconds (≈ 3 hours) (Renren). . . 61
2.31 Wavelet analysis on 3-hour segments of synthetic trace. Like the original data, the vast majority of segments have estimated H within (0.5,1) (Renren). . . 62
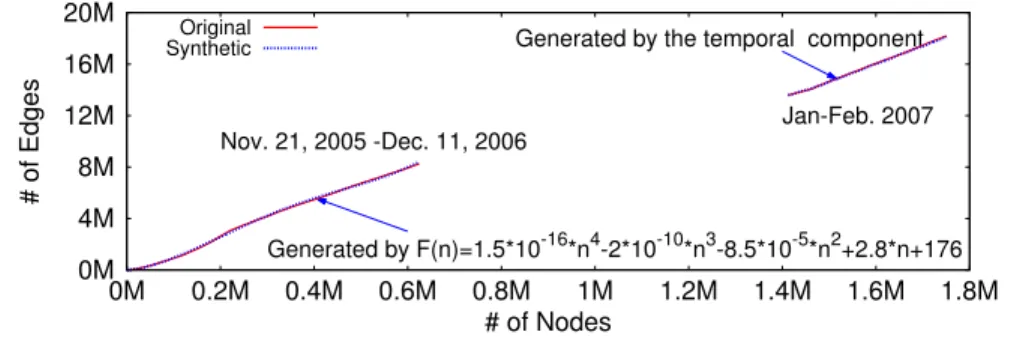
2.32 Network growth of the synthetic trace generated by the temporal component vs. the original data (Renren). . . 63
2.33 Fitting of network growth with the network edge growth function F(n) (Renren). . . 65
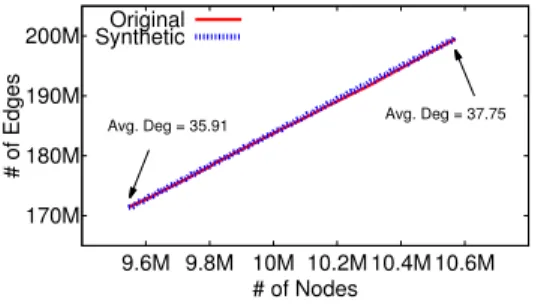
2.34 Average path lengthon generated synthetic graphs and the orig-inal Renren graph. Include two time periods from the very beginning to December 11, 2006 and in January - February, 2007 (to avoid the one-time merge event in Renren with another OSN). (Original: Renren graph; Spatial Component: graph generated by our spatial component; PA: graph generated by the preferential attachment model; Forest Fire: graph generated by the Forest Fire model).. . . 67
2.35 Average Clustering Coefficient on generated synthetic graphs and the original Renren graph. Include two time periods from the very beginning to December 11, 2006 and in January - February, 2007 (to avoid the one-time merge event in Renren with another OSN). (Origi-nal: Renren graph; Spatial Component: graph generated by our spatial component; PA: graph generated by the preferential attachment model; Forest Fire: graph generated by the Forest Fire model).. . . 68
3.1 Daily new nodes and edges in the three networks. . . 89
3.2 Average node degree. . . 90
3.3 Average path length. . . 90
3.4 Average clustering coefficient. . . 90
3.5 Link prediction performance for Renren dataset. . . 99
3.6 Link prediction performance for Facebook dataset. . . 99
3.7 Link prediction performance for YouTube dataset. From Fig-ure 3.5 to FigFig-ure 3.7 we show accuracy ratio of all metric-based predic-tion algorithms. We omit the results of CN, AA and RA because they perform similarly (slightly worse) than their Local Naive Bayes versions, i.e. BCN, BAA and BRA. The results for Katzlrin Renren and YouTube are capped to 65M and 5.5M edges due to computation complexity. . . 99
3.8 Visualization of classification results on choosing the best metric-based algorithm. . . 103 3.9 Degree distribution of nodes in predicted edges (Renren,55M edges). 106
3.11 Accuracy ratio of four classifiers with undersampling ratio θ 1:1 and 1:50 (Facebook, 345K edges). . . 112 3.12 Performance of classification-based prediction as a function of the under-sampling ratio θ used during classifier training. . . 114 3.13 Comparing the prediction performance of metric- and classification-based prediction algorithms. . . 115 3.14 The relationship between top similarity metrics and top SVM fea-tures, shown as the total normalized SVM coefficient of top N similarity metrics, N=1,2,...,14. . . 117 3.15 CDF of active node idle time in a Renren snapshot. . . 120 3.16 CDF of new edges created in the past 7 days by a node in a Renren snapshot. . . 121 3.17 CDF of CN time gap of positive and negative node pairs in a Renren snapshot. . . 121 3.18 Our proposed temporal filtering method outperforms time-based models. . . 125 4.1 Embedding graph watermarks. Ωis a secret random generator seed produced using the secure graph key and user’s private key. . . 137 4.2 Extracting graph watermarks. Ωiis a secret random generator seed
produced using the secure graph key and the private key of user i. . . . 138 4.3 Robustness of basic design against single attacker model, LA.. . . 183 4.4 Robustness of the basic design against single attacker model, Flickr. 183 4.5 Distortion caused by single attacker model in the basic design, LA. 183 4.6 Distortion caused by single attacker model in the basic design, Flickr. 183 4.7 Robustness of the improved design against single attacker model, LA. . . 184 4.8 Robustness of the improved design against single attacker model, Flickr. . . 184 4.9 Distortion caused by single attacker model in the improved design, LA. . . 184 4.10 Distortion caused by single attacker model in the improved design, Flickr. . . 184 4.11 Robustness of the improved design against collusion attacker model, LA. . . 185 4.12 Robustness of the improved design against collusion attacker model, Flickr. . . 185 4.13 Distortion caused by collusion attacker model in the improved de-sign, LA. . . 185
List of Tables
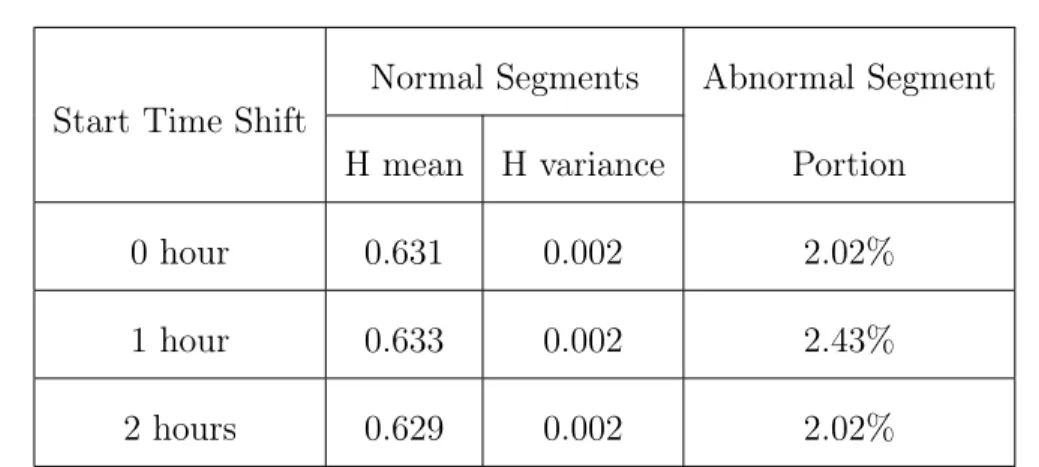
2.1 Statistics of the two OSN datasets, with the start/end date of the traces, the granularity of time stamps in the traces, the total count of nodes that have been involved in edge creation, and the total count of edges that have been newly created in the traces. . . 26 2.2 Statistics of wavelet analysis on 3-hour segments with start time shifts. (sampled dataset of Renren) . . . 39 2.3 Statistics of wavelet analysis on 3.5-day segments with start time shifts (Facebook). . . 47 2.4 Statistics of the original graph and the synthetic graph generated by our spatial component for Renren dataset. The 2006 graphs are built before December 12, 2006; the 2007 graphs are built for January -February, 2007. . . 64 2.5 Statistics of the original Facebook graph, the synthetic graph gen-erated by our spatial component, by the Forest Fire model and by the Preferential Attachment model. Path length and clustering coefficient (CC) do not consider multiple edges between node pairs. All standard deviations are less than 4%. Columns 2-4 refer to averaged results for intermediate graph snapshots, Columns 5-8 refer to the final graph snap-shot (Facebook). . . 71 3.1 Summary of link prediction algorithms, with details listed in Ta-ble 3.3. . . 85 3.2 Statistics of the three OSN datasets. . . 88 3.3 The 14 metric-based algorithms used for our study. Notations: given graph G =< V, E >, u and v are two graph nodes, Γ(u) denotes the neighbors of node u, deg(u) represents the node degree ofu. . . 93 3.4 Best possible absolute accuracy (%) of all prediction methods on each dataset. . . 97
frequently predicted nodes (Renren snapshot with 55M edges). . . 107 3.6 Data instances for evaluating classification algorithms. . . 111 3.7 Parameters of the temporal filters.. . . 123 3.8 Ratio of accuracy values after filtering vs. before filtering for all metric-based and classification methods. Bold value in each row is the maximum improvement for that network; “-” means the accuracy before filtering is “0”. *Ratio in Renren is 1:5000. . . 123 4.1 Statistics of 48 of today’s network graphs. k is the watermark size. 158 4.2 Suitability of watermarking for 48 of today’s network graphs, deter-mined by comparing their node degree distribution [Nmin(G), Nmax(G)]
and k-node subgraph density [Dmin(k), Dmax(k)] to those of the
em-bedded watermark graphs. 35 out of these 48 graphs are suitable for watermarking. . . 160 4.3 Size and density of subgraph on nodes with degree > (k + 1)/2 in each graph. Size is the number of subgraph nodes, and density is quantified as average edges each node having inside the subgraph. . . 164 4.4 Upper bound of L for the 35 network graphs.. . . 178 4.5 Percentage of modified nodes/edges after embedding5watermarks into a graph and dK-2 Deviation. . . 181 4.6 The efficiency of the watermarking system, including watermark embedding time on one server, the extraction time on one server and the parallel extraction time across 10 servers. . . 187
Chapter 1
Introduction
The proliferation of networks have changed people’s lives today more than ever before [73, 134]. There are ever-expanding demands for network utilities, from technology networks like the Internet and telephone networks, social net-works like Twitter and Facebook where people share their everyday life, infor-mation networks like World Wide Web, to even biological networks like neural networks. As fundamental abstraction for networks, graphs model the connec-tions in a network and set the basis to systematically analyze and understand networks. Graphs are applicable to various of networks, and many of today’s datasets are captured in large dynamic graphs. Such datasets can include maps of autonomous systems in the Internet, social networks representing billions of
friendships, connected records of patent citations, and interaction of proteins in personal health care.
Analyzing graphs is critical to provide insights on the fundamental process that drive the evolution of networks, and the basis for many real world applica-tions. For example, studying dynamic social graphs is key to accurately predicting resource needs and system behavior in online social networks, and important for various applications including system design, resource allocation, anomaly de-tection, demand forecasting and advertising [29, 62, 131]. Another prominent example is that graph analysis has set the foundation for social recommendation systems [53, 89], which is widely used in social networks and applications, e.g.,
ranging from Facebook, Twitter and LinkedIn, to photo sharing on Instagram and Pinterest, personal streaming on Periscope and Q&A sites like Quora.
Despite years of research in this space and hundreds of or maybe even thou-sands of publications [7, 10, 11, 17, 22, 31, 39, 53, 62, 89, 90, 91, 109, 111, 129, 130, 133, 150, 153] (only a small subset of which is cited in this dissertation), there has been little opportunity to study graphs from an empirical perspective, and prior studies are often hampered by limitations in the size and granularity of public available datasets, which cannot accurately capture real graph complexity. For example, most work in graph dynamics study graphs via static snapshots,
in-formation about events that occur between snapshots. Even for those that have analyzed graph traces in more fine granularity, they are often limited to moder-ate sized networks like co-authorship studies and pmoder-atent citation graphs, which scale up to around 20K nodes and 200K edges [15, 130]. In contrast, graph algo-rithms/systemsdeveloped using and validated by these datasets are often targeting dynamic networks that are two or more orders of magnitude larger, with millions or billions of nodes and billions of edges [161].
Thankfully, things are changing with the arrival of network traces from on-line social networks (OSNs). We are taking advantage of this opportunity and availability to large traces of network dynamics to understand graphs from a data-driven perspective. We can use empirical datasets to study new graph top-ics, step back and reassess how far we have come in analyzing certain problems, and also investigate how we can improve by leveraging real graph datasets. At the same time, we are also faced with great challenges, since real large graph traces may have quite different properties. We list three primary challenges as follows:
1. Scalability. Many current graph tools have too high computational
complex-ity to be scaled to empirical graphs [32, 119, 142], since they are developed or validated by small or moderate sized graphs. How can we adapt them or design new graph tools that are applicable to graphs with millions or billions of nodes is quite challenging.
2. High level of dynamics. Real graph traces often have high volume of
dy-namics, which prior studies have seldom dealt with. For example, Facebook has over 890 million login events and 4.5 billion likes every day [59], and Instagram has more than 80 million photos uploaded daily and 3.5 billion daily likes [118]. We need to understand and model such dynamics.
3. Graph privacy. There are huge concerns for graph privacy [14, 91, 107] since
graph topology may represent very sensitive information from real world,
e.g., users’ social relationship or even the strength of such relationship. It
1.1
Dissertation Overview
Motivated by the new opportunities and challenges by large-scale empirical graph datasets, I have focused on graph research from data-driven perspective, and formalized the following statement of this dissertation:
Using large traces of network dynamics, we can build graph tools to
meet challenges from scalability, dynamics, and data privacy.
Driven by this statement, we have tackled problems from three aspects. First, we work on how to analyze and model detailed graph dynamics, and we focus on the perspective ofself-similarproperties. Self-similarity is a fundamental property
which defines hard limits on network modeling [75]. Our work identifies the pres-ence of self-similarity in the time dynamics of social graphs, and we incorporate the findings into a complete graph evolutionary model that can accurately capture key properties from both temporal and structural aspects. Second, we step back and reassess the space of the fundamental graph problem, i.e., link prediction.
Link prediction is the problem of predicting formation of new edges on a given graph, and applies to networking in numerous contexts [68, 70, 53]. We perform an empirical study using large traces of network growth to reassess the predictive power of current proposals, and augment them by leverage dynamic data. Finally, we are concerned with graph privacy issues, i.e., how to securely share large-scale
can provide limited protection, and we provide a new alternative in the form of
graph watermarks. Graph watermarks are small graphs tailor-made for a given
graph dataset, which are difficult to remove, and serve to associate to a particular user. In this work, we identify the goals and requirements of a graph watermark system, propose our implementation, and evaluate the effectiveness and efficiency on various large graphs.
In the following, we briefly describe works included in this dissertation.
1.2
Analyzing and modeling graph dynamics
Analyzing and modeling social network dynamics are key to accurately predict-ing resource needs and system behavior in online social networks. The presence of statistical scaling properties, i.e., self-similarity, is critical for determining how
to model network dynamics. Self-similarity refers to the invariance behavior of a time series under rescalings,i.e., the relative variance or volatility of traffic traces
stays similar across different time scales [20, 75]. It is a fundamental statistical property which defines hard limits on traditional network models like Poisson [75]. In this work, we study the role that self-similarity scaling plays in a social network edge creation (i.e., links created between users) process, through analysis
of two detailed, time-stamped traces, a 199 million edge trace over two years in the Renren social network, and 876K interactions in a four year trace of Facebook.
We find that traditional R/S and Variance methods are unsuitable for measuring self-similarity in real traces of social graphs. Using the more advanced tool, i.e.,
wavelet-based analysis, we find that the edge creation process in both networks is consistent with self-similarity scaling, once we account for periodic user activity that makes edge creation process non-stationary.
Using these findings, we build a complete model of social network dynam-ics that combines temporal and spatial components. Specifically, the temporal behavior of our model reflects self-similar scaling properties, and accounts for cer-tain deterministic non-stationary features. The spatial side accounts for observed long-term graph properties, such as graph distance shrinkage and local decluster-ing. We validate our model against network dynamics in Renren and Facebook datasets, and show that it succeeds in producing desired properties in both tem-poral patterns and graph structural features.
1.3
Reassessing current status of link prediction
In this work, we seek to understand current status of fundamental graph prob-lem,i.e., link prediction. Link prediction is the problem to of predicting formation
of new edges on a given graph. It is a fundamental problem that applies to net-working in numerous contexts, and has tons of applications [68, 70, 53]. However, there has been little opportunity to study various link prediction proposals from
an empirical perspective due to the limitation of publicly available datasets. Until recently, validation of algorithms have been hampered by limitations in the size and realism of empirical datasets. More specifically, such public datasets are of-ten limited to co-authorship studies and paof-tent citation graphs, moderate sized networks that lack dynamic details [15, 130]. In contrast, algorithms developed using and validated by these datasets are targeting dynamic networks that are many orders of magnitude larger, and much more dynamic [161].
With our access to several large, detailed traces of dynamics in online social networks (Facebook, Renren, YouTube), we seek to revisit and reassess the value and accuracy of current prediction methods. Our goals are to understand the ab-solute and comparative accuracy of existing prediction algorithms, and to develop techniques to improve them using insights from analysis of network dynamics.
We implement and evaluate 18 link prediction algorithms, labeled as either “metric-based” (those that predict potential links using a single similarity or prox-imity metric) or “classification-based” (those that use machine learning classifiers with multiple metrics as input features). Despite poor performance in absolute terms, SVM classifiers consistently perform the best across all our traces. Its ac-curacy is occasionally matched by metric-based algorithms, but never consistently across datasets.
Finally, we dig sources for overall low accuracy of today’s prediction algo-rithms, and use our observations of network dynamics to build “filters” that dra-matically reduce the search space for link candidates. Augmenting current algo-rithms with our filters dramatically improves prediction accuracy across all traces and algorithms, even for algorithms that were already designed to capture network dynamics [37].
1.4
Secure graph sharing system
From network topologies to online social networks, many of today’s most sensi-tive datasets are captured in large graphs. A significant challenge facing the data owners is how to share sensitive graphs with collaborators or authorized users,e.g.,
ISP’s network topology graphs with a third party networking equipment vendor. Current tools like building strong access control mechanisms, or modifying data to reduce the impact of potential leakages [91, 54, 128] can provide limited node or edge privacy, but significantly modify the graph reducing its utility.
In this work, we propose a new alternative in the form of graph watermarks. Graph watermarks are small graphs tailor-made for a given graph dataset, which are difficult to remove, and serve to associate to a particular user. When a data owner wants to share her graph with multiple users, she first generates a special subgraph,i.e., a graph watermark, for each user. She then embeds each watermark
into the original graph to get a watermarked graph separately, and distributes this graph to the corresponding user. If any watermarked graph is leaked, data owner uses the original graph to extract the embedded watermark, and identify who is responsible for the leakage. Then data owner can use this proof to seek potential damages against that user. Knowing the existence of such a way to track for responsibility, users would be more cautious with the shared data. Our graph watermarks serve both as a deterrent against data leakage and a method of recourse after a leak.
We provide robust schemes for embedding and extracting watermarks, and use analysis and experiments on large real graphs to show that they are unique and difficult to forge. We study the robustness of graph watermarks against both single and powerful colluding attacker models, then propose and evaluate mechanisms to dramatically improve resilience.
1.5
Contributions
In this dissertation, the key contribution is to carry out data-driven graph analysis from large-scale real datasets, where we have built graph tools to meet challenges from scalability, dynamics, and data privacy. We have provided novel algorithms, models, and systems to capture properties of large-scale real graphs, guided by our measurements. We have also revisited and evaluated the current
status of fundamental graph problem to understand how far existing work has gone in this area. Besides, we have verified our solutions using rigorous theoretical analysis, experiments on a range of big real graphs and detailed simulations. In the following, we list our detailed contributions.
Novel Algorithms, Models and System Designs. We have designed
novel algorithms/models/systems to address the key challenges from data-driven graph analysis on big real graphs. In Chapter 2, when we try to explore the ex-istence of self-similarity property, we explored different detection algorithms and identified a reliable tool for dynamic social graphs. Based on our findings, we have proposed a novel dynamic graph model, which combines a temporal com-ponent that accounts for “when” and “how many” edges are created, and also a spatial component that captures “where” those edges are distributed. This is the first model to comprehensively capture the evolutionary dynamics of graphs from different aspects at fine granularity. Also, in Chapter 3, after we have evaluated the predictive power of existing link prediction algorithms and studied the causes for overall low prediction, we have provided “temporal filters” that can greatly improve the prediction, by pruning the search space for potential links. And in Chapter 4, to securely share graphs, we have overcome the limitations of current solutions by providing a new alternative in terms of graph watermarks. We are the first to identify the goals and requirements of a graph watermark system. We
have also described an initial design that efficiently embeds watermarks into and extracts out of large graphs, and with low distortion of the graph data.
Identifying Fundamental Challenges/Limitations. We have revisited
the fundamental graph problem, i.e., link prediction, and explored the existence
of fundamental statistical property in graph dynamics, i.e., self-similarity. We
have identified some fundamental/practical challenges faced by those problems. In Chapter 3, we are the first to evaluate existing link prediction solutions from an empirical angel, i.e., on large-scale dynamic graph traces. We have found the
overall low predictive power of all existing solutions, and dug sources of such low prediction accuracy from both structural and temporal aspects. We have found that one fundamental contributing factor is that current prediction algorithms take a purely static approach to network analysis, and do not take in account temporal patterns exhibited by an evolving network. In Chapter 2, we have proved when detecting self-similar property on real traces in social graph dynamics, how tradi-tional tools produce inconclusive results because of the underlying deterministic trends by human behaviors. We have also validated the suitability of a more advanced and robust tool in such scenario.
Theoretical and Experimental Validation. We have validated our
pro-posed solutions using theoretical analysis, experiments on various large-scale graph datasets, and also simulated attacks if needed. In Chapter 2, both our
measure-ment for the existence of self-similarity property, and our proposed model for graph dynamics are based on two large-scale datasets: Renren, with 200M edges and 11M nodes at the end of the trace, and Facebook, with 877K edges and 47K nodes over a four-year period. By showing that our model produces dynamic traces that match key properties of the two original traces, we have proved that our model provides a practical method for generating realistic traces and has filled an existing void in this research community. In Chapter 3, we have applied our proposed “temporal filter” to existing solutions, and tested on different large-scale graphs, including Renren, Facebook and YouTube. We show that by leveraging temporal information on network dynamics using our filters, we can effectively improve link prediction accuracy. And we have also confirmed the generality of our filtering method. In Chapter 4, we have provided a strict theoretical proof of uniqueness of graph watermarks, showing that it is extremely difficult for attack-ers to forge watermarks. We have also tested the suitability of watermarking to 48 of today’s real network graphs, which represent vastly different types of networks and a wide range of structural topologies with size ranging from 10K nodes and 39K edges, to 5M nodes and 48M edges. Results support our assertion that our watermarking mechanism is applicable to most of today’s network graphs with low detection risk. Besides applicability, we have also validated our watermark
system in terms of robustness agains attacks, distortion, uniqueness, and efficiency on several larger network graphs.
1.6
Thesis organization
The rest part of this dissertation is organized as follows:
In Chapter 2, we elaborate our efforts to analyze and model graph dynamics. Following the background and description of datasets, we carry out preliminary analysis with two traditional tools to detect the existence of self-similarity. From the initial analysis, we find the edge creation process in social graphs display a typical periodical pattern in user activity, and potential self-similarity properties at certain time scales. However, because of the existence of periodical patterns, both traditional tools fail to provide reliable detection results. We then apply a more rigorous method to systematically study potential self-similar properties, and validate its obvious existence over smaller time scales and fading away at larger time scales. Motivated by the self-similarity analysis, we next seek to build a complete model of graph dynamics. We propose a model with two components: a temporal component that produces a sequence of time-stamped events defining whenand how manynew edges are formed in a given time interval, and a spatial
component defining where in the graph these new edge creations take place.
model using real data and use it to generate synthetic dynamics graphs, and then compare these synthetic graphs to the original data in terms of both temporal and spatial properties.
In Chapter 3, we present our work on revisiting the fundamental graph prob-lem, i.e., link prediction. We first introduce different categories of link prediction
algorithms: metric-basedandclassification-basedalgorithms. We then present two
key questions we want to ask in our efforts to study this problem, our proposed graph sequence based framework for evaluation, and 18 implemented algorithms. The empirical evaluation begins with metric-based prediction algorithms, where we seek to understand their prediction accuracy, and they key factors that lead to prediction errors. Later we evaluate classification-based algorithms in practi-cal scenarios and compare their results to metric-based algorithms. Finally, we improve existing algorithms by integrating them with dynamic network analysis, where we propose temporal filters to drastically reduce the search space for link
candidates. Our proposed solution can even augment algorithms that are already designed to capture network dynamics.
In Chapter 4, we introduce the design of graph watermark system. To set the context for the design, we first introduce the framework of graph watermark systems, define the attack models we target, and use them to guide our design goals. We then describe in details the basic design, which seeks to embed and
extract watermarks on graphs to achieve watermark uniqueness while minimizing distortion on graph structure. Later we present detailed analysis on two funda-mental properties: watermark uniqueness, where each watermark must be unique
to the corresponding user, and watermark detectability, where the presence of a
watermark should not be easily detectable by external users. Because in prac-tice, attackers can seek to detect or destroy watermarked graphs, we propose advanced features to defend against corresponding attacks. We finally use real network graphs to evaluate the performance of the graph watermarking system in terms of key metrics: false positives, graph distortion, watermark robustness, and computational efficiency.
Chapter 2
Analyzing and Modeling Graph
Dynamics
2.1
Introduction
1 Studying graph dynamics,i.e. graph evolution including detailed timings of
when nodes arrive and edges are created, is important for many network appli-cations, from system design, resource allocation, anomaly detection, to demand forecasting. Prior studies of graph dynamics are typically based on randomized, generative graph models that produce sequences of events leading to an observed
1©ACM, (2016). This is the authors version of the work. It is posted here by permission of
ACM for your personal use. Not for redistribution. The abbreviated version of content in this chapter was published in Journal ACM Transactions on Modeling and Performance Evaluation of Computing Systems (TOMPECS) [93], http://doi.acm.org/10.1145/2994142.2342440.
network structure [65, 84, 10, 9, 109, 155]. Focusing primarily on producing a graph with some desired structural properties, they do not model or match the sequence of dynamic events that lead to that structure. With the proliferation of online social networks (OSNs) and thus access to real, large-scale traces of graph evolution, there are increasing number of literature in analyzing and modeling social graphs [133, 153, 62, 130, 39, 31, 22]. However, graph dynamics are still poorly understood. Current methods often study them viastaticsnapshots, which
capture graph dynamics only at discrete points in time, and lack time information about events that occur between snapshots.
Our work seeks to address this need by studying detailed dynamics in “time-stamped” traces of network growth. While most/all existing work analyze and model dynamics using logical clocks, we examine the relationship between
net-work dynamics and real physical clocktime. Specifically, the use of physical time
allows us to tackle two significant challenges in the modeling of network dynam-ics. First, physical time allows us to determine if social network dynamics exhibit
self-similarity, an invariance of behavior at different time scales. Self-similarity
is a fundamental statistical property, that if discovered, defines hard limits on how such dynamics can be modeled using traditional means, e.g. Poisson. Its
detection in contexts such as network traffic and web traffic has led to significant shifts in how such datasets were analyzed and modeled.
Second, analysis of a physical time trace allows us to build a model of OSN dynamics that captures not only structural properties of the network, but also the sequence of dynamic events leading to that structure. This type of dynamic graph model would address several practical OSN problems. First, the research community has repeatedly expressed a need for real dynamic graph traces. Using a real trace for calibration, our model can generate “realistic” dynamic graphs with a complete list of time-stamped network events. Next, our model can be used to perform “interpolation,” i.e. construct complete dynamic graph traces that
approximate the continuous network evolution between successive static snapshots of OSNs. Finally, our model can be used to detect abnormal events (attacks or changes in user behavior) in real networks, i.e. events that disrupt expected
network dynamics.
In this chapter, we perform an empirical study of network dynamics by examin-ing of network events over multiple years. For this Our work relies on two detailed, time-stamped traces of social networks, theRenren dataset [161] (complete,
time-stamped trace of 199 million social links over 2 years) and the Facebook wall post
dataset [72] (876K wall posts between users over 4 years in a Facebook regional network). To the best of our knowledge, these are the only datasets available today with sufficient granularity and event frequency to provide accurate analysis on network dynamics and self-similarity.
Self-similarity based Network Analysis. Self-similarity refers to the
in-variance behavior of a time series under rescalings, i.e. the relative variance or
volatility of traffic traces stays similar across different time scales2. Successful
detection of self-similar properties is a very meaningful result (for network model-ing), because it defines fundamental limits on how such datasets can be modeled using traditional means. Due to its very different statistical properties,e.g.
signif-icantly higher burstiness,self-similar traffic cannot be easily captured or modeled
by popular traffic models. In recent years, self-similarity has been found and led to changes in data modeling in variety of contexts, including local network traf-fic, wide-area network traftraf-fic, file system accesses, disk-level I/O, messaging and email communications and web traffic requests [75, 115, 36, 50, 122, 44, 126, 41]. In each case, the discovery of self-similar scaling properties led to a noteworthy shift in how such datasets were analyzed and modeled.
It is challenging to detect and quantify self-similar scaling properties in real network traces in a statistically rigorous manner. This is partially due to the likely presence of patterns (e.g. deterministic trends and diurnal or weekly cycles) that
introduce non-stationarity. The edge creation process may be consistent with self-similar scaling over time scales ranging from seconds to hours. But patterns like
2Self-similarity can be used to describe scale invariance of certain properties of an object in
space and/or time. In this paper, we adopt thetemporalmeaning,i.e. self-similarity along the time dimension.
diurnal or weekly user cycles likely dominate over larger time scales like days and weeks, and need to be accounted for before any self-similarity analysis. Intuitively, we seek to not only detect self-similar scaling properties in edge creation process, but also determine time scales where self-similarity is visible and can be quantified. Thus we use a range of techniques including R/S analysis, the variance fitting method, and a wavelet-based method. And our analysis focuses on edge creation, mainly because an exploratory analysis of the Renren data revealed no particular structure underlying the observed node creation events.
A Model of Social Network Edge Dynamics. We incorporate the
find-ings from our self-similarity analysis into a complete evolutionary network model, including atemporalcomponent that determines “when” new edge creations occur
in time, and a spatial component that specifies “where” these new edges form.
Together, this model produces a sequence of time-stamped events that uniquely define the formation and evolution of a social network or graph in time and space. By tuning a small number of parameters, our model can be calibrated to “fit” traces of measured graph dynamics exhibiting self-similar properties. We vali-date the model by comparing the model-generated edge creations to that of the real data (Renren and Facebook). Our results on both datasets show that the synthetic edge creation matches both the self-similar scaling behavior and the di-urnal patterns exhibited by the real data. Furthermore, successive snapshots of
the graph structure generated by our model match the corresponding snapshots of the original data on a variety of metrics, including average path length and average clustering coefficient.
We summarize our five key contributions in this chapter as follows:
First, we find that Renren’s edge creation process is non-stationary over long-term periods. Even after removing the impact of node arrivals, traditional R/S and variance methods still produce inconclusive results on self-similar scaling. Thus, the two methods are unsuitable for measuring self-similarity in real traces in social networks. (see Section 2.3)
Second, by applying the more robust wavelet-based method for examining self-similarity, we find the edge creation process in Renren does exhibit properties consistent with self-similarity over time scales ranging from seconds to hours. We find the wavelet-based method to be highly robust detecting self-similarity in the presence of non-stationary trends. (see Section 2.4)
Third, We cross-validate our observations by repeating the above analyses on the Facebook wall post dataset, and confirm that it exhibits similar self-similarity properties observed from the Renren dataset. (see Section 2.5)
Forth, we propose a detailed model of social network dynamics that captures both the temporal properties of graph dynamics, in terms of self-similar scaling and deterministic non-stationary periodic patterns like diurnal or weekly cycles
of user activity, and its spatial properties, including long-term graph distance shrinkage and reduction in local clustering. (see Section 2.6)
Finally, we validate our model by showing that it produces dynamic traces that match key properties of the original Renren and Facebook datasets, both temporally and spatially. Thus, by providing a practical method for generating realistic traces of time-stamped network events, our model fills an existing void in the research community. (see Section 2.7)
To the best of our knowledge, our work is the first to empirically study the presence of self-similarity in the time dynamics of online social networks (OSNs). Our findings highlight that instead of traditional Poisson models, the dynamics of real-world networks such as Renren social graph can often be adequately captured by a combination of a non-stationary component, e.g. long-term deterministic
trends, and a stationary component, e.g. self-similar process. We believe that
our model is the first to explicitly account for both temporal and spatial features in network dynamics and addresses an urgent need for accurate models of graph dynamics.
2.2
Background and Datasets
In this section, we introduce briefly the notion of self-similarity, and describe the Renren and Facebook dataset used in our study.
Self-similarity. For a time process, self-similarity refers to an invariance
be-havior, where certain statistical properties are similar under appropriately rescaled versions of the process [20, 75, 35]. Self-similarity has been observed in a variety of contexts in computing systems and networks, including web traffic [36], file system accesses [50], and traffic in both wide area networks [115] and local Ether-net Ether-networks [75]. For self-similar traffic, the aggregation of many bursty sources remains bursty across a wide range of time scales. This behavior is quite different from conventional Poisson processes that tend to produce traffic that smoothes out when observed over large time scales. While self-similarity can also be asso-ciated with geometry and describe the invariance in hierarchical structures [136], this work focuses on the temporal domain3.
To formally define self-similarity, let X = {Xi : i = 1,2, ...} be a covariance
stationary stochastic process whose autocorrelation function r(k) ∝ k−β (0 < β < 1) as k → ∞. For each integer m (m > 0), we form a new process X(m)
representing the averaged values of X over disjoint blocks of sizem. That is, the jth element of X(m) is:
Xj(m) = 1
m(X(j−1)m+1+X(j−1)m+2+...+Xjm), j = 1,2, ... (2.1)
If X is self-similar, then r(m)(k), the autocorrelation function of X(m), should
satisfy [50, 75]:
r(m)(k) =r(k), or r(m)(k)→r(k), m→ ∞. (2.2) An effective and commonly used metric to detect the existence or quantify the degree of self-similarity is theHurst parameterH, measurable in multiple ways [5, 75]. Intuitively, H helps to capture the “burstiness” of a covariance stationary process, where a higherHcorresponds to a process with more pronounced “bursts”,
i.e. large observations have a tendency to be followed by large observations, and
small observations by small ones. Formally,H = 1−β/2, whereβ is defined by the processX’s autocorrelation functionr(k)∝k−β. A process exhibits self-similarity
if H falls in the range of (0.5,1).
Ideally, the finite-dimensional distributions of a self-similar process should stay invariant across all time scales. In reality, this property often exists at smaller time scales, but breaks down at large time scales due to non-stationary patterns and finite datasets [46, 50]. For example, diurnal user activity breaks stationarity and interferes with self-similarity at time scales larger than a few hours. Thus, analyzing for self-similarity requires determining the range of time scales over which it is visible [5, 46, 50].
Datasets. An Online Social Network (OSN) is an online platform to build
real-Graph Trace Start Date Trace End Date Granularity # of Nodes # of Edges Renren (Non-sampled) [161] 11/21/05 12/31/07 Seconds 10,572,832 199,564,006 Facebook (New Orleans) [72] 09/14/04 01/22/09 Seconds 46,952 876,993
Table 2.1: Statistics of the two OSN datasets, with the start/end date of the traces, the
granularity of time stamps in the traces, the total count of nodes that have been involved in edge creation, and the total count of edges that have been newly created in the traces.
life connections4. While many have diverse features, they typically share features
that allow individuals to construct an own page or profile, and build connection with other users, e.g., friending others. When modeling OSNs, an individual user
is usually regarded as a “node”, while the relationship between a pair of users as an “edge”, or a “link”.
Our analysis is based on OSNs: Facebook and Renren, where our work is the first to empirically study the presence of self-similarity in the time dynamics of OSNs. Facebook is the world’s most popular online social network with over 1.5 billion users5, while Renren is the Chinese version of Facebook, the largest
and oldest OSN in China with more than 220 million users [62]. For both sites, a registered user can create her profile, add other users as “friends”, and post messages on others’ wall (called “wall posts”), an area on each user’s own profile where others (usually friends) can make comments.
4https://en.wikipedia.org/wiki/Social_networking_service 5https://en.wikipedia.org/wiki/Facebook.
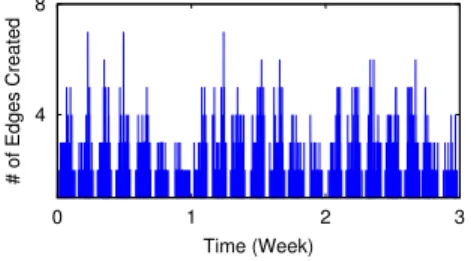
101 104 107 0 200 400 600 800 # of Edges Created Time (Day)
Figure 2.1: Daily edge growth in Renren.
1 102 104 0 400 800 1200 1600 # of Edges Created Time (Day)
Figure 2.2: Daily edge growth in Facebook.
We show the summarized statistics of the two datasets in Table 3.2. The first and primary is an anonymized dataset from Renren [161], with a detailed time-stamped (down to the second) trace of the creation of all nodes (10,572,832) and all edges (199,564,006) over a 25-month period from Nov. 21, 2005 (the launch of Renren) to Dec. 31, 2007. Here an edge is created when two users become friends. To the best of our knowledge, this is one of the largest time-stamped datasets on social network evolution studied to date.
Figure 2.1 plots the daily edge growth of the Renren social network, where data points represent the number of new edges created on each day. This plot
shows that the dataset covers both the initial explosive growth (from day 1 to around day 200) and the stabilized evolution of the Renren network [161]. Note the unusually large spike on day 386 (Dec. 12, 2006). This is the result of a merging event - Renren merged with 5Q, its largest Chinese competitor at that
time. The network doubled in size in a single day, growing from 624K users and 8.2M links to 1.3M users with 11.2M links. Given it is a one-time event, we
exclude it from our analysis, and focus in our study on continuous data segments before or after the merge.
The second dataset is the Facebook wall post dataset6 [72]. It contains wall
posts produced by users from the Facebook New Orleans regional network, i.e.
46,952 users and 876,993 posts created over a four-year period from Sep. 14th, 2004 till Jan. 22nd, 2009. Each post is also time-stamped to the granularity of a second. Like [153], we consider each wall post as an edge representing an interaction between two users. Figure 3.6 plots the daily edge growth of the Facebook social network. Like Renren, this dataset also covers periods where edge creation events increase significantly at the beginning, and then stabilize (around day 750). Compared to Renren, this dataset is much more sparse.
2.3
Preliminary Analysis
Our goal is to determine if Renren and Facebook’s network evolution display any property consistent with self-similarity, and if so, over what range of time scales. For clarity we first describe our analysis for Renren, which we repeat on the Facebook dataset in Section 2.5. Our analysis focuses on the edge creation process, since initial analysis showed no particular structure underlying the observed node creation events. The key challenge we face is how to identify and isolate the
impact of non-stationary patterns in the edge creation data. As a first step, we limit the impact of new node arrivals on edge creation, by focusing our analysis on edges created between members of a fixed user population. We remove this restriction and extend our analysis for all edge creation events in Section 2.4.3.
Next, we start by briefly describing how we sample the original dataset by removing certain node arrival and other obvious non-stationary events. We then discuss the methods for detecting self-similarity, our initial analytical findings and key insights.
2.3.1
Experiment Setup
Data Sampling. We begin our analysis with a conservatively sampled
sub-set of our data to remove obvious non-stationary factors that may impede any direct analysis of self-similar scaling property. Specifically, we limit our sample to include only existing users as of December 1, 2007, and study all edge creation events between them during December 2007,i.e. days 741 to 771. This sampling
eliminates three factors. First, by studying only edges created between members of a fixed user population, we minimize the impact of new node arrivals. Second, this month avoids the abnormal expansion of new edges around day 386 as a result of the one-time merge event of two social networks (Renren and 5Q). Finally, this time period is sufficiently late in the history of Renren that it avoids the initial
exponential network growth experienced by most social networks [161]. This data sample represents a stable growth period in Renren, which contains 18,714,712 edges created between 6,219,531 existing users. In the following we refer to this sampled dataset as “sampled dataset of Renren” to differ from the entire dataset without sampling as “full Renren”.
Estimating H. The two most popular (and simple) methods to estimate H are variance analysis and R/S analysis [46, 50, 75]. Our initial analysis efforts
consist of applying these two methods in addition to directly visualizing the raw data.
Variance fitting method [75, 115] analyzes the decaying behavior of variances of the aggregated processes X(m) introduced earlier, withm the block size. From Equation 2.2 in Section 2.2, a self-similar processX satisfies:
log(V ar(X(m)))∝ −βlog(m), m→ ∞ (2.3)
where β = 2(1−H). Thus by linearly fitting the plot of log(V ar(X(m))) versus log(m), this method can estimate β and then H = 1−β/2.
R/S analysis computesH by measuring how apparent the variability of a time series changes with the length of the time-period being considered, which can be formally captured by the R/S statistic [50, 75]. To compute H, it divides the process X into blocks of size n, and computes the corresponding R/S statistic
R(n)/S(n). Because there is
E[R(n)/S(n)]∝nH, , n→ ∞ (2.4)
for self-similar processes [50],H is estimated using the slope oflog(E[R(n)/S(n)]) versus log(n).
2.3.2
Measurement Results
We now present the results using three heuristics: visualization of raw data, variance analysis and R/S analysis.
A Long-term Diurnal Pattern. Figure 2.3 visualizes the edge creation
process by plotting the number of new edges created in each second over the one month (Day 741-771). We can clearly observe a diurnal pattern in the edge creation process. This non-stationary behavior precludes any direct analysis of self-similarity. We confirm this from the results of the variance and R/S analysis. Figure 2.4 plots the values oflog(V ar(X(m)))againstlog(m). The curve maintains a linear shape untilmreaches104 seconds (≈3 hours), and then its slope changes
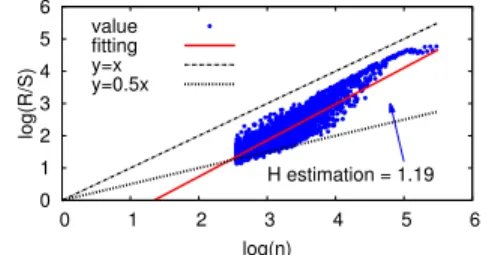
significantly. Similarly, Figure 2.5 plots in log-log scale individual R/S statistics as a function of the block sizen (in seconds). The red straight line shows the best linear fit and its slope results in an H-estimate of H = 1.19, clearly outside the allowed range of (0.5< H < 1).
0 10 20 30 40 741 751 761 771 # of Edges Created Time(Day)
Figure 2.3: Edge growth in sampled dataset of Renren, in terms of the number of new edges
created per second. It shows a clear diurnal pattern.
0 0.5 1 1.5 2 0 1 2 3 4 5 6 log(Var(X (m) )) log(m)
Figure 2.4: Variance analysis of sampled
dataset of Renren: the slope changes greatly whenm>104seconds (≈3 hours), preventing
direct analysis on self-similarity.
0 1 2 3 4 5 6 0 1 2 3 4 5 6 log(R/S) log(n) H estimation = 1.19 value fitting y=x y=0.5x
Figure 2.5: R/S analysis of sampled dataset
of Renren: H estimation is beyond range of self-similarity, and data shape changes significantly forn>104seconds (≈3 hours).
The appearance of such a pronounced diurnal pattern has a direct impact on subsequent efforts to model our dataset. It suggests that models should include a component that accounts for this expected user-generated periodic behavior.
Self-similar Fluctuations. An interesting observation from Figure 2.3 is
that the fluctuations on top of the diurnal component display a bursty behavior. Similarly, Figure 2.4 and 2.5 show that the curve only starts to lose its line shape whenm ornexceeds 104 seconds (≈3 hours). Figure 2.6 shows the edge creation
0 10 20 30 0 1 2 3 # of Edges Created Time(Hour)
Figure 2.6: An example of edge growth of a
randomly chosen 3-hour segment in the sampled dataset of Renren. It is highly bursty,
appears stationary and suggests further exploration for self-similar scaling behavior.
0 0.5 1.0
0 50 100 150 200 250
H Value
Segment Index(Segment Length = 3 Hours) Variance Analysis
R/S Analysis
Figure 2.7: Estimates of H by both
Variance and R/S analysis on disjoint 3-hour segments in the sampled dataset of Renren, where 98%+ ofH estimates fall within (0.5,1).
highly bursty, appears stationary and could therefore exhibit self-similar scaling behavior. Together, these observations suggest that over time scales not signifi-cantly impacted by the observed diurnal patterns (i.e. a few hours and below),
the edge creation process may be consistent with self-similar scaling behavior. We confirm this intuition by performing variance and R/S analysis on each 3-hour log segment and computing itsH value. Figure 2.7 plots the results over the entire month as 248 disjoint 3-hour segments. H estimates based on the variance analysis method vary across segments, with a mean of 0.89and variance of 0.01, while R/S analysis remains stable, with mean of0.68and variance0.001. For both methods, overwhelming majority of segments (98.4% for variance, 99.5% for R/S) estimate H within (0.5 < H < 1). These results suggest that the Renren edge creation process exhibits self-similarity over time scales ranging from seconds to hours.
2.3.3
The Reliability of our
H
Estimates
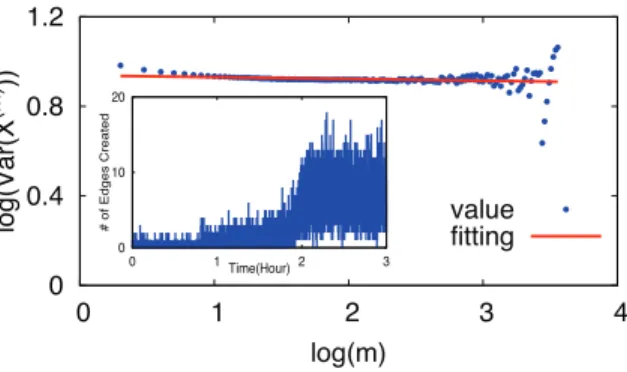
In our analysis, we encountered potential issues regarding the reliability of H-estimates using the variance and R/S analysis methods. For some segments, the methods produced poorly-fitting linear regression lines, which in turn resulted in highly questionable estimates of H. Figure 2.8 shows an example of such a “problematic” segment (6-9am, December 6, 2007), where the line fitting is poor via variance analysis. We also plot as an inset in the figure the raw edge growth during the time period, which shows a clearly non-stationary event. We further study these events in Section 2.4.2.
0 0.4 0.8 1.2 0 1 2 3 4 lo g (Va r(X (m ) )) log(m) value fitting 0 10 20 0 1 2 3 # of Ed ge s C re a te d Time(Hour)
Figure 2.8: An example of poor line fitting in variance analysis, which has poorR2=0.0458.
This is also confirmed by the inset which displays the raw edge growth during the corresponding time period, and shows a clearly non-stationary event.
To quantify the impact of such poor data fitting on