In the Nordic
Countries 2010/11
Scope, Expenditure and Financing
NOSOSCO Nordic Social Statistical Committee 53:2013
Social Protection in the Nordic
Countries 2010/2011
Social Protection in the Nordic Countries 2010/2011
Scope, Expenditure and Financing
NOSOSCO 53:2013
© Nordic Social Statistical Committee 2013
Published by the Nordic Social Statistical Committee (NOSOSCO) Artillerivej 5, DK-2300 Copenhagen S
Tel. +45 32 68 51 48 E-mail: [email protected] Website: www.nom-nos.dk
Editor: Jesper Munk Marcussen Translated by Lone Dalgaard from:
Social tryghed in de nordiske lande 2011/2012, København: NOSOSKO 51:2012 Cover: Sisterbrandt designstue, Copenhagen
Layout and Graphics: Lene Kokholm ISBN 978-87-90248-59-8
5
Preface
The Nordic Social Statistical Committee (NOSOSCO) is a permanent committee under the Nordic Council of Ministers. The aim of the Committee is partly to coordinate social statistics from the Nordic countries, partly to compare analyses and descrip-tions of the scopes and contents of social welfare measures.
The Committee is composed in such a way that each country has three representa-tives and a number of substitutes. The countries chair the Committee in turn for three years, with Finland having the chairmanship for the period 2011-2013.
In its report, Social Protection in the Nordic Countries, NOSOSCO publishes its find-ings regarding current social development. In 2005, the Faroe Islands gained full membership of the Committee, and data from the Faroe Islands have been included in this publication as from the 2003 publication.
As a result of their EU membership or participation in the EEA cooperation, all Nordic countries are obliged to report data on social protection to EUROSTAT, the EU statistical office, and consequently, NOSOSCO has decided to adopt the specifica-tions and definispecifica-tions used in ESSPROS, EUROSTAT’s nomenclature.
The data in this report are the most recent ones available in the spring of 2012, i.e. data are, where possible, from 2011 and otherwise from 2010. In respect of legis-lation and benefit rates, references are made to current legislegis-lation and the rates applying in 2011.
To assist the Committee Secretariat in its preparation of the present report, NOSOSCO set up an editorial group. Besides, a working group has contributed calcula-tions regarding typical cases and income distribution. On www.nom-nos.dk, a list of NOSOSCO´s members and its working groups can be seen.
The present edition of the publication is only available in electronic form on the NOSOSCO homepage together with supplementary information.
Jesper Munk Marcussen, Head of Secretariat, NOSOSCO´s Secretariat, is the editor of Social Protection in the Nordic Countries, 2010/11.
6
Contents
Short Introduction to Concepts Used in This Book ...7
Chapter 1. Changes in the Nordic Social Policies in 2011 and 2012 ...8
Chapter 2. Population and Income Distribution ... 19
Chapter 3. Families and Children ... 30
Chapter 4. Unemployment ... 64
Chapter 5. Illness ... 89
Chapter 6. Old Age, Disability and Surviving Relatives ... 112
Chapter 7. Housing Benefits ... 168
Chapter 8. Other Social Benefits ... 174
Chapter 9. Social Expenditure ... 189
Appendix 1. Method ... 208
Appendix 2. Basis for the Regulation of Social Benefits ... 218
Appendix 3. Nordic Social Policies ... 221
Appendix 4. Further Information ... 225
NOSOSCO Publications ... 227 Symbols Used in the Tables:
Data not available ... .. Data non-existent... . Less than half of the used unit ... 0 or 0.0 Nil (nothing to report) ...
-7
Short Introduction to Concepts
Used in This Book
This is meant as a short introduction to important concepts to facilitate use of this book. A detailed description of methods can be found in Appendix 1.
Social incidents
A large part of the book has been built around a number of social incidents - birth, unemployment, illness, incapacitation and old age. The individual chapters describe rules and social benefits in connection with such incidents.
Compensation rates in typical cases
For each of the social incidents, a compensation rate has been calculated for typical cases. The compensation rate is the income following the social incident as a per-centage of the income prior to the social incident - for example, how much does one earn in case of unemployment in comparison with how much one earned prior to be-coming unemployed.
The typical cases are named according to the size of the household. It may for ex-ample be the compensation level for a single person with no children in the event of unemployment, or a couple with two children in the event of illness.
In the event of childbirth, an equalised compensation rate is used - taking into ac-count the size of the household as the household has grown larger after the child-birth.
AW
Besides, the typical cases are graduated according to earnings prior to the social in-cident. The concept Average Wage earner (AW) is used. AW is defined as the average income for a wage earner. Compensations are calculated in connection with earnings of different percentages of AW. Consequently, AW 67 per cent of earnings (prior to the social incident) is 67 per cent of AW.
Disposable income as PPP
The compensation rate can be used to compare social benefits in relation to income from work. But as the basic earned income level varies among the countries, also purchasing power parities, PPP, are used. PPP expresses the purchasing power of each individual currency. The disposable income converted into PPP can therefore be used to compare the purchasing power of the social benefits. We use the EU standard PPP-Euro in which the total purchasing power for the EU equals 1.
Also here, equivalent data are used in some cases taking into account the size of the household in order to compare conditions of the various types of households.
8
Chapter 1
Changes in the Nordic Social
Policies in 2011 and 2012
DENMARK: Danish economy is still affected by the international recession. In 2010,
growth was 1.3 per cent while it was 1.0 per cent in 2011. In 2012, GDP is expected to increase by 1.1 per cent, while it in 2013 is expected to increase by 1.5 per cent. The employment rate dropped from 2010 to 2011 by 10 000 people. In 2012 and 2013, the employment rate is expected to increase slightly by 3-4 000 people a year. The unemployment rate in per cent of the labour force (cf. the EU definition) in-creased from 7.6 per cent in 2010 to 7.7 per cent in 2011. The unemployment rate is expected to be largely unaltered in 2012, whereas a minor decrease to 7.5 per cent is expected in 2013. Inflation increased from 2.3 per cent in 2010 to 2.8 per cent in 2011. In 2012, an inflation of 2.5 per cent is expected after which inflation is ex-pected to decline to 1.7 per cent in 2013.
The deficit in the Government funds decreased from DKK 46.5bn in 2010 to DKK 35bn in 2011. The deficit is expected to amount to DKK 70bn in 2012 and DKK 32.5bn in 2013. The increase in the deficit from 2011 to 2012 should be seen in connection with the payments of voluntary early retirement pensions that are estimated to in-crease the deficit by 1 per cent of GNP in 2012.
In the social protection area, the Danish Parliament (Folketinget) adopted a with-drawal reform on 12 December 2011. This reform implies that the already adopted increase of the pensionable ages of two years for voluntary early retirement and re-tirement pension is brought forward by five years. The voluntary early rere-tirement age will then be increased by two years in the period 2014-2017, and the retirement pension age will be increased by two years in the period 2019-2022. Furthermore, the withdrawal reform implies that the voluntary early retirement period is reduced from five to three years by increasing the two ages by six months a year in 2018-2019 and 2022-2023. Besides, a senior disability pension is introduced for people who are worn out. The senior disability pension is to ensure a faster and simpler way to disability pension for people with a connection to the labour market reaching the pensionable age within the following five years. The criteria for the award of disability pension remain the same. The withdrawal reform also implies a simplification of the setting off of the retirement pension in case of earned income as well as a lower employ-ment requireemploy-ment in order to postpone taking out retireemploy-ment pension.
In the period 1 October 2012 - 1 March 2013, a number of local authority tasks in the social area shall be combined administratively. Act no. 324 of 11 April 2012 on Pay-ment Denmark laid down rules on future administration in the casework area where decisions are mainly made on the basis of objective criteria. The combination into Payment Denmark includes retirement pension, housing benefits, maternity benefits, child allowance, child and youth benefit as well as payment/recovery of advanced
9 child maintenance, etc. To these should be added payments of disability pensions, as award of disability pensions still rest with the local authorities. In future, local authori-ties have to perform the considerable task of assisting citizens who have no IT
knowledge - or who find IT difficult when communicating with Payment Denmark. On 1 January 2012, the lowest benefit amounts in the cash assistance system were abolished as part of the Government's objective to the effect that fewer people have to live in poverty. The amounts concerned were the start assistance,”the upper limit of the cash assistance”, the so-called 500 Kroner reduction, the 225 hour rule and the introduction benefit.
As from 1 April 2012, recipients of cash assistance become entitled to holidays as part of the Budget agreement for 2012. Recipients of cash assistance shall be enti-tled to holidays for a total of five weeks after having received cash assistance for 12 continuous months. For those five weeks each year, recipients of cash assistance are exempt from the requirement of being available for the labour market. The holiday period must be agreed between the individual and the local authorities, and the indi-vidual is allowed to go abroad during his/her holiday.
On 1 June 2012, a job premium was introduced as part of the Budget agreement for 2012 as a 2-year trial scheme to reduce the risk of long-term unemployment among cash assistance recipients. The trial scheme is to run from 1 June 2012 to 31 May 2014. To be entitled to a job premium, a person must have drawn cash assis-tance, etc., for 329 out of 366 days during the calculation period and have drawn cash assistance or been employed in a wage-subsidized job on 29 February 2012. The job premium amounts to DKK 600 per month for people in the target group who earn an income from work, from self-employment, etc.
In respect of the elderly, a regulation of the local authorities' right to making deci-sions as to restriction of visits in sheltered housing, nursing homes or other housing forms with staff attached and common housing areas was implemented as per 1 July 2011. The purpose of the change was to make it clear to as well staff and the municipal board as residents and visitors which types and degree of behaviour that are considered so unac-ceptable that they can lead to regulation of the individual visitor's presence.
From 1 July 2011, local authorities have furthermore become obliged to prepare and publish a supervision policy containing clear guidelines and fixed procedures as to how the local authorities plan supervision and follow-up of the assistance to citi-zens receiving personal and practical assistance as well as meals-on-wheels in their own homes according to the rules on free choice of supplier. The supervision policy must be revised at least once a year.
On 5 January 2012, a simplification of the municipal council's pricing calculation of personal and practical assistance under the free choice of supplier entered into force. With this change, the statutory requirement was abolished as to the municipal council's calculation of the actual time spent in a citizen's home for the use of calcu-lation of the hourly rate when the municipal council uses the so-called authorization model to ensure the free choice of personal and practical assistance. Instead, the municipal council may today choose to calculate the hourly rate on the basis of the likely hourly requirement.
In respect of social services, a number of editorial consequential changes were made in the Social Services Act as from the 16 June 2011 as a result of the legal package, the "Children's Reform". At the same time, the local authorities' equal ac-cess to stopping/disrupting contact and omit to inform parents and network of a
10
child's/youth's placement, as well as the local authorities' access to a more lenient regulation of a child's contact with parents and network during an investigation car-ried out outside of its home was safeguarded, corresponding to the rules applying to placements away from home.
Furthermore, a number of initiatives shall be implemented as from 1 July 2012 in order to enhance the local authorities' measures in relation to children and youth at risk. Local authorities will among other things get improved access to the homes of exposed families in case there is a serious suspicion about poor well-being with a view to ensuring that children and youth at risk get help in time. Besides, the rules governing inter-municipal information are improved; an enhancement is made of the "SSD cooperation" in which professionals across defined sectors can discuss concerns regarding a specific child; an enhancement is made of the spokes body function of the Danish Parliamentary Ombudsman as well as the National Council for Children, and an obligation to inform is introduced between Denmark and Greenland when ex-posed families with children move between the two countries.
Regarding escort of children and youth between 12 and 15 years suffering from re-duced capacities, the Government's bill was passed in March 2012 with effect from 15 March 2012. The amendment entitles children and youth of the target group to be es-corted for up to 15 hours a month to self-selected activities outside of their homes. This increases their possibilities of living a life on equal terms with other children and youth.
As from 1 July 2011, bilingual children who are not attending day care facilities, and in case at least one of the parents is unemployed, must be provided with a guage-stimulating measure in the form of a day measure of 30 hours a week if a lan-guage evaluation of the child shows that the child is in need of a lanlan-guage-supporting measure. The day measure is free of charge for the parents.
THE FAROE ISLANDS: In 2011, the Faroese GDP was DKK 13.1bn, which is an increase
of almost DKK 1bn since the emergence of the financial crisis in 2008. At the begin-ning of the crisis in 2008, the Faroe Islands had a very low unemployment rate. Fol-lowing a rapid increase, first to 6 per cent in 2010 and then to 8 per cent in 2011, the unemployment rate has dropped to about 5.5 per cent in the spring of 2012. The unemployment rate is equally divided between men and women, and the youth un-employment rate is at the same level as the general unun-employment rate.
One of the largest challenges facing the Faroe Islands at present is the prospect of especially young women and men moving away from the Islands. For many years, there has been a deficit of women in the population in relation to men, and since 2005 the total population has remained stable at about 48 300 people. This develop-ment does, however, cover an increase in the number of elderly over 67 years, offset by a decrease in the share of the other age groups. After the election to the Lagting in the autumn of 2011, the development has been given special political attention.
In the spring, the Lagting adopted a labour market reform including a number of initiatives to help people get a foothold in the labour market. The objective is to obtain an inclusive labour market which also leaves room for people with disabilities, illness or social challenges. Subsequently, it is the intention to implement changes to medical certificates so that they to a higher degree become certificates of capabili-ties.
11 The Faroese social administration has in this relation initiated a process in which professional skills must be evaluated and credited to ease a return to the labour market in connection with rehabilitation.
A project derived from this reform is an amendment to the Welfare Act to the ef-fect that benefits in future must consist of fixed rates and taxable benefits. The rates will follow the level of sickness benefits.
A development can also be seen in the services area where the number of places in nursing homes has been extended by the construction of four new nursing homes at different places in the country. At the same time, legislation was amended to the effect that pensioners as from 2012 receive full pension and must pay rent and nurs-ing charges. The old scheme of reduced pension has thus been abolished.
A decentralize of the elderly sector has been initiated to the effect that it is taken over by the local authorities. Consequently, a framework Act governing the elderly sector must be drawn up. At the same time, initiatives have been taken in the pre-vention and rehabilitation area, just as focus has been placed on dementia. Focus has therefore been placed on the establishment of day care measures, and letting the elderly stay in their own homes for as long as possible.
The law governing the Housing Loan Fund (Huslånsfonden) has been amended to the effect that it shall become possible to establish cooperative housing, social hous-ing units, houshous-ing for young people and sheltered houshous-ing.
The legislation on children's welfare has also been amended which means that the regional child welfare authorities will be combined into larger units. Also politically, efforts are being made to establish housing for children where measures aimed at exposed children can be gathered. At the same time, there is a political desire to set up an ombudsman for children.
A 5-year project has been initiated focusing on violence in close relationships. The project is based on an action plan with a number of proposals for specific actions.
As to structural changes, an amalgamation of the Social Services Administration and the Home Nursing Scheme has been initiated. It will be an amalgamation of the two largest public institutions. The amalgamation is expected to be implemented by the end of 2012.
An election to the Lagting was held in the autumn of 2011. The Faroese Govern-ment consists of a cooperation of Samhørighedspartiet (the liberals), Folkepartiet (the conservatives), Centerpartiet (a Christian centrist party) and Selvstyrepartiet (the social liberals). The public office of Minister for Social Affairs was transferred from the Samhørighedsparti to the Folkeparti.
One of the first changes made by the new Government was an alteration of the fiscal policy with an increase of the basic tax allowance and a reduction of the taxa-tion levels. At the same time, a change has been made to the effect that taxataxa-tion of pensions is made by payment into savings accounts. This caused quite some discus-sion in the Faroese society as to the consequences to the relation between present and future tax receipts.
FINLAND: GDP increased according to preliminary data by 2.9 per cent in 2011. The
relatively large annual increase is mainly due to a low starting level in the first quar-ter of 2010. In 2011, the seasonally adjusted volume of GDP reached the same level as at the beginning of 2007, but it is still considerably lower than in 2008. GDP is
ex-12
pected to increase by just under 1 per cent in 2012 and then on average just under 2 per cent a year.
The unemployment rate decreased in 2011. The unemployment rate was 7.8 per cent compared with 8.4 per cent the previous year. The unemployment rate declined and the employment rate increased in all age groups. The youth unemployment rate, i.e. the 15–24-year-olds, dropped to 20.1 per cent. It is, however, much higher than in the best years of the 2000s, 2007 and 2008, when the youth unemployment rate was under 17 per cent. The number of long-term unemployed people continued to increase, but the increase was clearly smaller than in 2010.
The expenditure on social protection was an estimated EUR 57bn in 2011, i.e. half a per cent higher than the previous year as regards inflation. Also in relation to GDP, the expenditure remained almost the same, i.e. 30 per cent.
The conditions of pensioners with low incomes have been improved by the imple-mentation of a statutory guaranteed pension on 1 March 2011. The full amount of the guaranteed pension is about EUR 714 per months as from 1 January 2012. The guar-anteed pension increased the pension income of particularly women with low in-comes. At the end of 2011, 104 649 people drew guaranteed pensions.
As part of the improvement of the basic security scheme, the unemployment ben-efits and the social assistance amount were increased by the beginning of 2012. The basic amount of the unemployment benefits and the labour market support increased by EUR 100 per month. In relation to the index increase, the basic amount of daily cash benefits and the labour market support increased by EUR 120 per month from the beginning of 2012. The increase of the basic amount of daily cash benefits also improves the income-related unemployment benefits.
The basic amount of unemployment benefits increased as from 1 January 2012 by 6 per cent and the basic amount payable to single providers by another 10 per cent. The amounts of unemployment benefits are index-adjusted according to law as from the same time. The income ceilings in relation to housing benefits are increased so that they correspond to the increase in the labour market support, and the contribu-tion is increased so that it corresponds to the wage increases.
The Health Care Act entered into force on 1 May 2011 as part of a total reform of the organization and financing of the social and health care scheme. The purpose of the Act is to increase the focus on clients in the service and to improve the coopera-tion among actors when it comes to improving health and welfare and to organize the social and health care services. The preparation of the reform of the service struc-ture in the social and health sector and the revision of the legislation regarding the organization, development and monitoring of the health care continues.
In connection with a total reform of the social welfare legislation, the preparation of the Social Welfare Act and the Act on Services for the elderly is continued. The most important task in the second phase of the coordination of the disability services legislation is to draw up a plan concerning the protection of individually accommo-dated people with developmental disabilities.
In the autumn of 2011, the implementation of the new government programme was initiated. One of the three priority areas of the government programme is the combating of poverty, inequality and exclusion. A cross-sector action programme to reduce exclusion, poverty and health problems has been initiated. The preparation of the KASTE programme (a national development programme for social welfare and health care) for 2012–2015 was initiated by a broad collaboration. The programme is
13 prepared as the main programme of the administrative area and consists of six sub-programmes and comprises the key objectives of the development of the social and health care area and the means to obtain these objectives.
ICELAND: In 2011, the economic growth rate increased in Iceland compared with
2010, and at the same time, inflation decreased. There has been a recession in Ice-land from the beginning of the financial crisis in October 2008, but in 2011 economic growth was 3.1 per cent compared with -4 per cent in 2010 and -6.8 per cent in 2009. Inflation also decreased in 2011. It was 4 per cent on average compared with 5.4 per cent in 2010 and 12 per cent in 2009.
Traditionally, Iceland has had a high participation rate and a low unemployment rate in the population as a whole, even in comparison with the other Nordic coun-tries. The unemployment rate changed immensely following the financial crisis when it went from 1 per cent and lower to 2.5 per cent in the last ten years before the crisis and to 8 per cent and a little higher in 2009 and 2010. In 2011, the unemploy-ment rate declined to 7.4 per cent and in April 2012, it had dropped to 6.5 per cent. So it seems that the unemployment rate is on its way down although it is extremely high in relation to what Iceland is accustomed to. The unemployment rate has de-creased in all age groups in 2011 with the exception of the oldest age group, 65-69 years, for which it increased slightly. Although the unemployment rate is still highest in the age group 24 years and younger, the difference is smaller in 2011 between the youngest and the oldest age groups than it was in 2009 and 2010. Men have to a high-er degree been unemployed than have women afthigh-er the beginning of the crisis but in 2011, there is not a large gender difference in the unemployment rate. The unem-ployment rate is higher in Reykjanes and the capital region than in other parts of the country, and it is mostly people with a low education level who are unemployed. This has not changed after the crisis. In order to counter unemployment, many projects and programmes have been initiated under the auspices of the Government, local authorities, unions, wage earners' associations and the labour market parties. These were programmes aimed at the long-term unemployed; projects aimed at supporting people in returning to the labour market by way of education and training,”From Education to Work” (Í Nám – Til Vinnu) and ”Education is the Road to Work” (Nám er vinnandi vegur), as well as projects aimed at countering youth unemployment, such as "Young People in Action" (Ungir til Athafna) and ”Job market” (Atvinnutorg).
The Welfare Watch was set up after the financial crisis to observe the welfare and the consequences of the crisis to families and individuals. It especially focuses on chil-dren and families as well as on the protection of the most vulnerable people in society. It also, and it functions as a counsellor to the Government and municipalities. The Wel-fare Watch published "Social Indicators" in 2011 which is to inform about the social and health status in the country and function as an Icelandic welfare barometer. Statistics Iceland (Hagstofa Islands) shall be responsible for the control and updating of the indi-cators whereas the Ministry of Welfare shall publish the indiindi-cators annually and more often where possible. "Social Indicators" are considered an important socio-political tool that is to be published regularly just as the financial indicators.
The Government action plan for initiatives to ease the debt burden for individuals and families after the financial crisis and to reschedule their debts consists of a com-bination of general guidelines and new special solutions. A special office: Ombuds-man for the Indebted (Umboðsmaður skuldara) works especially with individuals and
14
families with large debts. Numerous initiatives have been initiated to help individuals and families who are suffering debt and financial problems. Such initiatives include improved legislation concerning debt-rescheduling and initiatives concerning housing.
The Centre for Social Research at the University of Iceland published in 2012 the results of a survey of the Effects of the Financial Crisis on Living Conditions in the Country (Áhrif fjármálakrepunnar á lífskjör þjóðarinnar) which was carried out on behalf of the Ministry of Welfare. Results show that the Government's measures to support and protect low and medium income groups have led to an 8 per cent income decrease in low income groups compared with 38 per cent in the high income groups.
According to the EU-SILC surveys, the share of the total population living in house-holds with an income of less than 60 per cent of the median of the equivalent dispos-able income is 9.2 per cent in 2011 and has not previously been lower. The share has been about 10 per cent from the beginning of the measuring in 2004. Those in the worst positions are the unemployed, single parents with one child or several children as well as those who do not own their accommodation but live in rented housing.
The Government has focused much on preventive measures aimed at children and young people, especially with a view to drug and alcohol abuse. Results from the ESPAD survey that is carried out in 36 European countries show that smoking has de-creased among young people in Iceland and is the lowest in Europe in 2011. The Gov-ernment has in 2012 earmarked a considerable amount towards improving treatment options for children and youth out in society, emphasizing that support is provided in society instead of at an institution.
A special Government work group presented in 2011 its recommendations concern-ing housconcern-ing policies stressconcern-ing among other aspects changes in Island's uniform housconcern-ing policies which mainly favoured the owner-occupier model. The recommendations concern i.a. composition of a more varied housing market with different solutions, not least in respect of young families and low-income families. A work group on hous-ing policies has continued the work after 2011 and recommends that at all times a four-year housing plan be drawn up under the Social Welfare Department but carried out in a collaboration of state, municipalities and private enterprises.
A work group on behalf of the Minister for Social Welfare is working with proposals for a reform of the social insurance scheme and consequently the entire Social Welfare Department. The purpose is among other things to simplify the system and to make it more transparent. This concerns welfare for the elderly, the disabled and children.
The Government decided in accordance with a wage agreement with the labour market in December 2010 that retirement pensioners drawing their pensions from the Social Welfare Department should gradually be equalized with disability pensioners when it comes to the income earned from work or from pension funds without it af-fecting payments from the Social Welfare Department. In September 2011, a new Act was passed defining how much retirement pensioners are allowed to earn before it affects payments from the Social Welfare Department.
On 1 January 2011, the Health Department and the Social and Welfare Department were united in one new department – the Welfare Department. On 1 January, the dis-ability care service was transferred from the State to the local authorities, and it was decided to transfer care services for the elderly from the State to the local authorities in 2014. These changes are steps in the development towards the responsibility for the running of the services becoming deeply rooted in the municipalities, while the respon-sibility for legislation, rights, complaints and supervision, rests with the State.
15
NORWAY: In the past 40 years, the activity in the Norwegian mainland economy has
increased by 2.75 per cent on average per year. This is in line with the growth rate in the USA and somewhat above the results of the Western European EU countries. Growth in the oil industry has contributed to GDP having increased even faster in total in that period. After the recession at the end of the 1980s, the growth rate of the mainland economy has been more even and inflation low and stable.
The Norwegian mainland economy has increased continuously since the fourth quar-ter of 2009, and the value added is now higher than before the financial crisis. Con-sumption growth slowed down somewhat in the first six month of this year, but in-creased housing and oil investments have sustained growth in the mainland economy.
Also in the years prior to the financial crisis, Norway differed from many other in-dustrial countries in having steep growth rates in revenue, production and employ-ment. Growth in the Norwegian economy has been supported by an increasing partic-ipation rate, and the demand for labour is on its way up after the recession at the end of 2008.
The labour force counted in 2011 2.629m people, i.e. an increase of 27 000 people since 2010. The participation rate among those aged 15-74 years changed from 71.9 per cent in 2010 to 71.4 per cent in 2011. The unemployment rate as it is measured in Statistics Norway's labour survey has on average been reduced from 3.6 in 2011 to 3.3 per cent in 2010. The unemployment rate changed only slightly in 2011 and until the second quarter of 2012.
The participation in working life of some groups is to a higher degree determined by health reasons than by economic trends. Of people with disabilities, the share that is in work has been relatively stable over time. According to Statistics Norway, the share of employed disabled people was about 43.2 per cent in the second quarter of 2012. 28.1 per cent of the population of the age group 15-74 years, i.e. 1.051m people, were not part of the labour force in 2011. That is a slight increase from the year before. People outside the labour force fell into the following categories: 36 per cent disability pensioners, 28 per cent receiving education or training, 24 per cent retirement pensioners, 5 per cent working from home and 7 per cent miscellaneous.
A key objective of the authorities is to facilitate an inclusive working life of which everyone can be part. From 2012, a job strategy was initiated for people with re-duced capacities in order to help more people to get ordinary paid employment. The target group for this job strategy is mainly people under 30 years. The job strategy forms part of the measures taken concerning a more inclusive working life (IA).
The collaboration on a more inclusive working life is an important instrument to reach overall goals in the employment, work environment and inclusion policies. On 24 February 2010, the Government and the parties agreed on an enhanced agree-ment of intent concerning a more inclusive working life in the period 1 March 2010 – 31 December 2013, as well as a protocol on joint efforts to prevent and reduce ab-sence from work due to illness and enhance inclusion. The new IA agreement will be followed up more closely and more broadly than the two previous agreements. The work has become more goal-oriented and sets clearer requirements to activity and reporting. The agreement is based on what is known to work: close follow-up of the ill person by the physician, the Labour and Welfare Administration and the employer as well as increased facilitation of presence. Furthermore, the significance of pre-ventive measures and systematic HMS efforts in the enterprises is emphasized to a higher degree. By way of the collaboration, the various parties shall participate
ac-16
tively to the individual work place participating in a committed boost to achieve the common goals.
The Labour and Welfare Administration was reorganized in the years 2006-2007 by way of the so-called NAV reform. One of the main purposes of the organizational re-form was to get more people in work or participating in activation measures and to reduce the number of people that have benefits or assistance as their main source of income. A more user-friendly, coordinated and efficient administration was another key objective of the reform. The establishment of the Labour and Welfare Admin-istration has been completed and the AdminAdmin-istration is currently consolidating itself. In all, 457 labour and welfare centres (NAV centres) were established on the basis of a cooperation agreement between the Ministry of Labour and Social Inclusion and the individual local authorities. In the period 2007-2013, an evaluation of the reform, both a process and an effect evaluation, is being carried out. The results of the ef-fect evaluation shall only be available by the end of the evaluation period.
On 1 February 2010, a new work methodology was introduced in the Labour and Welfare Administration, i.e. employability assessment. An employability assessment must be made of users seeking assistance at NAV to get in work. The new way of working provides a more structured and closer and early follow-up.
In January 2010, a public committee was set up, the Committee for Vocational Measures (the Brofoss Committee), to evaluate the part that sheltered work places are playing in the assistance provided to people with reduced capacities. The work of the Committee is to recommend changes with a view to improving the measures aimed at getting people in ordinary work.
The Committee is also to evaluate the distribution of participants in measures in sheltered and ordinary enterprises and to propose changes with a view to improving the measures aimed at users with a need for a permanent, adapted work place. The Committee's tasks have now been completed. A follow-up on the proposals in the recommendation has now been initiated.
A good achievement of objectives and an efficient operation of the activities of the Labour and Welfare Department is a decisive contribution to the creation of a well-functioning labour market, an inclusive working life and an inclusive community. The Labour and Welfare Administration has many and partly old ICT solutions. Considerable improvement of the efficiency and quality of the proceedings in the Labour and Wel-fare Department requires comprehensive modernization of the ICT systems in the Ad-ministration. Consequently, an extensive programme for the modernization of the ICT in the Administration has been initiated. The recommended programme will include new solutions as to disability pension and sickness benefits, self-service solutions, in-creased automation of the adoption procedures and integration with joint key solu-tions. The implementation of the programme shall run for six years in three steps.
There are large long-term challenges in the financial policy as a result of an ageing population. The ageing will result in a considerable increase in the expenditure on pensions, health and care for several decades in the future.
A new pension system came into force in 2011. The new system shall secure future pensions and contribute to ensuring the sustainability of the Norwegian welfare state. The reform provides for an individually adapted transition from work to pen-sion. It is possible to draw a full pension or part of a pension from 62 years to 75 years. Moreover, a proposal was presented in May 2011 for a new disability pension and retirement pension system for disabled people. The proposal was adopted by the
17 Storting in December 2011. The new system is scheduled to be initiated in 2015. The proposal ensures new disabled people a disability pension of about the same amount as today's disability pension, and it will be easier to combine disability pension and work. Besides, the disabled are ensured a good retirement pension.
The education level of the labour force continues to increase. In the period 2006-2011, the number of people in the labour force with higher education increased by 20 per cent, and in 2011, 36.4 per cent of the labour force had completed an education at university or college level.
The share of young people who do not complete further education is relatively high compared to other OECD countries. It is a key objective that as many as possible complete further education. In order to make learning more practical, varied and challenging, it has been suggested that optional courses be introduced at the 8th grade in schooling as from the autumn of 2012.
Children and youth. The objective of full kindergarten coverage has been reached, and the responsibility for the financing of kindergartens has been transferred to the local authorities. The cash benefits for one-year-olds between 13 and 18 months has been increased from 1 August 2012, while the cash benefits for two-year-olds will be phased out from that date. Parental charges payable for places in kindergartens will actually be reduced in that the maximum price is kept nominally unaltered. In addition, the munici-pal child welfare system in Norway has been strengthened with funds in 2011.
SWEDEN: In 2010, the Swedish economy saw a record recovery after a weak year in
2009. The recovery has now stopped and the economic trends are again declining due to the debt crisis in the Euro zone. GDP increased, however, by 3.9 per cent in 2011 compared with the previous year. The development is sustained by solid gross in-vestments and a strong business production. Growth is, however, expected to slow down considerably in 2012 as a result of weak economic signals from the USA and the large emerging economies, and GDP is estimated to end at 0.7 per cent. GDP is esti-mated to increase by 2.3 per cent in 2013.
The employment rate increased by 2.1 per cent in 2011, and the number of people aged 15-74 years in employment was 4,642m. The number of people in employment has increased by almost 100 000, and the increase is basically equal among men and women. Despite a poor number of order bookings as well as a subdued production de-velopment, the employment rate is not expected to decrease in 2012. Enterprises keep on their staff while waiting for better times. If the recession lasts longer than antici-pated, it will be necessary for the enterprises to get rid of staff quickly, and the em-ployment rate is then expected to decrease. The emem-ployment forecasts indicate an increasing employment rate of 0.3 and 0.4 per cent in 2012 and 2013, respectively.
In 2011, the number of unemployed increased on average to 378 000 people, 200 000 men and 178 000 women. That corresponds to 7.5 per cent of the labour force, which is a decrease of 1.1 per cent compared with 2010. The number of long-term unemployed decreased in 2011 to 113 000 people which was a decrease of 19 000 people compared with 2010. The unemployment rate was estimated to increase to 7.6 per cent in 2012 and then to decrease to 7.3 per cent in 2013.
After many years of a decreasing number of sickness benefit days, the number of benefit days increased in 2011. The growing trend will continue in 2012 after which the number of days is anticipated to decline again. That the number of sickness ben-efit days increases in 2011 and 2012 is a result of time limits having been introduced
18
in the sickness insurance scheme. The time limits resulted in many people leaving the sickness insurance scheme in 2010. A large part of the non-insured returned to applying for sickness benefits after three months which results in the anticipated increase in the number of people drawing sickness benefits in 2011 and 2012.
In 2009, the number of whole-year equivalents receiving social transfer incomes and assistance such as sickness benefits; sickness and activity allowance; labour mar-ket support and financial support started increasing after several years of decline. A whole-year equivalent corresponds to a person receiving full compensation for a whole year, i.e. two people, who have been unemployed for six months, will, put together, become one whole-year equivalent.
The increase continued in 2010, and the deteriorating labour market was the larg-est contributor to the development in the number of whole-year equivalents receiv-ing social benefits.
In 2011-2012, the number of whole-year equivalents is expected to decrease by 132 000, and the decrease is explained by the number of people receiving sickness and activity allowance as well as the number of people receiving labour market ben-efits decreasing.
The total number of transfers to households has decreased since 2009 but is ex-pected to increase again in 2012 by just over 4.5 per cent. Pension payments account for the steepest increase due to high inflation and a high income index at the same time as the number of pensioners increases. The expenditure on unemployment in-creases somewhat as the labour market measures are increased. The number of peo-ple receiving sickness and activity allowances has decreased since 2008 and continues to do so. Transfers to households are expected to continue increasing also in 2013.
In order to get more people in work and to reduce marginalization, tax on earned income was reduced. This was done partly by reducing tax on income from work in four stages and partly by reducing state income tax. The tax reduction on earned income is made in such a way that low and medium income wage earners get a high-er tax relief in relation to their earned income than do high income earnhigh-ers.
In 2007, the income tax was lowered by SKK 40bn; in 2008 and 2009 by SKK 10bn and 15bn, respectively, and in 2010 by another SKK 10bn. The fourth step in the in-come tax deduction involved that the inin-come tax deduction increased for those un-der the age of 65 years whose earned incomes from work exceeded about SKK 38 600 per year. For the majority of wage earners, the improvement of the income tax de-duction entails that they get between SKK 200 and 250 more in their pockets each month. The fourth step in the income tax deduction entered into force on 1 January 2010. The Government planned a fifth income tax deduction for 1 January 2012 but it has not yet been introduced.
To improve the financial circumstances for pensioners, taxes were lowered in a third step in respect of those turned 65 years on 1 January 2011. The income tax de-duction was made by further increasing the basic dede-duction for the pensioners in question. The deduction was made in such a way that those earning the least benefit the most. Furthermore, housing benefits for people drawing sickness and activity allowances were increased in 2010.
19
Chapter 2
Population and Income
Distribution
Link to supplementary information:
EUROSTAT database EU-SILC database
Table 2.1 Total fertility rate in the EU, Faroe Islands, Iceland and Norway, 2010
Denmark 1.87 Austria 1.44 Hungary 1.25 Portugal 1.36
The Faroe Islands 2.50 Belgium .. Ireland 2.07 Romania ..
Finland 1.87 Bulgaria 1.49 Italy 1.41 Slovakia 1.40
Iceland 2.20 Cyprus .. Latvia 1.17 Slovenia 1.57
Norway 1.95 Estonia 1.63 Lithuania 1.55 Spain 1.38
Sweden 1.98 France 2.03 Luxembourg 1.63 The Czech Republic 1.49
Germany 1.39 Malta 1.38 The Netherlands 1.79
Greece 1.51 Poland 1.38 United Kingdom ..
Source: EUROSTAT; Statistics Faroe Islands 5-yearly average
Population
The demographic composition of the populations varies somewhat from one country to another, which is significant in relation to the need for childminding facilities, activities for children and youth, the number of unemployed people and their age groups, the number of old-age pensioners, as well as the need for care and nursing of the oldest age groups.
The overall fertility rate, which appears from Table 2.1 above, has been relatively stable in the Nordic countries during recent years, with the Faroe Islands and Iceland having the highest fertility rates.
At the same time, the number of people in the oldest age groups has increased in all the countries and consequently also the need for care and nursing. There are, however, marked differences among the various countries and between the two gen-ders. In all the countries, there are more women than men in the oldest age groups, which results in many older women living alone during the last years of their lives.
Of the Nordic countries, Sweden and Finland have the oldest population and Ice-land and the Faroe IsIce-lands the youngest.
The development of the fertility rate, average life expectancy and migration ap-pears from Table 2.3. It should be noted that there are differences in the premises applied by the individual countries in the calculation of the figures in Table 2.3.
Fig-20
ure 2.1 shows the development of the Nordic populations until 2050 based on the national population projections.
Table 2.2 Mean population by gender and age, 2011
Denmark The Faroe
Islands Finland Iceland Norway Sweden
1 000 P.c. 1 000 P.c. 1 000 P.c. 1 000 P.c. 1 000 P.c. 1 000 P.c. Men 0-6 years 233 8 2 10 206 8 17 10 221 9 379 8 7-17 " 385 14 4 16 323 12 24 15 352 14 554 12 18-24 " 246 9 3 10 229 8 17 11 233 9 440 9 25-49 " 933 34 8 32 842 31 55 35 878 35 1.521 32 50-64 " 537 19 5 18 581 21 28 18 464 19 878 19 65-79 " 344 12 3 11 390 14 14 9 254 10 655 14 80- " 83 3 1 3 178 6 4 3 79 3 313 7 In total 2 760 100 25 100 2 749 100 160 100 2 480 100 4 740 100 Women 0-6 years 221 8 2 10 216 8 16 10 210 8 400 9 7-17 " 367 13 4 16 337 13 23 15 334 14 585 12 18-24 " 235 8 2 9 239 9 16 10 223 9 462 10 25-49 " 919 33 7 30 880 33 54 34 835 34 1.583 34 50-64 " 538 19 4 18 570 21 28 17 450 18 885 19 65-79 " 379 14 3 11 327 12 15 9 280 11 608 13 80- " 147 5 1 5 85 3 7 4 142 6 185 4 In total 2 807 100 23 100 2 653 100 159 100 2 473 100 4 708 100 Men and Women 0-6 years 454 8 5 10 422 8 32 10 431 9 779 8 7-17 " 752 14 8 16 660 12 48 15 686 14 1.140 12 18-24 " 481 9 5 10 468 9 33 10 455 9 902 10 25-49 " 1 852 33 15 31 1 721 32 110 34 1 713 35 3 103 33 50-64 " 1 075 19 9 18 1 151 21 56 18 913 18 1 763 19 65-79 " 723 13 5 11 716 13 29 9 534 11 1 263 13 80- " 230 4 2 4 263 5 11 3 221 4 498 5 In total 5 567 100 49 100 5 401 100 319 100 4 953 100 9 448 100
Table 2.3 Outline of the background for the population projections in the
Nordic countries
Denmark1) The Faroe
Islands Finland Iceland Norway Sweden
2011 2050 2011 20502) 2011 2050 2011 2050 2011 2050 2011 2050 Average life expectancy - Men 77.1 84.9 79.1 .. 77.2 86.2 80.6 84.6 79.0 84.8 79.6 85.7 - Women 81.2 87.1 84.9 .. 83.5 90.3 84.0 86.9 83.5 88.1 83.5 87.9 Fertility rate 1.9 1.9 2.3 .. 1.8 1.9 2.2 2.0 1.9 1.9 2.0 1.9 Number of children born, 1 000 62.7 69.2 0.6 .. 60.0 62.5 4.8 5.0 60.0 77.2 111.8 106.3 Net migration, 1 000 10.4 9.1 -0.4 .. 16.8 15.0 -1.6 0.8 47.0 8.9 38.1 17.0 1 Fertility in respect of people of Danish origin only
21
Figure 2.1 Mean populations in percentages broken down by age groups
22
Early Retirement from the Labour Market
A significant issue in relation to the expenditure on the elderly and the disabled is particularly the length of time for which people remain in active employment in the labour market.
Figure 2.2 shows the employment rate for men and women in the age group 50-66 years in 2011, and Figures 2.3 and 2.4 show the development in the employment rate for 60- and 64-year-old men and women, respectively, in the period 2000-2011.
As it appears from Figure 2.2, men have a higher employment rate in general than do women. In all the Nordic countries, the employment frequency declines markedly with age in respect of both men and women. There are, however, also large differ-ences from one country to another. The reasons for such differdiffer-ences are mainly to be found in different occupational structures, with the resulting different consequences to the health of the labour force, differences in the unemployment patterns. Signifi-cant are also differences in the options of retiring early from work with public in-come-substituting benefits, including the current pensionable age in the various countries.
23
Figure 2.2 People in employment as percentages of the population, broken
down by age and gender 20111)
24
Early retirement from the labour market is most common in Denmark and Finland. These two countries have the most comprehensive public retirement schemes. In the Faroe Islands, there are no other public retirement schemes than health-related dis-ability pension. In Iceland, there is no other public retirement scheme than health-related disability pension, with the exception of sailors who are granted public pen-sion from the age of 60 years. Sweden holds a position in between in respect of re-tirement age.
There are distinct differences amongst the countries as to the employment rate for the 60- and 64-year-old men and women. The development in the period 2000-2011 also differs from one country to another. Particularly in Finland and Denmark, there has in recent years been an increasing employment frequency for the 60-year-olds and to a lesser degree for the 64-year-60-year-olds in respect of both men and women.
25
Figure 2.3 Men of the ages 60 and 64 years in employment, per cent,
26
Figure 2.4 Women of the ages 60 and 64 years in employment, per cent,
2000-2011 00 01 02 03 04 05 06 07 08 09 10 11 Year 0 20 40 60 80 100 Denmark 00 01 02 03 04 05 06 07 08 09 10 11 Year 0 20 40 60 80 100 Faroe Islands 00 01 02 03 04 05 06 07 08 09 10 11 Year 0 20 40 60 80 100 Norway 00 01 02 03 04 05 06 07 08 09 10 11 Year 0 20 40 60 80 100 Sweden 60 Years 64 Years 00 01 02 03 04 05 06 07 08 09 10 11 Year 0 20 40 60 80 100 Iceland 00 01 02 03 04 05 06 07 08 09 10 11 Year 0 20 40 60 80 100 Finland
27
Income Distribution
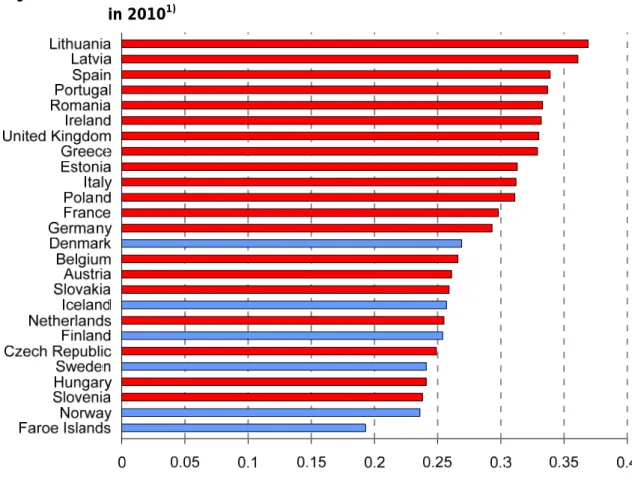
Figure 2.5 shows income distribution expressed by way of Gini coefficients for the Nordic countries and selected EU countries in 2010 (the Gini coefficient is a measure of dispersion for the degree of inequality in for example income distribution. In case of a completely equal distribution, the value is 0 and 1 in case of the most unequal distribution).
Compared with other countries, the differences in the income levels in the Nordic countries are small. The differences are smallest in the Faroe Islands, Norway and Sweden and somewhat larger in Denmark, Finland and especially in Iceland.
The similarities in the income distribution in the Nordic countries are results of mange different factors.
Undoubtedly, income transfers and taxation are significant factors for the similari-ties.
Figure 2.5 Gini coefficients for the Nordic countries and selected EU countries
in 20101)
Source: EU-SILC, Statistics Faroe Islands
28
Pensioners' Incomes Compared with Other Households
Figure 2.6 shows the disposable incomes in families where at least one person in the household is 65 years or older. The incomes are shown as percentages of the disposa-ble incomes for single people and couples younger than 65 years.
As can be seen from the Figure, families 65+ years have a lower disposable income on average in all the countries than have families younger than 65 years. This applies to both single people and couples, but single people have a considerably higher per-centage share than do couples, with the exception of Sweden where the figures are almost identical.
Figure 2.6 Incomes for single people/couples 65+ years as percentages of
in-comes for single people/couples younger than 65 years, 20101)
Source: EU-SILC
29
Risk of Poverty
Tables 2.4 and 2.5 show the ratio of the population living in households earning an income of less than 50 and 60 per cent, respectively, of the equivalent disposable income median in 2009.
It should be mentioned, however, that calculations of poverty risks are susceptible to the definitions used. The largest differences among the countries and in relation to the EU average are in particular to be found in connection with single parents, single elderly people and couples of whom at least one party has turned 65 years.
Table 2.4 Ratio of the total population living in households earning an income
of less than 50 per cent of the median equivalent disposable income,
per cent 20101)
Denmark Finland Iceland Norway Sweden EU27
Single parents 8.7 8.5 18.3 15.3 19.4 21.2
Single people
younger than 65 years 21.5 17.7 14.8 18.3 18.9 18.2
Couples younger
than 65 years 4.3 4.0 4.7 3.5 5.1 6.8
Couples with children: - couples with one child 3.3 2.7 2.6 1.6 3.3 7.6 - couples with two children 4.0 2.9 3.7 1.9 3.7 9.0 Single people 65+ 7.4 10.6 4.9 5.7 9.3 11.6 Couples, of whom at least one is 65+ years 4.6 0.6 0.9 0.1 1.3 5.8 All households 8.0 5.5 5.4 6.0 7.0 9.9 Source: EU-SILC
1 The actual income is from 2009, as data from 2010 are based on incomes from 2009
Table 2.5 Ratio of the total population living in households earning an income
of less than 60 per cent of the median equivalent disposable income,
per cent 20101)
Denmark Finland Iceland Norway Sweden EU27
Single parents 20.0 22.0 30.1 28.7 33.1 36.8
Single people
younger than 65 years 29.1 28.1 23.2 26.3 26.7 25.9
Couples younger
than 65 years 6.0 8.2 6.8 5.0 7.1 10.4
Couples with children: - couples with one child 6.0 6.8 5.8 4.1 6.0 11.9 - couples with two children 5.1 7.4 5.8 3.2 6.9 14.9 Single people 65+ 22.7 37.8 12.7 29.6 31.3 23.7 Couples, of whom at least one is 65+ years 13.1 5.2 1.1 0.8 4.9 12.4 All households 13.3 13.1 9.8 11.1 12.9 16.4 Source: EU-SILC
30
Chapter 3
Families and Children
Links to supplementary information:
EUROSTAT - database EU-SILC database Typical cases Social Expenditure
While the Nordic countries spend almost identical ratios of the total social expendi-ture in per cent of the GDP on families and children, there are somewhat larger dif-ferences in the spending patterns of the EU countries.
Table 3.1 Expenditure on families and children as percentages of GDP in the
EU, Faroe Islands, Iceland and Norway, 2009
Denmark 4.2 Austria 3.1 Hungary 3.0 Portugal 1.5
Faroe Islands 6.1 Belgium 2.2 Ireland 3.7 Romania 1.7
Finland 3.3 Bulgaria 2.0 Italy 1.4 p Slovakia 1.7 p
Iceland 3.2 Cyprus 2.2 Latvia 1.7 p Slovenia 2.1 p
Norway 3.3 Estonia 2.3 Lithuania 2.8 p Spain 1.5 p
Sweden 3.2 p France 2.7 p Luxembourg 4.0 The Czech Republic 1.4
Germany 3.2 p Malta 1.3 The Netherlands 1.3 p
Greece 1.8 Poland 0.8 United Kingdom 1.8 p
p Preliminary data
Note: The source is EUROSTAT: Database for Social Protection Expenditure and Receipts. The source for the Faroe Islands is the Almannamálaráðið
The Nordic countries also differ from the other European countries in that women have a high participation rate (cf. Chapter 4) which increases the need for child-minding options during parents' working hours. Moreover, childchild-minding falls under the educational system in the rest of Europe, and so the figures in Table 3.1 are not quite comparable.
One characteristic trait of Nordic families is that there are relatively many single parents. In all the countries, the number of single mothers is considerably higher than that of single fathers. The large number of one-parent families reflects the fre-quent changes in family structures.
31
Table 3.2 Number of households by family type, 2011
Denmark4) Finland Iceland1) Norway Sweden2,3)
Number of household with children aged
0-17 years (1 000) 771 581 51 629 1.110
- in per cent of all
families 27.1 19.6 41.2 27.5 19.7
Of whom (per cent):
- Married 60.5 61.1 57.4 54.4 77.0
- Cohabiting 16.8 18.6 22.8 23.9
- Single 22.7 20.3 19.9 21.7 23.0
Total 100.0 100.0 100.0 100.0 100.0
Distribution of children (per cent)
- 1 child 41.2 43.8 45.6 44.8 44.5
- 2 children 42.6 38.2 33.3 39.0 41.4
- 3 or more children 16.2 18.1 21.1 16.2 14.1
Average number of
children per household 1.8 1.8 1.6 1.8 1.7
Number of childless
households (1 000) 2 080 2 387 73 1 657 4 522
Of whom (per cent)
- Married 27.2 25.5 42.5 30.3 27.0 - Cohabiting 8.4 8.8 4.5 6.9 - Single 64.4 65.7 53.0 62.8 73.0 Total 100.0 100.0 100.0 100.0 100.0 Single parents (p.c.) Men 17.6 13.5 8.6 19.2 77.6 Women 82.4 86.5 91.4 80.8 22.4 Total 100.0 100.0 100.0 100.0 100.0
Single people with no children (p.c.)
Men 50.2 48.7 51.3 49.7 49.1
Women 49.8 51.3 48.7 50.3 50.9
Total 100.0 100.0 100.0 100.0 100.0
Average number of
people per household 1.9 1.8 2.4 2.2 1.7
1 Figures taken from Statistics Iceland's committee survey of living conditions (EU-SILC)
2 Figures projected by means of the simulation model FASIT and based on Statistics Sweden's commit-tee survey of household economies
3 Cohabiting individuals counted as married people
4 Furthermore, 16 545 families consist of children under the age of 18 living away from home. Children of the ages of 0-24 years living at home
32
Figure 3.1 shows the average disposable incomes broken down by family types and measured in PPP-Euro in 2010. The incomes have been adjusted (equivalent incomes) in relation to household size and composition in order to make household sizes more comparable (see Appendix 1).
The purpose of Figure 3.1 is to compare different households according to family types, and the Figure thus shows the disposable incomes of the adults in the house-hold, for which reason households without children include only households without elderly members. Especially the category single-adult households includes many stu-dents and others who are not in permanent employment. This partly explains the relatively low incomes for single adult households. In all the countries, single provid-ers have the lowest incomes.
In all the countries, couples with many children have lower incomes than have couples with no children or couples with one child. The number of children increases the divisor used for the calculation of the equivalent income.
Besides, several other factors contribute to the levels of income of the various households according to family types. Employment rates and levels of education vary in respect of the various households according to family types, just as the average earnings increase with age.
Figure 3.1 Equivalent average disposable incomes broken down by family types,
PPP Euro 20101)
Source: EU-SILC data. Average equivalent net income in PPP
33
Cash Benefits to Families and Children
1
Daily Cash Benefits in Connection with Childbirth
and Adoption
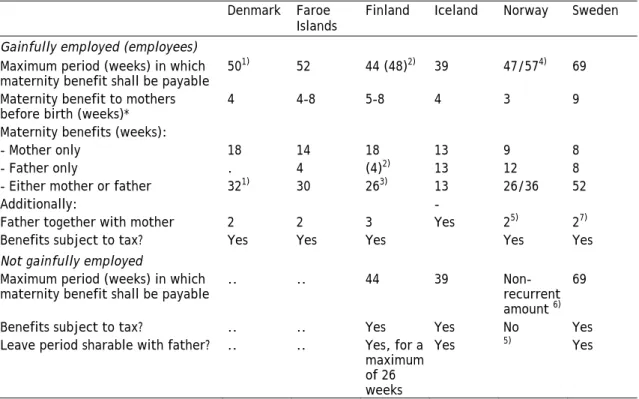
In all Nordic countries, compensation is granted to cover any loss of income in con-nection with childbirth during the last few weeks prior to and at least the first couple of months after childbirth. In all the countries, a similar benefit is payable in the event of adoption.
In all the countries, the benefit amount depends on any previous income but also on the length of the leave period.
In all countries, employees may receive their pay in full according to collective agreements.
In Denmark, a prerequisite for being awarded the benefit is that one complies with the employment requirement, i.e. either by having worked for 120 hours within the past 13 weeks; by being entitled to daily cash benefits; or by having concluded a vo-cational qualification course of a duration of at least 18 months within the past month; or by being an apprentice in paid trainee service.
In the Faroe Islands, it is also a condition for receiving the benefit that one is affil-iated with the labour market by way of employment or by being self employed, or that one draws unemployment benefit. Other people are entitled to means-tested social assistance.
In the other Nordic countries, people who are not affiliated with the labour mar-ket also qualify for a benefit. In Finland, Iceland and Sweden, only a small amount is awarded (a basic amount), however, and in Norway, the benefit is a non-recurrent payment which is mainly payable to mothers. In 2011, the amount is NOK 35 236 per child.
In all the countries, mothers are entitled to compensation for any lack of income if they are forced to terminate their work early in their pregnancy period due to work that could be detrimental to the foetus or in case of a difficult pregnancy. The rules governing such incidents vary somewhat from one country to another; in some coun-tries, maternity benefits shall be payable, in some cases sickness benefits and in oth-er cases a special benefit.
1
Benefits payable to children who have lost one or both parents are described in Chapter 6.4. Special benefits granted as supplemented social benefits to families and children are described in Chapter 8
34
Table 3.3 Rules governing award of income-substituting cash benefits in the
event of childbirth, 2011
Denmark Faroe
Islands Finland Iceland Norway Sweden Gainfully employed (employees)
Maximum period (weeks) in which maternity benefit shall be payable 50
1) 52 44 (48)2) 39 47/574) 69
Maternity benefit to mothers
before birth (weeks)* 4 4-8 5-8 4 3 9
Maternity benefits (weeks):
- Mother only 18 14 18 13 9 8
- Father only . 4 (4)2) 13 12 8
- Either mother or father 321) 30 263) 13 26/36 52
Additionally:
-Father together with mother 2 2 3 Yes 25) 27)
Benefits subject to tax? Yes Yes Yes Yes Yes
Not gainfully employed
Maximum period (weeks) in which
maternity benefit shall be payable .. .. 44 39 Non-recurrent amount 6)
69
Benefits subject to tax? .. .. Yes Yes No Yes
Leave period sharable with father? .. .. Yes, for a maximum of 26 weeks
Yes 5) Yes
* Note: The total number of reimbursable weeks includes the number of weeks, in which mothers are entitled to benefits prior to giving birth
1 The joint leave period of 32 weeks may be prolonged by 8 or 14 weeks to 40 or 46 weeks. The total leave period will consequently be 58 or 64 weeks. When a leave period is prolonged, the daily cash benefits will be reduced accordingly, so that the total amount for the 40 or 46 weeks equals the amount payable for 32 weeks
2 Fathers drawing parental daily cash benefits during the last 12 working days of the parental daily cash benefit period are entitled to paternal daily cash benefits for another 24 working days (the so-called bonus days of leave)
3 In the event of multiple births, the maternity-benefit period shall be extended by 60 days for the second child and each subsequent child
4 46 weeks at a compensation level of 100 per cent, or 56 weeks at a compensation level of 80 per cent 5 Fathers are entitled to two weeks of unpaid leave in connection with childbirth. The two weeks may
either be taken just before the child is born or immediately thereafter. Entitlement to two weeks unpaid leave does not apply in the event of adoption. In the public sector and in large parts of the private sector, there are, however, collective agreements granting compensation for those two weeks
6 The non-recurrent payment of NOK 35 263 is exempt from tax. The non-recurrent payment is payable to mothers. A father is entitled to a non-recurrent amount if the mother has died, and/or he has as-sumed sole custody of the child
7 Parents cannot draw parental benefits simultaneously, but the father, or in some cases an insured person other than the mother, may draw two extra weeks of benefits in connection with the birth
35 Table 3.4 Amount of income-substituting cash benefits in the event of child-
birth, 2011
Denmark Faroe
Islands Finland Iceland Norway Sweden Gainfully employed (employees)
Amount of maternity benefits (per week) as percentages of any previ-ous income
1002) 100 Usually
70-904)
75-805) 80/100 77.6/8010)
Income ceiling per week for full
compensation, national currency1) 3 830 6 250 No Maxi-
mum
89 147 8 208
Income ceiling per week for full
compensation in PPP-Euro1)) 376 613 . 483 709
Minimum amount per week,
national currency 3 140 . 132.78 20 016
6) 8) 1 26011)
Minimum amount per week,
in PPP Euro 308 . 109 108 109
Maximum amount per week,
national currency 3 830 5 850
3) No Maxi-
mum
69 767 9) 6 370
Maximum amount per week,
in PPP Euro 376 574 . 378 . 551
Not gainfully employed Maximum amount per week,
na-tional currency Same as daily cash benefits
132.78 11 559 7) 8) 1 260
Amount of daily cash benefits per
week, in PPP Euro . . 109 63 . 109
1 The income ceiling is the income maximum (previous income) in relation to which maternity benefits are calculated. The calculation of the income ceiling is made according to different principles in the various countries
2 When the joint leave period of 32 weeks is extended to 40 or 46 weeks, daily cash benefits shall be reduced accordingly, so that they correspond to 80 per cent for 40 weeks and to about 70 per cent for 46 weeks
3 The maximum amount per week is minus contribution of 12 per cent payable to the holiday account. 4 90 per cent of an earned income up to a maximum of EUR 51 510 per year for the first 56 days of the maternal leave period. For incomes exceeding EUR 51 510, it is 32.5 per cent. For the following 49 days, it is 70 per cent of an earned income of up to EUR 33 479 per year
5 Income in the last 12 months prior to birth determines the level of cash benefits in the following way: They amount to 80 per cent of the income from work up to ISK 46 512 per week, but 75 per cent of weekly wages above that amount and up to the income ceiling (ISK 69 767)
6 The minimum amount is payable when the employment has been between 25 and 49 per cent. The minimum amount payable when the employment has been between 50 and 100 per cent is ISK 27 740 per week. ISK 27 740 per week is payable to full-time students
7 Shall also be payable when the employment is less than 25 per cent.
8 For mothers who have not earned a right to maternity benefits, a non-recurrent payment of NOK 35 263 may be granted per child
9 Calculated as maternity benefits for mothers in work, the maximum amount will be NOK 8 728 per week at a 100 per cent compensation for 46 weeks, or NOK 6 982 at an 80 per cent compensation for 56 weeks
10 The compensation level is 80 per cent, but a conversion factor for the income on which the compen-sation is based makes the compencompen-sation level 77.6 per cent
11 Benefits at the lowest level (for a total of 90 days) apply to parents in and out of employment, re-spectively