© 2015 Athraa Jasim Mohammed, Yuhanis Yusof and Husniza Husni. This open access article is distributed under a Creative Original Research Paper
Document Clustering Based on Firefly Algorithm
1,2Athraa Jasim Mohammed, 1Yuhanis Yusof and 1Husniza Husni1
School of Computing, Universiti Utara Malaysia, Kedah, Malaysia
2Information and Communication Technology Center, University of Technology, Baghdad, Iraq
Article history Received: 12-07-2014 Revised: 22-02-2015 Accepted: 20-03-2015 Corresponding Author: Athraa Jasim Mohammed School of Computing, Universiti Utara Malaysia, Kedah, Malaysia
Email:[email protected]
Abstract: Document clustering is widely used in Information Retrieval
however, existing clustering techniques suffer from local optima problem in determining the k number of clusters. Various efforts have been put to address such drawback and this includes the utilization of swarm-based algorithms such as particle swarm optimization and Ant Colony Optimization. This study explores the adaptation of another swarm algorithm which is the Firefly Algorithm (FA) in text clustering. We present two variants of FA; Weight- based Firefly Algorithm (WFA) and Weight-based Firefly Algorithm II (WFAII). The difference between the two algorithms is that the WFAII, includes a more restricted condition in determining members of a cluster. The proposed FA methods are later evaluated using the 20Newsgroups dataset. Experimental results on the quality of clustering between the two FA variants are presented and are later compared against the one produced by particle swarm optimization, K-means and the hybrid of FA and -K-means. The obtained results demonstrated that the WFAII outperformed the WFA, PSO, K-means and FA-Kmeans. This result indicates that a better clustering can be obtained once the exploitation of a search solution is improved.
Keywords: Firefly Algorithm, Document Clustering, Data Mining,
Swarm-Based Algorithms
Introduction
Text clustering is a data mining technique that automatically groups a large amount of documents into meaningful categories, formally known as clusters (Miner et al., 2012). Clustering techniques can be divided into two types; Hierarchical and Partitional clustering techniques (Jain et al., 1999). Hierarchical clustering constructs a hierarchy of clusters using either top down approach (i.e., divisive) or bottom up (i.e., agglomerative) (Jain et al., 1999). The top down approach starts by organizing all items in a single cluster and later divides it into smaller groups. Such an operation can be seen in the Bisect K-means (Kashef and Kamel, 2009). On the other hand, the bottom up method starts from single clusters that contain a single item. The clusters are later merged based on an identified similarity measures (Jain et al., 1999; Forsati et al., 2013). The UPGMA is popular algorithm of such approach (Yujian and Liye, 2010).
The partitional clustering divides datasets into clusters into a single level (Luo et al., 2009). The center-based clustering is one of the most popular partitional clustering approaches and K-means (Jain, 2010; Velmurugan and Santhanam, 2010) is one type of it.
In K-means algorithm, clusters are formed by minimizing the objective function which it is the sum of distance between the center of cluster and each item in the cluster. Even though K-means is a simple method and is efficient for large dataset, it suffers from the local optima problem (Forsati et al., 2013).
Various works have tried to overcome the local optima problem by integrating clustering techniques with Swarm Intelligent algorithms (SI). Swarm Intelligent is defined as “The emergent collective intelligence of groups of simple agents” (Bonabeau et al., 1999). Examples of Swarm Intelligent algorithms includes the Artificial Bee Colony (ABC) (Karaboga and Ozturk, 2011), Cuckoo Search Optimization algorithm (Zaw and Mon, 2013), Ant Colony Optimization (He et al., 2006) and particle swarm optimization (Cui et al., 2005). These types of Swarm Intelligent algorithms have been utilized in text clustering; however, they need to predefine the number of k clusters. The determination of the k number of clusters is considered a problem as a user may not have any knowledge about the dataset prior to clustering. Based on literature (Sayed et al., 2009; Tan et al., 2011), the problem of determination of the k number of clusters have been solved using one of these two
DOI: 10.3844/jcssp.2015.453.465
approaches; the estimation clustering approach operates by using one of clustering performance metrics. Initially such an approach defines the range for k values; low and high value, then execute the clustering method with different k clusters and measure the performance metrics. The maximum/minimum value of performance metrics can be chosen to represent the best obtained clusters (Sayed et al., 2009). The second approach is the swarm based approach that mimics the capability of swarm insects such as ants, flocks, bees, etc. to solve hard problems (Tan et al., 2011). Swarm based approach utilize swarm like agents to group data directly without the need to define the number of clusters. One type of this approach is Dynamic FClust that is based on bird flocks of agents (Saka and Nasraoui, 2010).
In this study, the Firefly Algorithm (FA) (Yang, 2010a; 2010b; Yang and He, 2013), which was introduced by Xin-She Yang 2008, is utilized for text clustering. Two contributions made include the Weight-based Firefly Algorithm (WFA) (Mohammed et al., 2014) and Weight-based Firefly Algorithm II (WFAII). The WFA for text clustering works directly without the need to define number of clusters. A benchmark dataset obtained from 20Newsgroups is used to demonstrate the effectiveness of the proposed FA methods. Comparison of performance is made against the Particle Swarm Optimization (PSO) (Cui et al., 2005), K-means (Jain, 2010) and a hybrid model of FA and K-means (Rui et al., 2012).
The organization of this study is as follows; Section 2 provides the related work in text clustering while section 3 includes description on the standard firefly algorithm. Section 4 and 5 contain elaboration on the proposed clustering algorithms and the results are presented in section 6. Discussion is presented in section 7 and finally, conclusion of the work is made in section 8.
Related Works
Text clustering is grouping and organizing similar documents in the same group and dissimilar documents in different group (Miner et al., 2012). Clustering algorithms can be divided into two main categories; partitional and hierarchical (Jain et al., 1999). K-means is a well-known partitional clustering algorithm. This is due to its efficiency, simplicity and can easily be implemented (Jain, 2010). Nevertheless, K-means always converge into local optima. Such a situation has led researchers to the K-means with Swarm intelligent algorithms in order to search for optimal solution (Cui et al., 2005; He et al., 2006; Karaboga and Ozturk, 2011; Zaw and Mon, 2013). The pseudo code of K-means (Jain, 2010) shows in Fig. 1.
Swarm intelligent is “the emergent collective intelligence of groups of simple agents” (Bonabeau et al., 1999). Swarm intelligent algorithms are of meta-heuristic optimization algorithms that are designed
from biological behavior of insects or animals. Meta-heuristic optimization algorithm is utilized to find optimal or near optimal solution. It is proven successful in many hard problems such as speech recognition (Hassanzadeh et al., 2012), image processing (Horng and Jiang, 2010) and text clustering (Cui et al., 2005; He et al., 2006; Karaboga and Ozturk, 2011; Zaw and Mon, 2013). Meta-heuristic optimization algorithm includes two important components; exploration and exploitation. Where, exploration explores globally the search space to find diverse solutions, while, Exploitation focuses the search in specific region (local region). The balance between Exploration and Exploitation is the key for successful any optimization algorithms (Boussaïd et al., 2013).
Example of Meta-heuristic optimization algorithm includes the Particle Swarm Optimization (PSO) which was invented by Kennedy and Eberhart (1995). The basic idea of PSO comes from the flock and foraging behavior where each solution has n dimensions search space. The birds did not have search space, so it is called “Particles”. Each particle has a fitness function value that can be computed using a velocity of particles flight direction and distance (Hong et al., 2010). The pseudo code of basic PSO clustering algorithm (Cui et al., 2005) is illustrated in Fig. 2.
Fig. 1. Pseudo code of K-means (Jain, 2010)
Fig. 2. Pseudo code of standard PSO clustering algorithm (Cui et al., 2005)
Feng et al. (2010), PSO was proposed for divisive clustering. The result demonstrates that PSO has high performance quality (lower Entropy). Lu et al. (2009), researchers proposed PSO with an objective function that is based on extended Jaccard coefficient to maximize similarity between documents. Results indicate that PSO performs better than the K-means, agglomerative, graph based and Bisect K-means. On the other hand, PSO algorithm has also been integrated with K-means as a way to find the center of clusters. Results indicated that the hybrid of PSO and K-means outperformed the single models of PSO and K-means (Cui et al., 2005). However, recent finding (Yang, 2010a) shows that Firefly Algorithm (FA) is a better swarm-based approach in finding optimal solution as compared to PSO and Genetic Algorithm (GA). Firefly Algorithm (FA) is a younger optimization algorithm and was developed by Xin-She Yang at Cambridge University. It has two important issues, the light intensity and the attractiveness. For optimization problems, the light intensity, I, of a Firefly at a particular location, x, can be determined by
I(x) α f(x) objective function. The attractiveness β is relative. Its change depends on the distance between two fireflies (Yang, 2010b; 2010a; Yang and He, 2013).
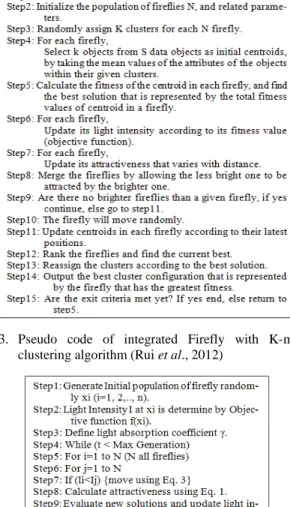
Firefly Algorithm (FA) has been utilized in many optimization problems such as classification (Nandy et al., 2012; Ming-Huwi et al., 2012), image processing (Horng and Jiang, 2010; Hassanzadeh et al., 2011) and anomaly detection (Adaniya et al., 2013). In relating to clustering benchmark datasets, FA offers a better solution compared to PSO and Artificial Bee Colony (ABC) (Karaboga and Basturk, 2011). Banati and Bajaj (2013), FA was employed on unlabeled data (un-supervised) by using objective function which maximizes homogeneity and minimizes heterogeneity. The result demonstrates that the utilized FA is a better approach than Particle Swarm Optimization (PSO) and Differential Evolution (DE) (Storm and Price, 1997) algorithms. Furthermore, in web mining (Rui et al., 2012), the Firefly Algorithm (FA) was integrated with K-means and also three swarm algorithms that includes the Wolf, Bat and Cuckoo. Experiments result showed that the FA-Kmeans is better than PSO-Kmeans. The pseudo code of integrated Firefly and K-means is depicted in Fig. 3.
In this study, we adapt the standard FA which has been implemented in data clustering (Senthilnath et al., 2011) and present two variants of FA that are to be used in text clustering. The variants include the WFA (Mohammed et al., 2014) and WFAII which enhance the exploitation of WFA that leads to better clustering. Experiments are later conducted to evaluate WFA (Mohammed et al., 2014) and WFAII and the winner will be compared against three existing clustering methods; standard Particle Swarm Optimization (PSO) (Cui et al., 2005), K-means (Jain, 2010) and integrated firefly algorithm with K-means (Rui et al., 2012).
Standard Firefly Algorithm
Firefly Algorithm (FA) is a swarm intelligence optimization algorithm that has been utilized in solving the NP hard problem (Fister et al., 2013). Firefly algorithm has two important variables; the light intensity and the attractiveness. The light intensity, I, of a firefly can be related with objective function f(x). The value of x is the location (position) of firefly. Every location has different value of light intensity. The objective function can be maximized or minimized, depending on the problem. The attractiveness, β, is related with light intensity relatively, meaning that when two fireflies attracted each other, the highest intensity will attract the lower intensity and the value of
β changes based on the distance between the two fireflies. The attractiveness, β, formula is shown in Equation 1 (Yang, 2010a; Yang and He, 2013) Equation 1:
( r 2) 0exp ij
γ
β β= − (1)
where, β0 is the attractiveness when the distance r has value 0. Y is the absorption coefficient value between (0-1). The movement of one firefly i to another firefly j is determined based on Equation 2 (Yang, 2010b; Yang and He, 2013):
* ( )
i i j i
X =X +β X −X +αεi (2)
where, Xi is the position of first firefly; Xj is the position of second firefly. εi refers the vector to random numbers selected from a Gaussian distribution (Yang, 2010a). The pseudo-code of a standard Firefly Algorithm is as shown in Fig. 4.
When the standard FA is applied in clustering (Senthilnath et al., 2011; Rui et al., 2012; Banati and Bajaj, 2013), the number of fireflies are pre-defined and each firefly carries one random solution. This solution is the K number of clusters; hence we must pre-determine the value of k. However, such an approach is not suitable when we do not have any knowledge about the dataset. Hence, this study addresses the shortcoming by proposing WFA which is the adaptation of FA in text clustering.
Firefly Algorithm for Text Clustering
Existing work on clustering numerical data using FA has been demonstrated in (Senthilnath et al., 2011; Banati and Bajaj, 2013). Nevertheless, the FA has not been tested on text data. Hence, we proposed WFA (Mohammed et al., 2014) that adapts the standard FA in text clustering. The pseudo code of WFA (Mohammed et al., 2014) is presented in Fig. 5.
Construction of a Vector Space Model
In document clustering, the Vector Space Model (VSM) represents document as a vector in the vector space (Aliguliyev, 2009).
DOI: 10.3844/jcssp.2015.453.465
Fig. 3. Pseudo code of integrated Firefly with K-means clustering algorithm (Rui et al., 2012)
Fig. 4. Pseudo code of standard Firefly (Yang, 2010b)
Fig. 5. Pseudo code of Weight-based firefly algorithm firefly (Mohammed et al., 2014)
The VSM is constructed by performing three steps; construction of a Term-Frequency (TF) database, construction of a normalized Term-Frequency (TF) database and creation of a Term Frequency-Inverse Document Frequency (TF-IDF) table. A Term-Frequency (TF) database is created by calculating the occurrence of each term in the document and represented as matrix. The rows represent terms (words) and the columns represent the documents. The value between them is the occurrence of each term (term frequency) (Manning et al., 2008).
A normalized matrix transforms the Term-Frequency (TF) database into normalized form, where the representation of each value is in the range of (0, 1). This can be achieved by dividing the occurrence of Terms (TF) by the length of each document (Length) as in using Equation 3 (Manning et al., 2008):
/
EN=TF Length (3) where, the Length can be calculated using Equation 4 (Manning et al., 2008):
( )
2 1 m i d Length Vi = ∑ = (4)where, m is the number of term in a collection, V is the term frequency, d is the document. Term Frequency-Inverse Document Frequency (TF-IDF) is a technique that has been widely used to represent documents in the form of numerical weights in the vector space (Manning et al., 2008; Forsati et al., 2013). TF-IDF for each term in a document is equal to the term frequency multiply by the inverse documents frequency, idf, which can be calculated using Equation 5 (Manning et al., 2008):
, , *
t d t d t
tfidf =tf idf (5) The inverse documents frequency idf for specific terms is the logarithm of number of documents in the collection divided by the number of documents in the collection that contain a term. Equation 6 shows how can calculated the idf (Manning et al., 2008):
log /
idf = N dft (6)
The total weight of each document is obtained by the summation of the TF-IDF for all terms in that document. The total weight for each document is calculated using Equation 7:
, 1 m tfidf dj ti dj i totalweight = =∑ (7)
where, j is the number of documents, i is the number of the terms.
Similarity Measure between Documents
Similarity between two documents is measured using the cosine function. Cosine function of two documents is computed using Equation 8 (Luo et al., 2009).
(
)
* , * di dj CosieSimilarity di dj di dj = (8)The document vectors are represented by the normalized term frequency, hence Equation 8 becomes the following (Luo et al., 2009) Equation 9:
(
)
1 , m( i* j) i CosieSimilarity di dj d d = =∑ (9)where, m is the number of terms in the collection. The value of cosine similarity is in the range between (0, 1). The cosine similarity approaches 1 when two documents are identical and far away when they are not identical.
Clustering
In WFA (Mohammed et al., 2014), each firefly represents a single document and the initial brightness, I, of the particular firefly is represented by the total weight of a document which is calculated using Equation 7. Hence, in (Mohammed et al., 2014), we proposed Equation 10:
( )
Idj( )
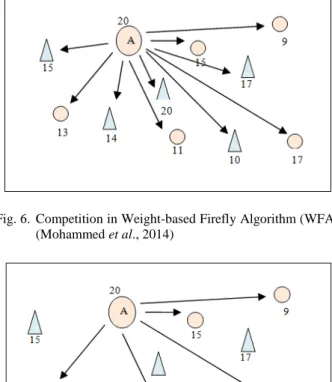
djInitialBrightness =totalweight (10) In WFA (Mohammed et al., 2014), in order to determine the center of a cluster, clustering is based on a single condition. Such an approach produces acceptable result but it consumes large computational effort (time and complexity). This is because firefly (document) with a brighter light needs to compete with other fireflies (documents). Figure 6 shows an example of how WFA (Mohammed et al., 2014) finds a center. For example, in Fig. 6, the circle object indicates documents of class 1 while the triangles are of class 2. The value allocated along with the shapes indicates the total weight for the particular document. In Fig. 6, document A has the brightest light (i.e., 20), meaning that distance between document A and other documents (both the triangle and circle objects) need to be determined. Only documents (either the triangle or circle shapes) that has a small distance to Document A will be considered.
The movement of fireflies depends on the distance between the positions of two documents in the search space, which can be calculated using cartesian distance function (Yang, 2010b) as shown in Equation 11:
(
) (
2)
2,
i j i j
Cartesian Distance d d = d −d (11)
The previous process continues until the number of iteration reaches a pre-determined value. After that, the
fireflies are sorted based on its brightness. The one with the brightest light is identified as the best point, meaning as the center of a cluster. Once a center is determined, we find documents that are similar to the center and this is identified using the cosine similarity measure as in Equation 9. Documents having high similarity value is located in the first cluster while the ones with lower values in a second cluster. Such an approach requires a threshold value and in this study, the threshold is set to 0.15. The second cluster will include documents that have less similarity values (i.e., less than 0.15). The process of finding a centroid and its cluster repeats in the second cluster and the process is replicated until all documents are grouped accordingly.
Weight-Based Firefly Algorithm II (WFA
II)
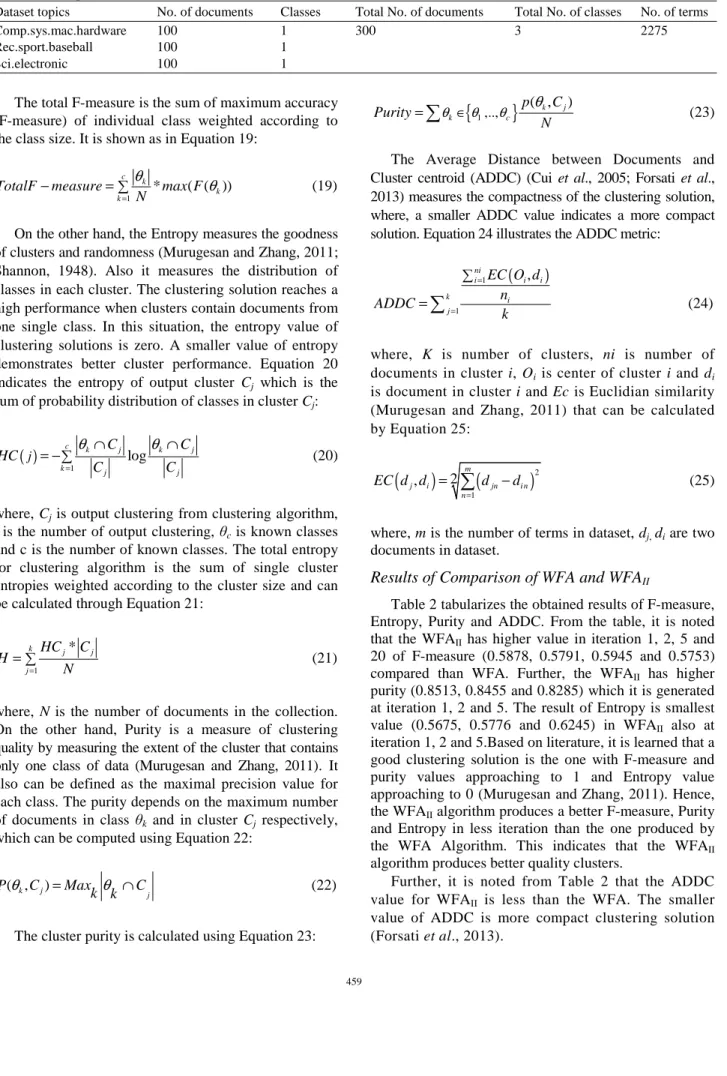
The second variant of FA in text clustering is the WFAII and it employs a more restrictive condition in identifying members of a cluster. Such an approach improves the exploitation process that happens during a search, hence leading to producing higher quality of clusters. The improvement is made by including a second condition based on similarity between two competing documents.Figure 7 illustrates the competition between fireflies (documents) which is based on two condition. First, the brightest firefly will attract the less bright ones, hence generating a list of potential documents that could bemoved towards the center. Documents in the list will then be evaluated based on their similarity with the center (2nd condition). Only documents with similarity value greater than 0.3 is moved towards the center using Equation 2. This is followed by updating the light intensity of the firefly (center) using Equation 12:
( ) ( )
int dj dj
light ensityI =I +β (12)
where, β is the attractiveness between two documents and can be computed using Equation 1. The movement of firefly is calculated using Equation 2, where εi is a random number and is calculated using Equation 13-15:
( , )
i random MinTFIDF MaxTFIDFij ij
ε = (13)
* ( , )
ij i j
MinTFIDF =α MinTFIDF MinTFIDF (14)
* ( , )
ij i j
MaxTFIDF =α MaxTFIDF MaxTFIDF (15)
where, i and j are documents, Min TFIDF is the minimum value of document weight derived from
TFIDF value and Max TFIDF is the maximum value of
document weight derived from TFIDF value.
The previous process continues until the number of iterations reaches a pre-determined value. After that, we need to rank the firefly based on their brightness. The one with the brightest light is identified as the centroid. The pseudo-code of the WFAII is as shown in Fig. 8.
DOI: 10.3844/jcssp.2015.453.465
Fig. 6. Competition in Weight-based Firefly Algorithm (WFA) (Mohammed et al., 2014)
Fig. 7. Competition in Weight-based Firefly Algorithm II (WFAII)
Fig. 8. Pseudo code of Weight-based Firefly Algorithm II (WFAII)
Experimental Results
In order to demonstrate the effectiveness of the proposed variants of FA for text clustering, several experiments were performed. The metrics of evaluation includes the F-measure, Entropy, Purity and ADDC (Average distance between documents and centroid) and is compared against K-means (Jain, 2010), Particle Swarm Optimization (PSO) (Cui et al., 2005) and the FA-Kmeans (Rui et al., 2012). All experiments were performed in Matlab on windows 8 with a 2000 MHz processor and 4 GB memory. We execute our algorithms, K-means, PSO and FA-K-means with five (5) different number of iterations. For each iteration, we execute the algorithms for 20 times and calculate the average value for each performance measures.
Data Sets
We used dataset obtained from text collection source which has been extensively used by researchers in the area of text clustering. The dataset, denoted by 20Newsgroups, were extracted from UCI machine learning repository (Lichman, 2013). The chosen documents have only one topic. The topics of documents are hardware, baseball and electronic. The number of documents in the dataset is (300) and the number of terms is (2275). The description of the dataset is presented in Table 1.
Evaluation Metrics
The F-measure (Murugesan and Zhang, 2011) depends on the recall and precision values and is mostly used in Information Retrieval (Manning et al., 2008). The total F-measure is the sum of F-measure for all classes. The equation to collect maximum value of F-measure is in Equation16: max 1 2 * ( , ) * ( , ) ,..., ( ) ( , ) * ( , ) k j k j k j k k j k j R C P C C C F C R C P C θ θ θ ∈ θ θ = (16)
where, θk means the class, Cj means the cluster, R(θk, Cj) is recall measure and P(θk, Cj) is precision measure which is shown in Equation 17 and 18 respectively:
(
, j)
k j k k C R C θ θ θ = ∩ (17)θk∩ Cj = The number of class k in cluster j θk = The number of the members of class k
(
k, j)
k jj
C C
P θ C = θ ∩ (18)
Table 1. Description of data
Dataset topics No. of documents Classes Total No. of documents Total No. of classes No. of terms
Comp.sys.mac.hardware 100 1 300 3 2275
Rec.sport.baseball 100 1
Sci.electronic 100 1
The total F-measure is the sum of maximum accuracy (F-measure) of individual class weighted according to the class size. It is shown as in Equation 19:
1 * ( ( )) c k k k
TotalF measure max F N
θ θ
=
− =∑ (19)
On the other hand, the Entropy measures the goodness of clusters and randomness (Murugesan and Zhang, 2011; Shannon, 1948). Also it measures the distribution of classes in each cluster. The clustering solution reaches a high performance when clusters contain documents from one single class. In this situation, the entropy value of clustering solutions is zero. A smaller value of entropy demonstrates better cluster performance. Equation 20 indicates the entropy of output cluster Cj which is the sum of probability distribution of classes in cluster Cj:
( )
1 log c k j k j k j j j C C HC C C θ θ = ∩ ∩ = −∑ (20)where, Cj is output clustering from clustering algorithm,
j is the number of output clustering, θc is known classes and c is the number of known classes. The total entropy for clustering algorithm is the sum of single cluster entropies weighted according to the cluster size and can be calculated through Equation 21:
1 * k j j j HC C H N = =∑ (21)
where, N is the number of documents in the collection. On the other hand, Purity is a measure of clustering quality by measuring the extent of the cluster that contains only one class of data (Murugesan and Zhang, 2011). It also can be defined as the maximal precision value for each class. The purity depends on the maximum number of documents in class θk and in cluster Cj respectively, which can be computed using Equation 22:
( ,k j)
j
P C Max C k k
θ = θ ∩ (22)
The cluster purity is calculated using Equation 23:
{
1,..,}
( ,k j) k c p C Purity N θ ∈θ θ θ =∑
(23)The Average Distance between Documents and Cluster centroid (ADDC) (Cui et al., 2005; Forsati et al., 2013) measures the compactness of the clustering solution, where, a smaller ADDC value indicates a more compact solution. Equation 24 illustrates the ADDC metric:
(
)
1 1 , ni i i i k i j EC O d n ADDC k = = ∑ =∑
(24)where, K is number of clusters, ni is number of documents in cluster i, Oi is center of cluster i and di is document in cluster i and Ec is Euclidian similarity (Murugesan and Zhang, 2011) that can be calculated by Equation 25:
(
)
(
)
2 1 2 , m j i jn i n n EC d d d d = =∑
− (25)where, m is the number of terms in dataset, dj, di are two documents in dataset.
Results of Comparison of WFA and WFA
IITable 2 tabularizes the obtained results of F-measure, Entropy, Purity and ADDC. From the table, it is noted that the WFAII has higher value in iteration 1, 2, 5 and 20 of F-measure (0.5878, 0.5791, 0.5945 and 0.5753) compared than WFA. Further, the WFAII has higher purity (0.8513, 0.8455 and 0.8285) which it is generated at iteration 1, 2 and 5. The result of Entropy is smallest value (0.5675, 0.5776 and 0.6245) in WFAII also at iteration 1, 2 and 5.Based on literature, it is learned that a good clustering solution is the one with F-measure and purity values approaching to 1 and Entropy value approaching to 0 (Murugesan and Zhang, 2011). Hence, the WFAII algorithm produces a better F-measure, Purity and Entropy in less iteration than the one produced by the WFA Algorithm. This indicates that the WFAII algorithm produces better quality clusters.
Further, it is noted from Table 2 that the ADDC value for WFAII is less than the WFA. The smaller value of ADDC is more compact clustering solution (Forsati et al., 2013).
DOI: 10.3844/jcssp.2015.453.465
Table 2. Results of WFA and WFAII algorithms
WFA WFAII
---
---Data sets Number of iteration F-measure Entropy Purity ADDC F-measure Entropy Purity ADDC
20Newsgroups 1 0.5559 0.6546 0.8078 1.2033 0.5878 0.5675 0.8513 1.1493
2 0.5414 0.6378 0.8098 1.1959 0.5791 0.5776 0.8455 1.1372
5 0.5640 0.6696 0.8132 1.0955 0.5945 0.6245 0.8285 1.0769
10 0.5812 0.6123 0.8187 1.1386 0.5775 0.7927 0.7682 0.9673
20 0.5705 0.6967 0.8003 1.0526 0.5753 0.8118 0.7655 0.9702
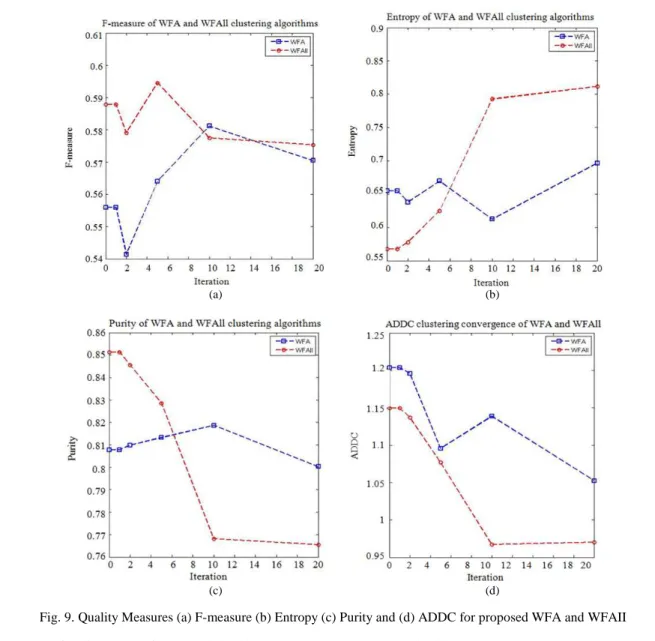
Figure 9 illustrates the quality performance metrics; F-measure, Entropy, Purity and ADDC results between the WFA and WFAII. Figure 9a includes the F-measure curve of WFA and WFAII. We notice that the curve of WFAII increase in iteration 1, 2, 5 and 20 than the curve of WFA. This means that WFAII generates highest F-measure than WFA. Figure 9b involves the Entropy curve of WFA and WFAII. We can observe that the curve of WFAII lower than WFA in iteration 1, 2 and 5 than the curve of WFA. Figure 9c involves the Purity curve of WFA and WFAII. We notice that the curve of WFAII rise in iteration 1, 2 and 5 compared against the curve of WFA.
In Fig. 9d, it can be seen that the curve of ADDC in WFAII is smooth since iteration 1 until the last iteration, i.e., 20, while the WFA curve rise in iteration 5. Furthermore, WFAII produce a smaller ADDC value than WFA. According to (Murugesan and Zhang, 2011; Forsati et al., 2013) a better clustering solution is the one with a high value of F-measure, Purity but a low value of Entropy and ADDC.
Results of Comparison of WFA
IIand Existing
Algorithms
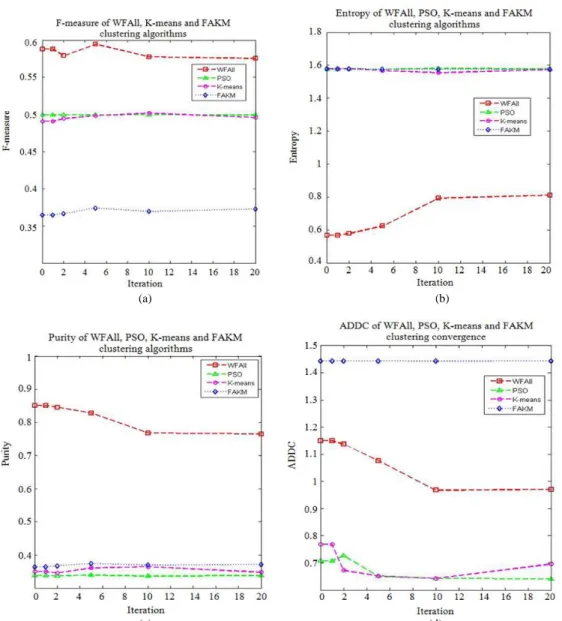
Table 3 tabularizes results on F-measure, Entropy, Purity and ADDC for the WFAII and three comparative algorithms; K-means (Jain, 2010), PSO (Cui et al., 2005) and FA-Kmeans (Rui et al., 2012). From the table, it is noted that the WFA has high values of F-measure and the best value (0.5945) is obtained in iteration 5. On the other hand, the highest value for is at 0.5018 and is produced in iteration 10. Similar situation is also seen in the results generated by the PSO; the best value of F-measure is obtained in iteration 10. On the other hand, the FA-Kmeans produces the lowest F-measure in most iteration.
As for entropy, value that approaches 0 indicates that it is a better algorithm (Murugesan and Zhang, 2011). In Table 3, it is learned that the WFAII has the smallest entropy produced in all iteration, where the best value (0.5675) is generated in iteration 1. While for K-means, PSO and FA-KK-means, we noticed that there is not much difference between the entropy values in most iteration. Furthermore, the obtained values are larger as compared to the WFAII.
Similar to the F-Measure metrics, a larger value of purity indicates that it is a better algorithm (Murugesan and Zhang, 2011). Purity is higher in WFAII, where the best value (0.8513) generates in iteration 1, while, PSO generate worst Purity. Based on
literature (Murugesan and Zhang, 2011; Forsati et al., 2013), it is learned that a good clustering solution is the one with F-measure and purity values approaching to 1 and Entropy value approaching to 0. Hence, the WFAII algorithm produces a better F-measure, Purity and Entropy than the one produced by K-means, PSO and FAK-means Algorithm. This indicates that the WFAII algorithm produces better quality clusters.
Further, it is noted from Table 2 that the ADDC value for WFAII is less than the WFA. The smaller value of ADDC is more compact clustering solution (Forsati et al., 2013).
Figure 9 illustrates the quality performance metrics; F-measure, Entropy, Purity and ADDC results between the WFA and WFAII. Figure 9a includes the F-measure curve of WFA and WFAII. We notice that the curve of WFAII increase in iteration 1, 2, 5 and 20 than the curve of WFA. This means that WFAII generates highest F-measure than WFA. Figure 9b involves the Entropy curve of WFA and WFAII. We can observe that the curve of WFAII lower than WFA in iteration 1, 2 and 5 than the curve of WFA. Figure 9c involves the Purity curve of WFA and WFAII. We notice that the curve of WFAII rise in iteration 1, 2 and 5 compared against the curve of WFA.
In Fig. 9d, it can be seen that the curve of ADDC in WFAII is smooth since iteration 1 until the last iteration, i.e., 20, while the WFA curve rise in iteration 5. Furthermore, WFAII produce a smaller ADDC value than WFA. According to (Murugesan and Zhang, 2011; Forsati et al., 2013) a better clustering solution is the one with a high value of F-measure, Purity but a low value of Entropy and ADDC.
Results of Comparison of WFA
IIand Existing
Algorithms
Table 3 tabularizes results on F-measure, Entropy, Purity and ADDC for the WFAII and three comparative algorithms; K-means (Jain, 2010), PSO (Cui et al., 2005) and FA-Kmeans (Rui et al., 2012). From the table, it is noted that the WFA has high values of F-measure and the best value (0.5945) is obtained in iteration 5. On the other hand, the highest value for is at 0.5018 and is produced in iteration 10. Similar situation is also seen in the results generated by the PSO; the best value of F-measure is obtained in iteration 10. On the other hand, the FA-Kmeans produces the lowest F-measure in most iteration.
(a) (b)
(c) (d)
Fig. 9. Quality Measures (a) F-measure (b) Entropy (c) Purity and (d) ADDC for proposed WFA and WFAII
Table 3. Results of quality measures for proposed algorithm WFAII and three comparative algorithms F-measure
---
Algorithms Iteration 1 Iteration 2 Iteration 5 Iteration 10 Iteration 20
K-means 0.4907 0.4945 0.4984 0.5018 0.4960
PSO 0.4993 0.4995 0.4992 0.4996 0.4994
FAKM 0.3647 0.3666 0.3740 0.3695 0.3727
WFAII 0.5878 0.5791 0.5945 0.5775 0.5753
Entropy
Iteration 1 Iteration 2 Iteration 5 Iteration 10 Iteration 20
K-means 1.5772 1.5791 1.5669 1.5549 1.5724
PSO 1.5765 1.5786 1.5754 1.5799 1.5775
FAKM 1.5788 1.5779 1.5753 1.5757 1.5754
WFAII 0.5675 0.5776 0.6245 0.7927 0.8118
Purity
Iteration 1 Iteration 2 Iteration 5 Iteration 10 Iteration 20
K-means 0.3493 0.3458 0.3607 0.3640 0.3477
PSO 0.3385 0.3373 0.3393 0.3365 0.3380
FAKM 0.3643 0.3672 0.3743 0.3690 0.3717
WFAII 0.8513 0.8455 0.8285 0.7682 0.7655
ADDC
Iteration 1 Iteration 2 Iteration 5 Iteration 10 Iteration 20
K-means 0.7682 0.6726 0.6515 0.6427 0.6958
PSO 0.7073 0.7266 0.6507 0.6431 0.6412
FAKM 1.4437 1.4437 1.4436 1.4432 1.4436
DOI: 10.3844/jcssp.2015.453.465
As for entropy, value that approaches 0 indicates that it is a better algorithm (Murugesan and Zhang, 2011). In Table 3, it is learned that the WFAII has the smallest entropy produced in all iteration, where the best value (0.5675) is generated in iteration 1. While for K-means, PSO and FA-Kmeans, we noticed that there is not much difference between the entropy values in most iteration. Furthermore, the obtained values are larger as compared to the WFAII.
Similar to the F-Measure metrics, a larger value of purity indicates that it is a better algorithm (Murugesan and Zhang, 2011). Purity is higher in WFAII, where the best value (0.8513) generates in iteration 1, while, PSO generate worst Purity. Based on literature (Murugesan and Zhang, 2011; Forsati et al., 2013), it is learned that a good clustering solution is the one with F-measure and purity values approaching
to 1 and Entropy value approaching to 0. Hence, the WFAII algorithm produces A better F-measure, Purity and Entropy than the one produced by K-means, PSO and FAK-means Algorithm. This indicates that the WFAII algorithm produces better quality clusters.
Further, The ADDC value for Euclidian similarity examines the clustering results how much satisfies the optimization constraints. As this metrics is similar to the Entropy metrics, a smaller value indicates that it is a bet ter algorithm (Forsati et al., 2013).
It is noted from Table 3 that the ADDC value for K-means and PSO is less than WFAII; however, the curve of WFAII is smoother than K-means and PSO and not contains any increase. Figure 10 illustrates the results obtained by the proposed WFAII algorithm, K-means, particle swarm optimization and FA-Kmeans in a graphical representation.
(a) (b)
(c) (d)
Discussion
This section presents a discussion on why the proposed WFAII outperformed its competitor (i.e., K-means, PSO and hybrid FA-K means). WFAII originates from firefly algorithm. It works in 2D grid and forms clusters automatically without any prior knowledge about the dataset using representative points (centroids) and does not require a pre-determined value of k cluster. While in K-means, PSO and FAK-means, the methods need to be supplied with the information on k number of cluster. The points (centroids) in WFAII represent document, while in K-means, the initial centroids are identified randomly and later produce clusters by minimizing the distance between document and the center. Later it re-calculates for a new center based on mean value for documents in the cluster. Such an approach may propose a point that is beyond the dataset and this will lead to local optima. In PSO, the initial Centroid is identified randomly from a vector in the dataset. Later solutions on the clustering for each particle that is optimized by the ADDC metrics are obtained. The final solution is the one with the smallest ADDC value. Similarly, the FAK-means model also represents initial centroids randomly.
Furthermore, in both of the WFA approaches, upon the identification of a centroid, two clusters are created based on a density threshold (used in density based clustering) and Cosine similarity. The similarity measures is learned to be more suitable as compared to Euclidean distance that was employed in K-means, PSO and FAK-means. The use of threshold will lead to create compact cluster that will affect the performance metrics positively.
Conclusion
In this study, we have addressed the problem of finding optimal initial cluster center (centroids) which can cause a search to be trapped into local optima. A new approach in meta-heuristics, i.e., firefly algorithm, is utilized for document clustering. We propose that each document is represented by a single firefly and the total weight of a document is the initial brightness of the firefly. Firefly (document) with the brightest light intensity and is similar to other fireflies (documents) is later identified as the centroid. Such an operation is identified to be a new approach in utilizing Firefly in document clustering. This study also proposes a second algorithm, WFAII that employs a more restrictive condition in identifying members of a cluster.
The performance of the proposed firefly Algorithms are tested on a standard text classification dataset which is the 20 Newsgroups and is evaluated using four performance measurements which are the F-measure,
Entropy, Purity and ADDC. The obtained results indicated that the WFAII outperformed the WFA, PSO, K-means and FA-Kmeans. This shows that a better clustering can be obtained once the exploitation of a search solution is improved.
Funding Information
Authors would like to thank the Ministry of Education for providing the financial support under the Fundamental Research Grant Scheme (s/o: 12894).
Author’s Contributions
Athraa Jasim Mohammed: Undertake the required
experiments and analyse the obtained results.
Yuhanis Yusof: Design the research and prepare the
workflow.
Husniza Husni: Organizes the writing and structure
of the manuscript.
Ethics
This article is original and contains unpublished materials. The corresponding author confirms that all of the other authors have read and approved the manuscript and no ethical issues involved.
References
Adaniya, M.H.A., T. Abrao and M.L. Proenca Jr., 2013. Anomaly detection using metaheuristic firefly harmonic clustering. J. Netw., 8: 82-91.
DOI: 10.4304/jnw.8.1.82-91
Aliguliyev, R.M., 2009. Clustering of document collection-a weighted approach. Expert Syst. Applic., 36: 7904-7916.
DOI: 10.1016/j.eswa.2008.11.017
Banati, H. and M. Bajaj, 2013. Performance analysis of firefly algorithm for data clustering. Int. J. Swarm Intell., 1: 19-35. DOI: 10.1504/IJSI.2013.055800 Bonabeau, E., M. Dorigo and G. Theraulaz, 1999.
Swarm Intelligence: From Natural to Artificial Systems. 1st Edn., New York, Oxford University Press, Santa Fe Institute Studies in the Sciences of Complexity, ISNB-10: 0195131592, pp: 320.
Boussaïd, I., J. Lepagnot and P. Siarry, 2013. A survey on optimization metaheuristics. Inform. Sci., 237: 82-117. DOI: 10.1016/j.ins.2013.02.041
Cui, X., T.E. Potok and P. Palathingal, 2005. Document clustering using particle swarm optimization. Proceedings of the IEEE Swarm Intelligence Symposium, June 8-10, IEEE Xplore Press, pp: 185-191. DOI: 10.1109/SIS.2005.1501621
DOI: 10.3844/jcssp.2015.453.465
Feng, L., M.H. Qiu, Y.X. Wang, Q.L. Xiang and Y.F. Yang et al., 2010. Fast divisive clustering algorithm using an improved discrete particle swarm optimizer. Pattern Recognit. Lett., 31: 1216-1225. DOI: 10.1016/j.patrec.2010.04.001
Fister, I., I.F. Jr., X.S. Yang and J. Brest, 2013. A comprehensive review of firefly algorithms. Swarm Evolut. Computat., 13: 34-46.
DOI: 10.1016/j.swevo.2013.06.001
Forsati, R., M. Mahdavi, M. Shamsfard and M.R. Meybodi, 2013. Efficient stochastic algorithms for document clustering. Informat. Sci., 220: 269-291.
DOI: 10.1016/j.ins.2012.07.025
Hassanzadeh, T., H. Vojodi and A.M.E. Moghadam, 2011. An image segmentation approach based on maximum variance intra-cluster method and firefly algorithm. Proceedings of the 7th International Conference on Natural Computation, July 26-28, IEEE Xplore Press, Shanghai, pp: 1817-1821. DOI: 10.1109/ICNC.2011.6022379
Hassanzadeh, T., K. Faez and G. Seyfi, 2012. A speech recognition system based on structure equivalent fuzzy neural network trained by firefly algorithm. Proceedings of the International Conference on Biomedical Engineering, Feb. 27-28, IEEE Xplore Press, Penang, pp: 63-67.
DOI: 10.1109/ICoBE.2012.6178956
He, Y., S.C. Hui and Y. Sim, 2006. A novel ant-based clustering approach document clustering. Proceedings of 3rd Asia Information Retrieval Symposium, October 16-18, Springer Berlin Heidelberg, Singapore, pp: 537-544.
DOI: 10.1007/11880592_43
Hong, P., W. Cong and G. Xin, 2010. Swarm intelligent optimization algorithm for text clustering. Proceedings of the 3rd IEEE International Conference on Computer Science and Information Technology, July 9-11, IEEE Xplore Press, Chengdu, pp: 200-203.
DOI: 10.1109/ICCSIT.2010.5565020
Horng, M.H. and T.W. Jiang, 2010. Multilevel image thresholding selection based on the firefly algorithm. Proceedings of the 7th International Conference on Ubiquitous Intelligence and Computing Autonomic and Trusted Computing, Oct. 26-29, IEEE Xplore Press, Xian, Shaanxi, pp: 58-63. DOI: 10.1109/UIC-ATC.2010.47
Jain, A.K., 2010. Data clustering: 50 years beyond K-means. Patt. Recognit. Lett., 31: 651-666.
DOI: 10.1016/j.patrec.2009.09.011
Jain, A.K., M.N. Murty and P.J. Flynn, 1999. Data clustering: A review. ACM Comput. Surv., 31: 264-323. DOI: 10.1145/331499.331504
Karaboga, D. and C. Ozturk, 2011. A novel clustering approach: Artificial Bee Colony (ABC) algorithm. Applied Soft Comput., 11: 625-657.
DOI: 10.1016/j.asoc.2009.12.025
Kashef, R. and M.S. Kamel, 2009. Enhanced bisecting k-means clustering using intermediate cooperation. Patt. Recognit., 42: 2557-2569.
DOI: 10.1016/j.patcog.2009.03.011
Kennedy, J. and R. Eberhart, 1995. Particle swarm optimization. Proceedings of the IEEE International Conference on Neural Networks, Nov-Dec. 27-1, IEEE Xplore Press, Perth, WA, pp: 1942-1948. DOI: 10.1109/ICNN.1995.488968
Lichman, M., 2013. UCI machine learning repository. Irvine, CA: University of California, School of Information and Computer Science.
Lu, Y., S. Wang, S. Li and C. Zhou, 2009. Text clustering via particle swarm optimization. Proceedings of the Swarm Intelligence Symposium, Mar-Apr, 30-2, IEEE Xplore Press, Nashville, TN, pp: 45-51. DOI: 10.1109/SIS.2009.4937843
Luo, C., Y. Li and S.M. Chung, 2009. Text document clustering based on neighbors. Data Knowl. Eng., 68: 1271-1288. DOI: 10.1016/j.datak.2009.06.007 Manning, C.D., P. Raghavan and H. Schütze, 2008.
Introduction to Information Retrieval. 1 Edn., Cambridge University Press,New York,
ISBN-10: 0521865719, pp:482.
Miner, G., J. Elder, A. Fast, T. Hill and R. Nisbet et al., 2012. Practical Text Mining and Statistical Analysis for Non-Structured Text Data Applications. 1st Edn., Academic Press, Elsevier,
ISBN-01: 012386979X, pp: 1000.
Ming-Huwi, H., L. Yun-Xiang, L. Ming-Chi and L. Ren-Jean, 2012. Firefly meta-heuristic algorithm for training the radial basis function network for data classification and disease diagnosis. Theory New Applic. Swarm Intell. DOI: 10.5772/39084
Mohammed, A.J., Y. Yusof and H. Husni, 2014. Weight-based firefly algorithm for document clustering. Proceedings of the 1st International Conference on Advanced Data and Information Engineering, Lecture Notes in Electrical Engineering, Springer Berlin Heidelberg, (SBH’ 14), Springer Science + Business Media Singapore, pp: 259-266.
DOI: 10.1007/978-981-4585-18-7_30
Murugesan, K. and J. Zhang, 2011. Hybrid bisect k-means clustering algorthim. Proceedings of International Conference on Business Computing and Global Informatization, Jul. 29-31, IEEE Xplore Press, Shanghai, pp: 216-219.
Nandy, S., P.P. Sarkar and A. Das, 2012. Analysis of a nature inspired firefly algorithm based back-propagation neural network training. Int. J. Comput. Applic., 43: 8-16. DOI: 10.5120/6401-8339
Rui, T., S. Fong, X.S. Yang and S. Deb, 2012. Nature-inspired clustering algorithms for web intelligence data. Proceedings of the IEEE/WIC/ACM International Conferences on Web Intelligence and Intelligent Agent Technology, Dec. 4-7, IEEE Xplore Press, Macau, pp: 147-153.
DOI: 10.1109/WI-IAT.2012.83
Saka, E. and O. Nasraoui, 2010. On dynamic data clustering and visualization using swarm intelligence. Proceedings of the the 26th International Conference on Data Engineering Workshops, Mar. 1-6, IEEE Xplore Press, Long Beach, CA, pp: 337-340.
DOI: 10.1109/ICDEW.2010.5452721
Sayed, A., H. Hacid and D. Zighed, 2009. Exploring validity indices for clustering textual data. Mining Complex Data, 165: pp: 281-300.
DOI: 10.1007/978-3-540-88067-7_16
Senthilnath, J., S.N. Omkar and V. Mani, 2011. Clustering using firefly algorithm: Performance study. Swarm Evolut. Comput., 1: 164-171.
DOI: 10.1016/j.swevo.2011.06.003
Shannon, C.E., 1948. A mathematical theory of communication. Bell Syst. Techn. J., 27: 379-423. DOI: 10.1002/j.1538-7305.1948.tb01338.x
Storm, R. and K. Price, 1997. Differential evolution-a simple and efficient heuristic for global optimization over continuous spaces. J. Global Optimizat., 11: 341-359.
DOI: 10.1023/A:1008202821328
Tan, S.C., K.M. Ting and S.W. Teng, 2011. A general stochastic clustering method for automatic cluster discovery. Patt. Recognit., 44: 2786-2799.
DOI: 10.1016/j.patcog.2011.04.001
Velmurugan, T. and T. Santhanam, 2010. Computational complexity between k-means and k-medoids clustering algorithms for normal and uniform distributions of data points. J. Comput. Sci., 6: 363-368. DOI: 10.3844/JCSSP.2010.363.368 Yang, X.S and X. He, 2013. Firefly algorithm: Recent
advances and applications. Int. J. Swarm Intell., 1: 36-50. DOI: 10.1504/IJSI.2013.055801
Yang, X.S., 2010a. Nature-Inspired Metaheuristic Algorithms. 2nd Edn., Luniver Press, United Kingdom, ISBN-10: 978-1-905986-28-6, pp: 116. Yang, X.S., 2010b. Firefly algorithm, stochastic test
functions and design optimization. Int. J. Bio-Inspired Comput., 2: 78-84. DOI: 10.1504/IJBIC.2010.032124 Yujian, L. and X. Liye, 2010. Unweighted multiple
group method with arithmetic mean. Proceedings of the IEEE 5th International Conference on Bio-Inspired Computing: Theories and Applications, Sept. 23-26, IEEE Xplore Press, Changsha, pp: 830-34. DOI: 10.1109/BICTA.2010.5645232 Zaw, M.M. and E.E. Mon, 2013. Web document
clustering using cuckoo search clustering algorithm based on levy flight. Int. J. Innovat. Applied Stud., 4: 182-188.