Density propagation based adaptive
multi-density clustering algorithm
Yizhang Wang1,2☯
, Wei Pang3☯
, You Zhou1,2☯
*
1 College of Computer Science and Technology, Jilin University, Changchun, China, 2 Key Laboratory of
Symbolic Computation and Knowledge Engineering of Ministry of Education, Changchun, China,
3 Department of Computing Science, University of Aberdeen, United Kingdom
☯These authors contributed equally to this work. *[email protected]
Abstract
The performance of density based clustering algorithms may be greatly influenced by the chosen parameter values, and achieving optimal or near optimal results very much depends on empirical knowledge obtained from previous experiments. To address this limitation, we propose a novel density based clustering algorithm called the Density Propagation based Adaptive Multi-density clustering (DPAM) algorithm. DPAM can adaptively cluster spatial data. In order to avoid manual intervention when choosing parameters of density clustering and still achieve high performance, DPAM performs clustering in three stages: (1) generate the micro-clusters graph, (2) density propagation with redefinition of between-class margin and intra-class cohesion, and (3) calculate regional density. Experimental results demon-strated that DPAM could achieve better performance than several state-of-the-art density clustering algorithms in most of the tested cases, the ability of no parameters needing to be adjusted enables the proposed algorithm to achieve promising performance.
Introduction
Clustering has been a promising technique in data mining and pattern recognition [1–3]. One important goal of clustering is to find potential data structures without supervision informa-tion. In density based clustering algorithms, a density threshold (which often represents radius of searching circle and size of grids) is usually used to build a search framework, and the final results depend on the local or global density threshold settings. Density based clustering algo-rithm follows the hypothesis that the high-density regions are always surrounded by low-den-sity connected sets. DBSCAN, OPTICS, DENCLUE, CLIQUE all belong to this kind of algorithms [4–7], which use thresholds to find clusters. In addition to the above algorithms, recently Rodriguez and Laio proposed a novel fast density clustering algorithm by searching density peaks (DP) [8], and they adopted a global threshold to calculate the local density of each point. However, manual intervention and domain knowledge is still required to obtain an appropriate threshold in DP, and a user may require a significant amount of time to learn how to configure parameters properly [9]. Based on the above consideration, in this research, we propose an adaptive density clustering method to address the above issue.
a1111111111 a1111111111 a1111111111 a1111111111 a1111111111 OPEN ACCESS
Citation: Wang Y, Pang W, Zhou Y (2018) Density
propagation based adaptive multi-density clustering algorithm. PLoS ONE 13(7): e0198948. https://doi.org/10.1371/journal.pone.0198948
Editor: Xiangtao Li, Northeast Normal University,
CHINA
Received: April 15, 2018 Accepted: May 29, 2018 Published: July 18, 2018
Copyright:©2018 Wang et al. This is an open access article distributed under the terms of the Creative Commons Attribution License, which permits unrestricted use, distribution, and reproduction in any medium, provided the original author and source are credited.
Data Availability Statement: Datasets Jain, Spiral,
Flame and Dount can be downloaded fromhttps:// github.com/mlyizhang/DPAM.git. Datasets breast, ionosphere, iris, sonar, vehicle, liver and wine can be downloaded fromhttp://archive.ics.uci.edu/ml/ datasets.html.
Funding: This research was supported by the
Science & Technology Development Foundation of Jilin Province under grant Nos. 20160101259JC, 20170101006JC, and 20180201045GX, the National Natural Science Foundation of China No. 61772227, the Natural Science Foundation of Xinjiang Province (2015211C127), and the
To determine appropriate parameter values for clustering algorithms, a number of approaches have been used, for instance, swarm-inspired algorithms and genetic algorithms [10–13]. The swarm algorithms can be used to find the optimal parameters, and examples of swarm algorithms include particle swarm optimization (PSO) and fireworks algorithm [14, 15]. However, the parameter search process needs prior knowledge to calculate fitness func-tions in these algorithms, and it is challenging to design proper fitness funcfunc-tions. For unsuper-vised clustering tasks without ground-truth labels, the swarm optimization algorithms and genetic algorithms are not straightforward to perform parameter search. In addition, the cho-sen parameter values may be invalid when clustering new datasets with different characteris-tics. This necessitates an adaptive approach which can automatically achieve density
clustering. Thus, in this research we will develop a robust and fast adaptive clustering strategy from a new perspective of density propagation.
The significant contributions of this research are twofold. First, the definitions of between-class margin and within-between-class cohesion of multi-density structure are proposed for achieving density propagation. Second, the DPAM algorithm is proposed to automatically extract poten-tial spapoten-tial data structure without manual adjustment of parameter values.
The rest of this paper is organized as follows: in Section 2, related work about density clus-tering is reviewed. In Section 3, the proposed DPAM algorithm is described in details. Experi-mental results and associated analysis on publicly available datasets commonly used for evaluating clustering algorithms are reported in Section 4. The paper ends with conclusions in Section 5.
Related work
In this section, we review the related work of density clustering algorithms. Most density based clustering algorithms are based on the same assumption: the dense regions of objects sur-rounded by low-density regions clusters. Based on this assumption, many methods such as DBSCAN, OPTICS, DENCLUE, CLIQUE and STING are proposed [16]. These algorithms calculate local density according to a given distance metric, which contains the minimum number of neighborhood at least. DBSCAN is a typical density based clustering algorithm, and in DBSCAN the density of every point is associated with the number of points within a thresh-old radius circle. OPTICS aims to overcome the shortcomings of DBSCAN by ordering points to identify the cluster structure. The data space can be quantized into a finite number of cells to form a grid structure. There also exist some grid density clustering algorithms: STING uses grids to store statistical information by the wavelet transform method; CLIQUE employs grids to high dimensional data clustering [17,18]. However, all these algorithms require users to set parameter values manually and this may lead to fluctuating clustering performance.
DP is an outstanding density clustering algorithm [8], and it adjusts the density hypothesis: it assumes that the low density areas cover centers of clusters, and the centers are far away from each other. In the DP algorithm, an important parameterdc(the percent of all data points similarities) representing the global density should be specified by users empirically, and it is a critical parameter which fundamentally affects the algorithm performance and the cluster cen-ters produced by decision graph [19]. However, it may be very challenging to obtain satisfac-tory results in DP without prior knowledge.
In general, all of the above algorithms are dependent on the choice of thresholds, such as the density size or grid size. To use these algorithms, users often need to adjust parameter val-ues gradually according to situations specific to different datasets in order to achieve better clustering results.
Engineering and Physical Sciences Research Council (EPSRC) funded Project on New Industrial Systems: Manufacturing Immortality (EP/ R020957/1).
Competing interests: The authors have declared
Density propagation based adaptive multi-density clustering
(DPAM)
A single natural cluster can be composed of a set of micro-clusters, each of which includes a smaller number of points with a higher local density. We propose the concept of regional den-sity to measure the distributions of points in each micro-cluster in Section 3.3. The proposed DPAM is based on the following assumption: the smaller the difference of regional density among different micro-cluster is, the better the clustering results are.
The points of different regional density constitute multi-density spatial data, and it is easier to cluster the micro-clusters than the original data. Hence a fast adaptive density clustering algorithm based on density propagation is proposed, which is better suited for clustering the obviously multi-density spatial data. DPAM mainly considers data of obvious boundaries except for links between clusters.
DPAM is a three-stage clustering algorithm: Stage 1 is establishing undirected graph (Sec-tion 3.1); Stage 2 is merging micro-clusters (Sec(Sec-tion 3.2); and Stage 3 is the final clustering (Section 3.3). DPAM does not depend on specific parameters to achieve accurate and robust results. We now describe these three stages in detail.
Generate micro-clusters graph
The first stage of DPAM is to initially build sub-graphs of all micro-clusters to make sure that one micro-cluster only has one kind of label. There are several different methods for generat-ing sub-graphs, such asknearest neighbor graph and- neighbors (means the minimum number of data points that a sub-cluster contains) [20], but these methods cannot obtain pure labels within a single micro-cluster. We choose the affinity propagation (AP) clustering algo-rithm to guarantee that the points in the same micro-cluster has the same label [21]. AP tends to cluster local neighbor points to form micro-clusters [22]. Parameter preference (P) in the AP algorithm is an important value which can be varied to produce different clusters with dif-ferent numbers of points [23]. The smaller the value ofP, the bigger the final number of the clusters is [24], and the more likely every cluster will contain the same label. We use the char-acteristics of AP that easily distinguishes local dense points and dynamically divides the global structures to produce micro-clusters. We denote a data set of n points byX= {X1,. . .,Xi,. . . Xj,. . .Xn}, and the similarity matrixS(i,j) is calculated by Euclidean distance as inEq (1)[25], then we useEq (2)to resetPresulting in a smaller number of clusters. InEq (2)the default value ofθis 0.1 in order to produce more micro-clusters. We will show in Section 4.1 that the default value ofθis effective for all data sets tested in this research and it does not need to be modified, and the default value is just to obtain the pure label in a single micro-cluster as much as possible.
Sði;jÞ ¼ kXi Xjk ð1Þ
P¼yminðSði;jÞÞ ð2Þ
Using the AP algorithm with the newly definedPthat can effectively recognizes small local clusters, we are now able to obtain many micro-clusters. Every micro-cluster has only one kind of label, and these micro-clusters will constitute the final better clusters. Thus, the cluster-ing task is transformed to groupcluster-ing all these micro-clusters.
Density propagation
DPAM uses the between-class margin (which measures distance between two micro-clusters) and within-class cohesion (which describes compactness within a single micro-cluster) mea-sure to determine whether the two clusters can be merged into one. This idea is called density propagation. First all data are assigned to differentNmicro-clustersC= {C1,. . .,Ck,. . .Cl,. . . CN}. From the local density perspective, the closer two micro-clusters are, the more likely they may belong to the same class. Thus we useEq (3)to represent the between-class margin (BM), which describes connectivity between two micro-clustersCkandCl:
BM¼ min
i2Ck;j2Cl;k6¼l
fSði;jÞg ð3Þ
The within-class cohesion (WC) defined inEq (4)describes the compactness of a micro-cluster.WCimplies the maximum distance of any two points within a sub-cluster, and it mea-sures the degree of closeness for a micro-clustersCk.
WC¼ max
i2Ck;j2CkfSði;jÞg ð4Þ
Formula (5) is the decision function for deciding whetherCkandClcan be combined into the same cluster. If the distance of one point ofCkand the next amongClis smaller thanWC ofCk, we merge the two micro-clustersCkandClinto a common cluster, then we setk=l, which means all points inCkwill be labelled asl. In this way, all the labels of these micro-clus-ters will be modified by such density propagation mechanism.
(
k¼l; BM WC<0 k6¼l; others
ð5Þ
In this stage, the connective neighbor micro-clusters will be merged into the same clusters. The local decision method has its disadvantage: when one micro-cluster is comparatively far away from another, local density propagation will not work, and they cannot become a cluster. Thus we propose the concept of regional density to complete the final clustering from the global perspective. This will be described in Section 3.3.
Calculate regional density
The high quality clusters are surrounded by neighbors with lower local density and they are at a relatively large distance and have higher local density [26]. Often, each sub-cluster has boundary points around it to form a region, so we propose the concept of regional density (RD) to detect micro-clusters which have high density, and then the sparse points are assigned to their nearest high density clusters.RDis influenced by two factors: the linear density of a single micro-cluster (LD) as defined inEq (6)and the number of points within a single micro-cluster (NS).RDis the product ofLDand the global proportion ofNS(NS/n) as shown in Eqs (6) and (7): LDCk¼ Pn i¼1;iþ12Ck;iþ1n;i2CkSði;iþ1Þ NS ð6Þ RDCk¼ Pn i¼1;iþ12Ck;iþ1n;i2CkSði;iþ1Þ n ð7Þ
Essentially, density propagation is to identify locally compact clusters, and ultimately we would like to obtain results with strong between-class margin and within-class cohesion. A micro-cluster with a highRDvalue has higher density. The smaller the gaps of regional density among different micro-clusters are, the better the clustering results we can get. So we use the variance to measure regional density gaps of different sub-clusters and minimize the variance ofRDamong sub-clusters through density propagation. The process of minimizing the vari-ance ofRDis to achieve more robust clustering results, as shown in Formula (8).
minVarðRDÞ; ð8Þ
whereRDrepresents regional densities of all micro-cluster,RD= {RDC1, ,RDCN},Nis the
number of micro-clusters. We solve the above model by merging low density regions into their nearest higher density micro-clusters so as to updateRD. We then calculate the variance ofRDwith the updatedRDvalues. We repeat this process until the variance ofRDcannot be further reduced. Eventually, results that fit our hypothesis will be obtained. The detailed steps of solving Formula (8) are shown in Algorithm 1.
Algorithm 1: The Detailed Steps of Solving Formula (8) repeat
1. Calculate RD for every micro-cluster; 2. Calculate variance of all RDs
3. Merge the micro-clusterCk with low RD into their nearest high RD
micro-cluster Cl;
until Variance of all RDs no longer decreases
The detailed procedure of DPAM
The DPAM algorithm begins with micro-clusters graphs produced by AP, which is a better generation method. Afterwards we calculate the distance of every two points, and we use between-class margin (BM) and within-class cohesion (WC) to evaluate which two micro-clus-ters can be merged into a new cluster. But there may still exist some sparse density regions, so we merge them into their nearest high density clusters according to the density assumptions. The detailed procedure of the proposed DPAM algorithm is shown in Algorithm 2.
Algorithm 2: The Detailed Steps of the DPAM algorithm Require: Data set, Preference P.
Ensure: The clustered label results Y for X. 1: Clustering by Affinity Propagation; 2: repeat
3: Calculate BM and WC based on Eqs (3) and (4), respectively; 4: Propagate labels Y of micro-clusters according to the decision
function given by Formula (5);
5: until every label of micro-cluster is reset 6: Solve Model (8) by Algorithm 1;
7: Return Y
In conclusion, the time complexity of the DPAM isO(n2), which is not higher than DBSCAN and DP Clustering.
Experimental results and discussion
In this section we report the performance of DPAM. We experimented with publicly available data, and the clustering performance evaluation tasks include: (1) whether DPAM can produce
correct clustering results for low dimensional data, (2) performance comparison with other density clustering algorithms, and (3) whether DPAM is robust on high-dimensional data.
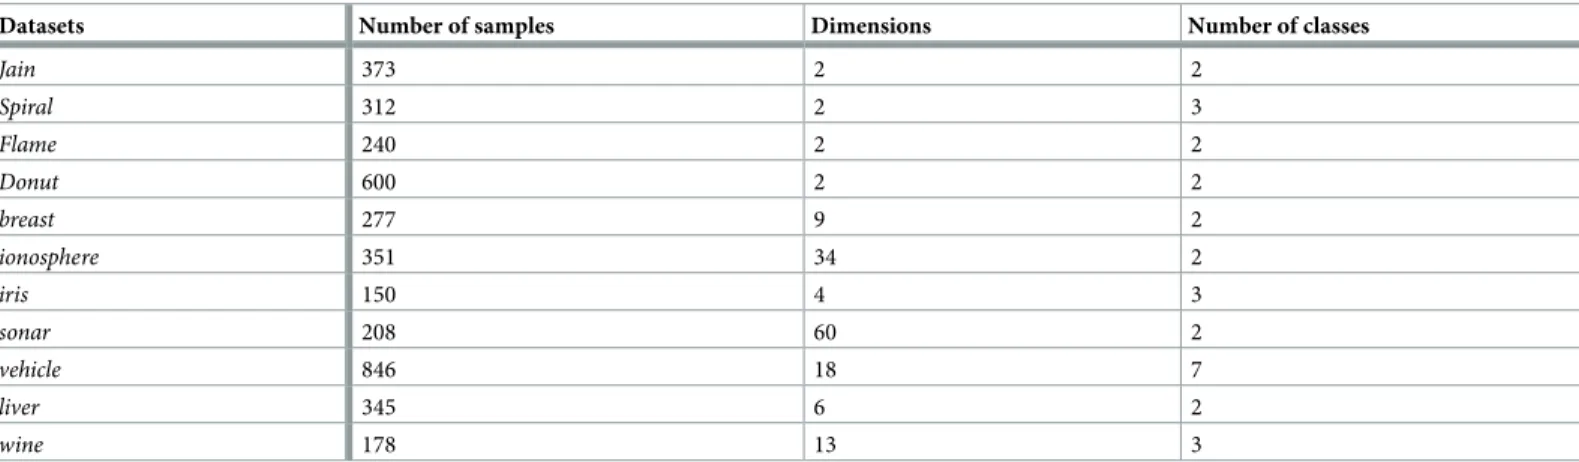
All the experiments are carried out with the same default parameter values and the same data. Eleven datasets are used in the experiments, as shown inTable 1, datasets Jain, Spiral and Flame are taken fromhttp://cs.joensuu.fi/sipu/datasets/, dataset Dount is artificial, and it can be downloaded fromhttps://github.com/mlyizhang/DPAM.git. Datasets breast, ionosphere, iris, sonar, vehicle, liver and wine can be downloaded from (http://archive.ics.uci.edu/ml/ datasets.html).
To evaluate the clustering results, we adopt the commonly used evaluation index F-measure (FM), as defined below: for a pair of pointsXiandXj, they are represented asTPif they have the same class and the same cluster. They are represented asFPif they have different class labels but are grouped into the same cluster. They are represented asFNif they have the same class label but are grouped into different clusters.
precision¼ #TP #TPþ#FP ð9Þ Recall¼ #TP #TPþ#FN ð10Þ FM¼2PrecisionRecall PrecisionþRecall ð11Þ
In Eqs (8) and (9), # represents the number of the corresponding quantity.
Sensitivity analysis of micro-clusters generation
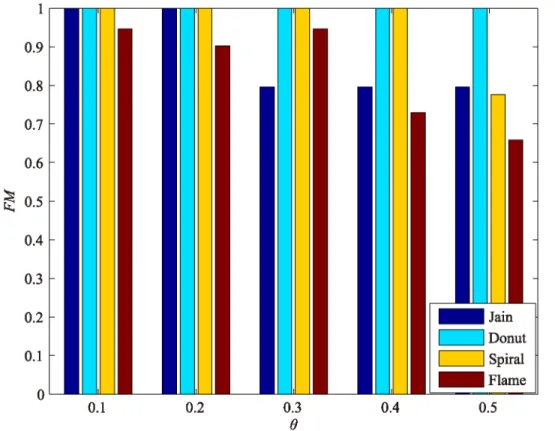
The first and important step of DPAM is generation of micro-clusters as described in Section 3.1. There is a parameterθin this stage, and we give a default valueθ= 0.1, but it never changes when new data sets are used.
To illustrate the effectiveness of this, we make an experiment on four datasets: one can see the influence of parametersθon the clustering results for the four datasets inFig 1: whenθ
becomes bigger, a single cluster produced by AP may more likely contain different labels, the performance of DPAM decreases. The default value ofθwill ensure the generation of many
Table 1. The features of datasets.
Datasets Number of samples Dimensions Number of classes
Jain 373 2 2 Spiral 312 2 3 Flame 240 2 2 Donut 600 2 2 breast 277 9 2 ionosphere 351 34 2 iris 150 4 3 sonar 208 60 2 vehicle 846 18 7 liver 345 6 2 wine 178 13 3 https://doi.org/10.1371/journal.pone.0198948.t001
high quality sub-clusters, andθ= 0.1 makes sure that we are more likely to obtain pure labels in a single micro-cluster when clustering different datasets. This unchanged parameter can work effectively for all the data sets tested in this work, so we hold this default value in all experiments to prove the effectiveness of the adaptive DPAM algorithm.
The synthetic datasets
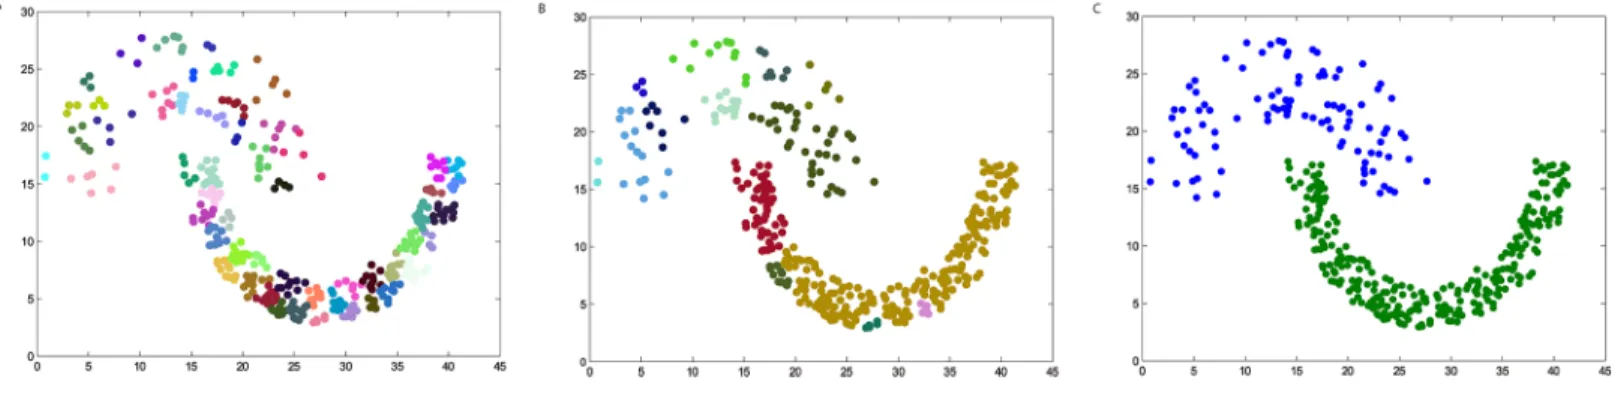
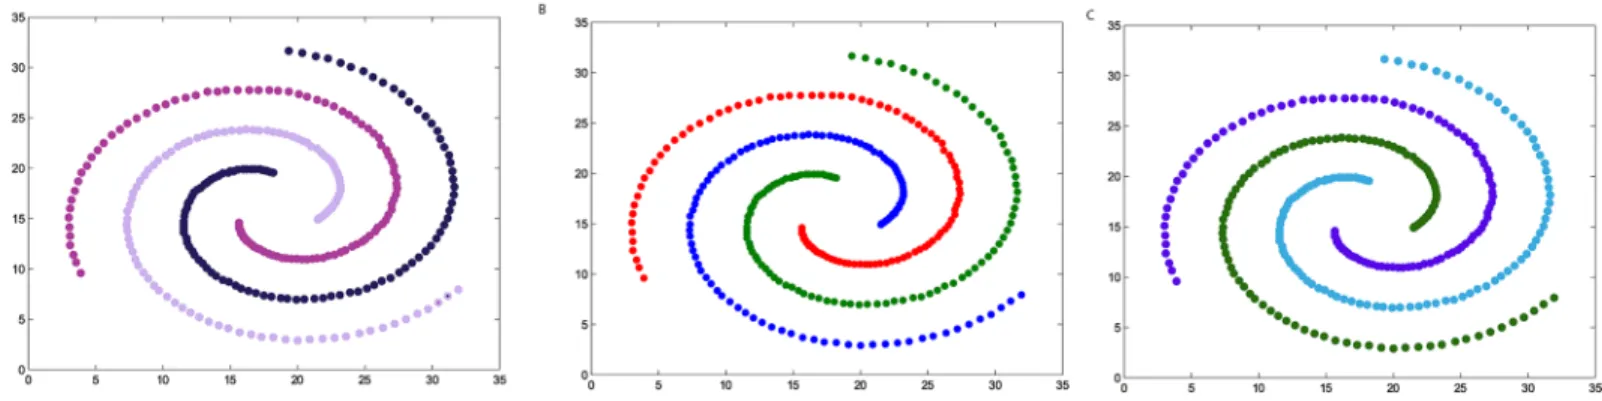
We firstly verify the effectiveness of the DPAM algorithm on two dimensional datasets. The three steps of DPAM are shown inTable 2and Figs2*5. DPAM does not need parameter adjustment and empirical knowledge, which is the greatest advantage of our method. But for the Flame dataset, in which there exist some links or relatively high-density points between clusters, the performance of our method is not as good as that of other datasets. For the Spiral
Fig 1. Influence of parameters on clustering results in four datasets.
https://doi.org/10.1371/journal.pone.0198948.g001
Table 2. The three steps of DPAM on synthetic datasets.
Datasets FMof Stage 1 FMof Stage 2 FMof Stage 3
Jain 0.2164 0.9831 1
Spiral 0.2369 1 1
Flame 0.2226 0.8117 0.9463
Donut 0.1749 1 1
and Donut datasets, the points are relatively evenly distributed, so good performance can be achieved even in the first two stages.
To further demonstrate the effectiveness of our algorithm, we compare it with other density clustering algorithms and report the results in Figs6*9andTable 3. The parameters of DBSCAN and DP are turned through trial and error to obtain the best results. DBSCAN has two parameters:MinPtsandEps, and different results are produced by different values. DP Clustering has just one parameterdc, but its decision phase of cluster centers still needs to be
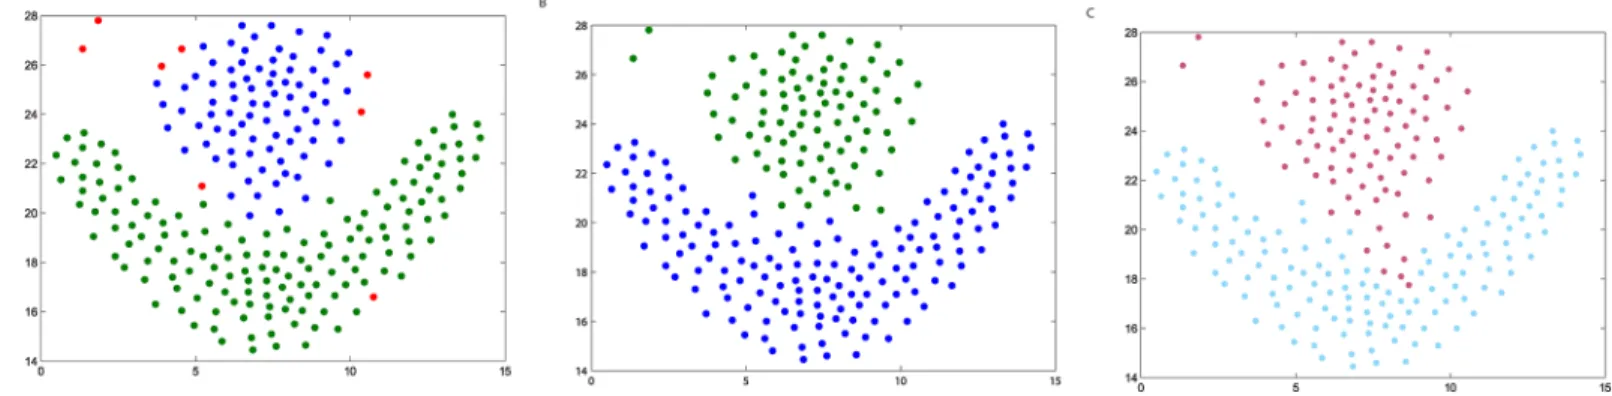
Fig 2. The three steps of DPAM on dataset Jain. (A) Stage 1, (B) Stage 2, (C) Stage 3.
https://doi.org/10.1371/journal.pone.0198948.g002
Fig 3. The three steps of DPAM on dataset Spiral. (A) Stage 1, (B) Stage 2, (C) Stage 3.
https://doi.org/10.1371/journal.pone.0198948.g003
Fig 4. The three steps of DPAM on dataset Flame. (A) Stage 1, (B) Stage 2, (C) Stage 3.
Fig 6. The clustering results of DBSCAN, DP Clustering and DPAM using Jain dataset. (A) DBSCAN (MinPts= 2.9,Eps= 20), (B) DP (percent= 40), (C) DPAM. https://doi.org/10.1371/journal.pone.0198948.g006
Fig 5. The three steps of DPAM on dataset Donut. (A) Stage 1, (B) Stage 2, (C) Stage 3.
https://doi.org/10.1371/journal.pone.0198948.g005
Fig 7. The clustering results of DBSCAN, DP Clustering and DPAM using Spiral dataset. (A) DBSCAN (MinPts= 2.5,Eps= 2), (B) DP (percent= 5), (C) DPAM. https://doi.org/10.1371/journal.pone.0198948.g007
chosen, and sometimes it is difficult to choose how many center points (number of center rep-resents cluster number).
For datasets Jain and Spiral, three algorithms all obtain best results. For datasets Flame, results of DPAM are close to the best. For dataset Dount, DPAM obtains correct results, DP cannot identify it. We take more time than others when algorithms run once, but it may take a long time to learn how to select appropriate parameter values for DBSCAN and DP. Thus DPAM needs less learning time and obtains good results.
Fig 8. The clustering results of DBSCAN, DP Clustering and DPAM using Flame dataset. (A) DBSCAN (MinPts= 1,Eps= 6), (B) DP (percent= 5), (C) DPAM. https://doi.org/10.1371/journal.pone.0198948.g008
Fig 9. The clustering results of DBSCAN, DP Clustering and DPAM using Donut dataset. (A) DBSCAN (MinPts= 1,Eps= 2), (B) DP (percent= 5), (C) DPAM. https://doi.org/10.1371/journal.pone.0198948.g009
Table 3. Comparison of 3 clustering algorithms on synthetic datasets.
Algorithms Jain Spiral Flame Donut
FM Time(s) FM Time(s) FM Time(s) FM Time(s)
DBSCAN 1.0000 0.3460 1.0000 0.1975 0.9659 0.1157 1.0000 0.2498
DPClustering 1.0000 0.4820 1.0000 0.4055 1.0000 0.4189 0.5469 0.3998
DPAM 1.0000 0.5107 1.0000 0.3191 0.9463 0.2220 1.0000 1.4701
The UCI datasets
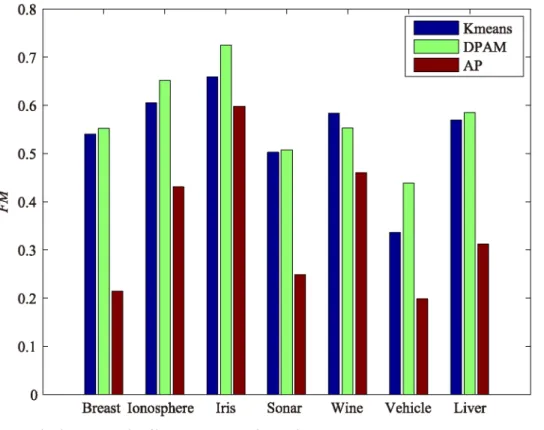
For assessing the robustness of DPAM, we conduct experiments on high-dimensional datasets compared with K-means and affinity propagation (AP) as shown inFig 10. We set parameterk
equal to the real class number in K-means. DPAM achieves better performance than k-means and AP. Although the performance of DPAM is just a bit lower than AP in Wine datasets, while Wine is clustered into 3 groups by DPAM, AP groups Wine into 6 clusters. Obviously, DPAM performs better than AP, because the actual number of classes in Wine is 3.
From the above experimental results, one can see that our method has distinct advantage of effectively and straightforwardly dealing with low-dimensional multi-density spatial data and high-dimensional data requiring no parameter adjustment and no human intervention. Users may require no domain knowledge. However, we also point out its current limitation: DPAM may not well recognize the linked points between clusters. For example, DPAM does not work well with the Flame dataset, but DP Clustering can achieve good results on the Flame dataset by adjusting the parameterdc. This means further investigation is needed to improve DPAM and make it applicable to a wider range of density spatial data.
Conclusions and future work
In this research we present a new approach to adaptively obtain optimal density clustering results. Density propagation based adaptive density clustering adopts a three-stage strategy to clustering low-dimensional density spatial data, and it also perform well on high-dimensional
Fig 10. The clustering results of k-means, DPAM and AP withFM.
data. We report the promising performance of our approach for clustering different datasets and experimental results indicate that our approach overcomes the limitations of some exist-ing clusterexist-ing algorithms.
We also point out the limitation of our approach and the potential improvement upon it. When dealing with data with complex structure, such as the linked spatial data, we still need further investigation on how to improve the performance of our proposed density clustering algorithms. Finally, we will also consider applying DPAM to more real-world problems, including material characterization and selection in manufacturing.
Acknowledgments
This research was supported by the Science & Technology Development Foundation of Jilin Province (Grants Nos. 20160101259JC, 20180201045GX), the National Natural Science Foun-dation of China (Grants No. 61772227) and the Natural Science FounFoun-dation of Xinjiang Prov-ince (Grants No. 2015211C127). This resarch is also supported by the Engineering and Physical Sciences Research Council (EPSRC) funded project on New Industrial Systems: Manufacturing Immortality (EP/R020957/1).
Author Contributions
Conceptualization: Yizhang Wang. Data curation: Yizhang Wang.
Formal analysis: Yizhang Wang, You Zhou. Investigation: Yizhang Wang.
Methodology: Yizhang Wang, Wei Pang, You Zhou. Project administration: Wei Pang, You Zhou. Resources: Yizhang Wang.
Software: Yizhang Wang.
Supervision: Wei Pang, You Zhou. Validation: Yizhang Wang, You Zhou. Visualization: Yizhang Wang, You Zhou. Writing – original draft: Yizhang Wang.
Writing – review & editing: Yizhang Wang, Wei Pang, You Zhou.
References
1. Ram A, Sharma A, Jalal AS, Agrawal A, Singh R. An Enhanced Density Based Spatial Clustering of Applications with Noise. In: 2009 IEEE International Advance Computing Conference; 2009. p. 1475– 1478.
2. Li X, Wong KC. Evolutionary Multiobjective Clustering and Its Applications to Patient Stratification. IEEE Transactions on Cybernetics. 2018; PP(99):1–14.https://doi.org/10.1109/TCYB.2018.2817480 3. Li X, Ma S, Wong KC. Evolving Spatial Clusters of Genomic Regions from High-Throughput Chromatin
Conformation Capture data. IEEE Transactions on Nanobioscience. 2017; PP(99):1–1.https://doi.org/ 10.1109/TNB.2017.2725991
4. Patwary MMA, Palsetia D, Agrawal A, k Liao W, Manne F, Choudhary A. A new scalable parallel DBSCAN algorithm using the disjoint-set data structure. In: High Performance Computing, Networking, Storage and Analysis (SC), 2012 International Conference for; 2012. p. 1–11.
5. Du M, Ding S, Xue Y. A robust density peaks clustering algorithm using fuzzy neighborhood. Interna-tional Journal of Machine Learning and Cybernetics. 2017; p. 1–10.
6. Rehioui H, Idrissi A, Abourezq M. The Research and Selection of Ideal Cloud Services using Clustering Techniques: Track: Big Data, Data Mining, Cloud Computing and Remote Sensing. In: International Conference on Big Data and Advanced Wireless Technologies; 2016. p. 1–6.
7. Kameshwaran K, Malarvizhi K. Survey on Clustering Techniques in Data Mining. 2014 International Journal of Computer Science and Information Technologies. 2014; 5:2272–2276.
8. Rodriguez A, Laio A. Clustering by fast search and find of density peaks. Science. 2014; 344:1492– 1496.https://doi.org/10.1126/science.1242072PMID:24970081
9. Liu P, Zhou D, Wu N. VDBSCAN: Varied Density Based Spatial Clustering of Applications with Noise. In: International Conference on Service Systems and Service Management; 2007. p. 21.
10. Deb K, Pratap A, Agarwal S, Meyarivan T. A fast and elitist multiobjective genetic algorithm: NSGA-II. IEEE Transactions on Evolutionary Computation. 2002; 6(2):182–197.https://doi.org/10.1109/4235. 996017
11. Wang D, Chai Q, Ng GS. Bank failure prediction using an accurate and interpretable neural fuzzy infer-ence system. Ai Communications. 2016; 29(4).https://doi.org/10.3233/AIC-160702
12. Wang D, Chai Q, Ng GS. Ovarian cancer diagnosis using a hybrid intelligent system with simple yet convincing rules. Applied Soft Computing. 2014; 20(7):25–39.https://doi.org/10.1016/j.asoc.2013.12. 018
13. Li X, Wong KC. Multiobjective Patient Stratification using Evolutionary Multiobjective Optimization. IEEE Journal of Biomedical and Health Informatics. 2017; PP(99):1–1.https://doi.org/10.1109/JBHI. 2017.2769711
14. Merwe DWVD, Engelbrecht AP. Data clustering using particle swarm optimization. In: Evolutionary Computation, 2003. CEC’03. The 2003 Congress on. vol. 1; 2004. p. 215–220.
15. Tan Y, Zhu Y. Fireworks Algorithm for Optimization. In: International Conference on Advances in Swarm Intelligence; 2010. p. 355–364.
16. Joshi A, Kaur R. A review: Comparative study of various clustering techniques in data mining. Interna-tional Journal of Advanced Research in Computer Science and Software Engineering. 2013; 3:155.
17. Chrobak M, Du¨rr C, Nilsson BJ. Competitive strategies for online clique clustering. In: International Con-ference on Algorithms and Complexity.; 2015. p. 101–113.
18. Persson M, Fabijan A, Nilsson BJ. Competitive Online Clique Clustering. Lecture Notes in Computer Science. 2013; 7878:221–233.https://doi.org/10.1007/978-3-642-38233-8_19
19. Liu S, Zhu L, Sheong FK, Wang W, Huang X. Adaptive partitioning by local density peaks: An efficient density based clustering algorithm for analyzing molecular dynamics trajectories. Journal of Computa-tional Chemistry. 2017; 38:152–160.https://doi.org/10.1002/jcc.24664PMID:27868222
20. Luxburg, Von U. A tutorial on spectral clustering. Statistics Computing. 2007; 17(4):395–416.https:// doi.org/10.1007/s11222-007-9033-z
21. Frey BJ, Dueck D. Clustering by passing messages between data points. Science. 2007; 315 (5814):972–6.https://doi.org/10.1126/science.1136800PMID:17218491
22. Wang CD, Lai JH, Suen CY, Zhu JY. Multi-Exemplar Affinity Propagation. IEEE Transactions on Pattern Analysis and Machine Intelligence. 2013; 35:2223–2237.https://doi.org/10.1109/TPAMI.2013.28
PMID:23868781
23. Guan R, Shi X, Marchese M, Yang C, Liang Y. Text Clustering with Seeds Affinity Propagation. IEEE Transactions on Knowledge and Data Engineering. 2011; 23:627–637.https://doi.org/10.1109/TKDE. 2010.144
24. Yang C, Bruzzone L, Guan R, Lu L, Liang Y. Incremental and Decremental Affinity Propagation for Semisupervised Clustering in Multispectral Images. IEEE Transactions on Geoscience and Remote Sensing. 2013; 51:1666–1679.https://doi.org/10.1109/TGRS.2012.2206818
25. Zhang H, Liu H, Jiang C, Chu X, Nallanathan A, Wen X. A Practical Semidynamic Clustering Scheme Using Affinity Propagation in Cooperative Picocells. IEEE Transactions on Vehicular Technology. 2015; 64:4372–4377.https://doi.org/10.1109/TVT.2014.2361931
26. Mehmood R, Zhang G, Bie R, Dawood H, Ahmad H. Clustering by fast search and find of density peaks via heat diffusion. Neurocomputing. 2016; 208:210–217.https://doi.org/10.1016/j.neucom.2016.01.102