The multiple outliers detection using agglomerative
hierarchical methods in circular regression model
Siti Zanariah Satari, Nur Faraidah Muhammad Di and Roslinazairimah Zakaria
Faculty of Industrial Sciences & Technology, Universiti Malaysia Pahang, 26300 Gambang, Pahang, Malaysia.
E-mail: [email protected]
Abstract. Two agglomerative hierarchical clustering algorithms for identifying multiple outliers in circular regression model have been developed in this study. The agglomerative hierarchical clustering algorithm starts with every single data in a single cluster and it continues to merge with the closest pair of clusters according to some similarity criterion until all the data are grouped in one cluster. The single-linkage method is one of the simplest agglomerative hierarchical methods that is commonly used to detect outlier. In this study, we compared the performance of single-linkage method with another agglomerative hierarchical method, namely average linkage for detecting outlier in circular regression model. The performances of both methods were examined via simulation studies by measuring their “success” probability, masking effect, and swamping effect with different number of sample sizes and level of contaminations. The results show that the single-linkage method performs very well in detecting the multiple outliers with lower masking and swamping effects.
1. Introduction
This study focuses on two agglomerative hierarchical clustering algorithms for identifying multiple outliers in circular regression models. The first published literature on the solving outlier problem for a circular regression model can be found in [1]. In the study, the identification of outliers for Hussin circular regression model [2] was solved using graphical method (P-P plot, Q-Q plot, circular plot) and discordance tests method (C-Statistic, D-Statistic, and M-Statistic). Since 2010, the row deletion technique becoming the most popular procedure for outlier detection problem for circular regression models where some examples can be found in [3], [4], and [5]. However, the method only focused on identifying a single outlier at one time.
Due to the limitation of row deletion technique, researchers start to explore the applicability of clustering techniques for identifying multiple outliers. Cluster analysis procedures are used for data classification and the aim is to group the items (or variables or data) into their natural groupings with the same characteristic. A Mean Shift Based (MSBC) clustering algorithm that uses single linkage method with Euclidean distance to cluster a circular data set and the method succeeded in detecting outliers at the same time is proposed by [6]. Meanwhile, a new clustering technique known as Satari’s algorithm for identifying multiple outliers in circular regression models, focusing on single linkage agglomerative hierarchical method with a new circular distance formula is proposed by [7]. The clustering algorithm is proposed based on Sebert single linkage clustering procedure in [8], where it is showed that the clustering methods were sensitive to outliers in the simple linear regression model.
Satari’s algorithm in [7] affirmed that the clustering technique is also able to perform well for circular regression model.
In this study, we will consider other agglomerative hierarchical clustering algorithms, namely average linkage to be used for identifying multiple outliers in circular regression model and compare the performance with the existing algorithm proposed by [7]. Here we will focus on Down and Mardia circular-circular regression model in [9] with a unique solution given by
(
)
1 1 2 tan tan 2 u ν β= + − ω −α (1)where ν is dependent random angle, u is the fixed independent angle, ω is a slope parameter in the close interval
[
−1, 1]
, and α andβ
are angular location parameters. Both ν and u follow von Mises distribution denoted as VM(
µ κ,)
where µ is mean direction andκ
is concentration parameter. The angular error, e given as(
)
1 1 2 tan tan . 2 e= −ν β+ − ω u−α (2)also follows a von Mises distribution but has zero mean direction where e~VM
( )
0,κ . [9]2. Methodology
The agglomerative hierarchical clustering algorithm produces a cluster tree that starts with every single data in a single cluster and it continues to merge with the closest pair of clusters according to some similarity criterion until all the data are grouped in one cluster. The single linkage clustering algorithm procedure proposed by [7] identified the cluster group with the smallest size of observation as outliers. The single linkage clustering algorithm is obtained by considering a similarity distance based on a new circular distance formula given by
1 ( | | ||) p ij ik jk k d π π θ θ = =
∑
− − − (3)where dij is the distance between i and j, p is the number of variables, and
θ
ik is the value of kth variable for the ith observation. After the cluster tree were obtained from the single linkage algorithms, the cluster tree must be portioned or “cut” at a certain height based on the stopping rule given as2.06 h
h + s where h is the average heights of the cluster tree for all N – 1 clusters, sh = −2 logRh is the circular standard deviation of the height and Rh is the mean resultant length of the height for N – 1
clusters.
In this study, we extend the proposed procedure given by [7] by considering the average linkage method to produce a cluster tree. In the average linkage algorithm, the distance between two clusters is the average of the dissimilarities between the points in one cluster and the points in the other clusters. While for single linkage, the closest members are calculated by finding the smallest distance and merging the corresponding objects. The proposed clustering algorithm is given as follows:
Step 1: Obtain the predicted (i) and residual (j) values from Down and Mardia circular regression model in [9].
Step 2: Obtain the circular similarity distance between i and j from Step 1 using Eq. (3).
Step 3: Cluster the observation using an average linkage clustering algorithm and obtain the cluster tree.
Step 4: Cut the cluster tree at h+2.06sh.
Step 5: Identify the cluster group with the largest size and consider the remaining cluster groups with minority observations as outliers.
3. Simulation Study
Simulation study is done using S-PLUS statistical package with repetition of 1000 times. We generate a random sample of size n=100 for a fixed independent circular variable u chosen from VM
(
π2, 2)
and a circular error e chosen from VM(
0,κ)
with a set of concentration parameter given by κ=5 and20,
κ = respectively. Then, we calculate the values of the dependent variable v using the Down and Mardia circular-circular regression model with fixed values of
α
=1.5,β
=1.5 and ω =0.5 respectively. At point[ ]
d of v, the observation v d[ ]
is contaminated as[ ] [ ]
*
v d =v d +λπ, (4)
where v d*
[ ]
is the contaminated observation at position[ ]
d and λ is the degree of contamination inthe range of 0≤ ≤λ 1. Six contamination level of λ = 0.0, 0.2, 0.4, 0.6, 0.8 and 1.0 are set to the simulated data and three outliers
(
out=3)
are planted at a certain point[
d d1, 2,d3]
.The power performance of the proposed algorithm is assessed based on [8] using “success” probability (pout), masking error (pmask) and swamping error (pswamp) given in the following formulas: "success" pout s = (5) " " ( )( ) failure pmask out s = (6) " " ( ) false pswamp n out s = − (7)
where “success” is the number of data set that the method has successfully identified all the planted outliers, “failure” is the number of outliers in all data set that detected as inliers, “false” is the number of inliers in all data set that detected as outliers, s is the total number of repetitions, “out” is the number of planted outliers, and n is the number of sample. Masking happens when an outlier is not detected or missed throughout the detection procedure, meanwhile if swamping happen, an inlier is identified as outlier even if they are not influential. Masking is a more serious problem than swamping [8].
4. Results and Discussion
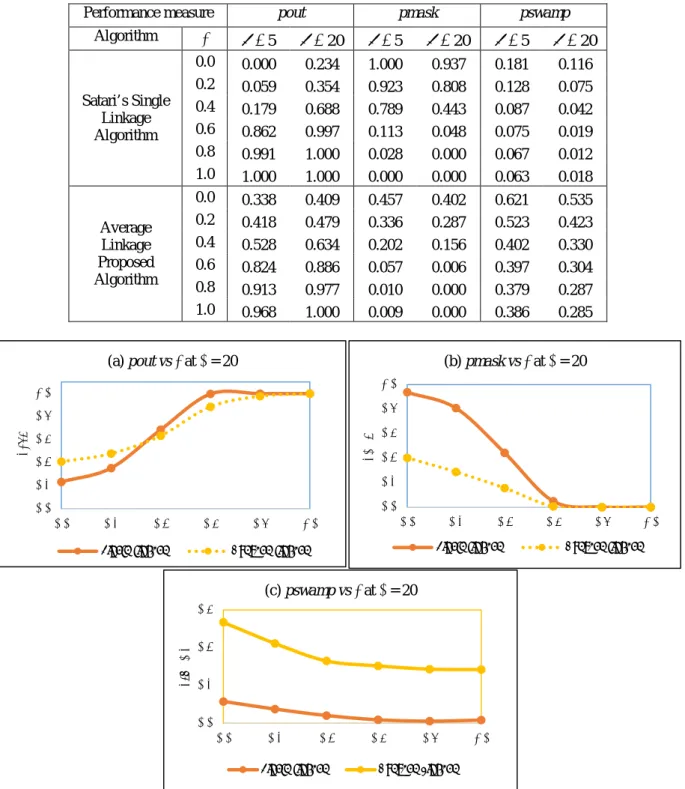
Table 1 shows the power performance of the proposed algorithm as compared to Satari’s algorithm. It can be observed that for both methods, the pout value increases with the increase in the level of contamination λ for any fixed value of the error concentration parameter κ. In general, as the level of contamination λ and error concentration parameter
κ
increased, the pout values approach to one. We can further confirm the findings by looking at the curves pattern of the pout values given in figure 1(a). It can be observed that for both algorithms, the curves pattern approaches one for all values of κ. The larger theκ
value is, the faster the curve approaches to one. However, for low level of contamination, as an example of λ=0.2, the pout value of the proposed algorithm is higher than Satari’s algorithm. These results clearly indicate that the proposed algorithm is applicable in detecting multiple outliers for circular regression model and perform better at low level of contamination or situated closer to the inlying observations.Table 1 also shows the power of performance of the clustering method using masking error (pmask). It can be observed that for both algorithms, the pmask value decreases and gets closer to zero with the increase in the level of contamination λ and error concentration parameter
κ
. Alternatively, the results are presented graphically as shown in figure 1(b). It can be observed that the curve pattern of the pmask is a decreasing function as the level of contamination λ increased. However, it is clearer that the pmask value for the proposed algorithm is approaching zero faster ascompared to Satari’s algorithm. Therefore, it can be concluded that the proposed algorithm has a smaller error or failure in detecting outlier throughout the detection procedure.
Table 1. The power of performance of the clustering method using “success” probability (pout), masking error (pmask) and swamping error (pswamp).
Performance measure pout pmask pswamp
Algorithm λ κ =5 κ=20 κ=5 κ =20 κ=5 κ =20 Satari’s Single Linkage Algorithm 0.0 0.000 0.234 1.000 0.937 0.181 0.116 0.2 0.059 0.354 0.923 0.808 0.128 0.075 0.4 0.179 0.688 0.789 0.443 0.087 0.042 0.6 0.862 0.997 0.113 0.048 0.075 0.019 0.8 0.991 1.000 0.028 0.000 0.067 0.012 1.0 1.000 1.000 0.000 0.000 0.063 0.018 Average Linkage Proposed Algorithm 0.0 0.338 0.409 0.457 0.402 0.621 0.535 0.2 0.418 0.479 0.336 0.287 0.523 0.423 0.4 0.528 0.634 0.202 0.156 0.402 0.330 0.6 0.824 0.886 0.057 0.006 0.397 0.304 0.8 0.913 0.977 0.010 0.000 0.379 0.287 1.0 0.968 1.000 0.009 0.000 0.386 0.285
Figure 1. (a) Plot of success probability (pout) versus level of contamination with concentration parameter
κ
= 20, (b) Plot of masking effect (pmask) versus level of contamination with concentration parameterκ
= 20. (c) Plot of swamping effect (pswamp) versus level of contamination with concentrationparameter
κ
= 20. 0.0 0.2 0.4 0.6 0.8 1.0 0.0 0.2 0.4 0.6 0.8 1.0 po ut λ (a) pout vs λat κ= 20 Single-linkage Average-linkage 0.0 0.2 0.4 0.6 0.8 1.0 0.0 0.2 0.4 0.6 0.8 1.0 pm as k λ (b) pmask vs λat κ= 20Single linkage Average linkage
0.0 0.2 0.4 0.6 0.0 0.2 0.4 0.6 0.8 1.0 ps w am p λ (c) pswamp vs λat κ= 20
Meanwhile, the power of performance of the clustering method using the swamping error (pswamp) is also given in table 1. It can be observed that for both method, the pswamp values decrease with the increase in the level of contamination λ In general, the pswamp values for the proposed algorithm are slightly higher than the pswamp values for Satari’s algorithm regardless of how large are the error concentration parameter
κ
. A clearer representation of this finding is shown in figure 1(c), indicate that, the proposed algorithm has a higher probability of detecting an inlier as outliers.5. Conclusion
In conclusion, based on the values of success probability (pout) and masking error (pmask), we found that the new clustering algorithm performs very well on simulated random data set especially at low level of contamination λ or if the outliers situated closer from inliers. However, based on the values of swamping error (pswamp), the new algorithm is more sensitive as it can falsely detect inliers as outliers if the inliers are situated too close to the outlying group.
Acknowledgement
The Ministry of Higher Education Malaysia and Universiti Malaysia Pahang are acknowledged for the financial support received for this study (FRGS, RDU 160117).
References
[1] Abuzaid A H, Hussin A G and Mohamed I B 2008 Journal of Applied Probability & Statistics
3(1) pp 107-117
[2] Hussin A G, Fieller N R and Stillman E C 2004 Journal of Applied Science and Technology
8(1&2) pp 1-6
[3] Rambli A, Mohamed I B, Abuzaid A H and Hussin A G 2010 Proceedings of the Regional Conference on Statistical Sciences 2010 (RCSS’10) pp 195-203
[4] Abuzaid A H, Hussin A G, Rambli A and Mohamed I B 2012 Communications in Statistics-Simulation and Computation 41(10) pp 1882-1890
[5] Ibrahim S, Rambli A, Hussin A G and Mohamed I 2013 Communications in Statistics-Simulation and Computation 42(10) pp 2270-2280
[6] Yang M S, Chang-Chien S J and Kuo HC 2014 International Conference on Artificial Intelligence and Soft Computing pp 809-818
[7] Satari S Z 2015 Parameter Estimation and Outlier Detection for Some Types of Circular Model PhD Thesis University of Malaya
[8] Sebert D M, Montgomery D C and Rollier D A 1998 Computational Statistics and Data Analysis 27 pp 461-484