Imaging
Article
Breast Tumor Classification Using an Ensemble
Machine Learning Method
Adel S. Assiri1 , Saima Nazir2 and Sergio A. Velastin3,4,5,∗
1 College of Business, King Khalid University, Abha 62529, Saudi Arabia; [email protected] 2 Department of Software Engineering, Fatima Jinnah Women University, The Mall Rawalpindi,
Punjab 46000, Pakistan; [email protected]
3 Applied Artificial Intelligence Research Group, Department of Computer Science,
Universidad Carlos III de Madrid, 28270 Colmenarejo, Spain
4 School of Electronic Engineering and Computer Science, Queen Mary University of London,
London E1 4NS, UK
5 Zebra Technologies Corporation, London SE1 9LQ, UK
* Correspondence: [email protected]
Received: 18 March 2020; Accepted: 25 May 2020; Published: 29 May 2020
Abstract:Breast cancer is the most common cause of death for women worldwide. Thus, the ability of artificial intelligence systems to detect possible breast cancer is very important. In this paper, an ensemble classification mechanism is proposed based on a majority voting mechanism. First, the performance of different state-of-the-art machine learning classification algorithms were evaluated for the Wisconsin Breast Cancer Dataset (WBCD). The three best classifiers were then selected based on their F3 score. F3 score is used to emphasize the importance of false negatives (recall) in breast cancer classification. Then, these three classifiers, simple logistic regression learning, support vector machine learning with stochastic gradient descent optimization and multilayer perceptron network, are used for ensemble classification using a voting mechanism. We also evaluated the performance of hard and soft voting mechanism. For hard voting, majority-based voting mechanism was used and for soft voting we used average of probabilities, product of probabilities, maximum of probabilities and minimum of probabilities-based voting methods. The hard voting (majority-based voting) mechanism shows better performance with 99.42%, as compared to the state-of-the-art algorithm for WBCD.
Keywords: breast cancer tumor; classification; majority-based voting mechanism; multilayer perceptron learning network; simple logistic regression; stochastic gradient descent learning; wisconsin breast cancer dataset
1. Introduction
Breast cancer is one of the leading causes of death among women. According to a 2013 World Health Organization report, “It is estimated that over 508,000 women died worldwide in 2011 due to breast cancer”. Breast cancer can be cured and prevented in the primary stages. However, many women are diagnosed with cancer when it is too late. Breast cancer occurs in the breast cells, fatty tissues or fibrous connective tissues within the breast. Breast cancer tumors tend to gradually worsen and grow faster, which causes death [1]. Although it is more common among women, it can also occur among men. Different factors such as age and family history can also increase the risk of breast cancer. Breast cancer tumors are classified into two classes, benign and malignant [2]. A benign tumor is not dangerous for the human body and rarely causes death in humans. This type of tumor grows in one part of the body and has limited growth. A malignant tumor is more dangerous and can cause death in humans. This type of tumor grows rapidly because of the abnormal growth of cells.
The main types of breast cancer are invasive ductal carcinoma, ductal carcinoma in situ and invasive lobular carcinoma. Ductal carcinoma in situ is the earliest stage of breast cancer and is curable. Invasive ductal carcinoma originates in the milk duct and is the most common breast cancer. Invasive lobular carcinoma can quickly spread to lymph nodes and other areas of the body. It starts in a lobule of the breast.
Approximately one million women are diagnosed with breast cancer every year worldwide. In the early stage, the rate of survival can be high; the five-year survival rate at this stage is 81%. However, only 35% women with late or advanced-stage breast cancer survive for five years. Turkki et al. [3] stated that prognostic assessment using machine learning techniques is possible without a prior knowledge of breast cancer pathology.
This paper proposes a novel ensemble classification method for breast tumor classification using machine learning classification methods. We evaluated the performance of the following classification algorithms: simple logistic Regression learning, SVM learning with stochastic gradient descent optimization and multilayer perceptron network, random decision tree method, random decision forest method, SVM learning with sequential minimal optimization, K-nearest neighbor classifier, and Naïve Bayes classification. The prediction of the three best classification algorithms are then used for ensemble classification. For ensemble classification, we used unweighted voting mechanisms including majority-based voting and four minimum probabilities, maximum probabilities, product of probabilities, and the average of probabilities. The performance of the proposed approach is evaluated on the publicly available Wisconsin Breast Cancer Dataset (WBCD).
The rest of the paper is arranged as follows: Section2reviews existing work on breast cancer tumor detection and discusses the importance of the use of appropriate performance measure in medical diagnostics. In Section3the proposed methodology is explained in detail, followed by the experimentation and results discussion in Sections4and5. Section7concludes the paper and suggests some future direction of research for breast cancer tumor classification.
2. Related Work
Many researchers have emphasized the importance of AI and deep learning in healthcare for the delivery of improved quality and safety of care [4–12]. Bejnordi et al. [8] used deep learning algorithm to diagnose breast cancer tumors and compared performance with pathologists’ diagnoses. Results showed that automatic detection using deep learning algorithm outperformed human diagnosis. Khan et al. [13] combined features extracted via GoogleNet, VGGNet and ResNet by using transfer learning.
Haifeng et al. [14] proposed a novel method for breast cancer prediction using data mining techniques. They formulated an effective way to predict breast cancer based on patients’ clinical records. They evaluated the method on two popular publicly available datasets: the Wisconsin Breast Cancer Database (WBCD) and the Wisconsin Diagnostic Breast Cancer (WDBC) dataset. They evaluated the performance of support vector machines (SVMs), eight learning models, artificial neural networks (ANNs), Naïve Bayes classification and AdaBoost Tree. They proposed a combined model based on principal component analysis and other data mining models for feature reduction and suggested that other models such as k-mean could be used for feature space reduction.
In contrast, Quang et al. [15] used both supervised and unsupervised classification models for breast tumor classification. They proposed a combination of scaling and principal component analysis for feature selection. They proved that an ensemble voting approach is the best prediction model. After feature selection, various classification models were tested and trained on the data. Among all the models used for the prediction, only four models: ensemble-voting classifier, logistic regression (LR), SVM and AdaBoost showed better performance, with accuracies of around 90% based on the models’ results for precision and recall, Area Under the Receiver Operating Characteristics (AUC-ROC), F1 measure and computational time.
Ahmed et al. [16] used decision trees (DTs), ANNs and SVMs. The implementation of different algorithms indicated that SVMs [17] outperform other classifiers on the WBCD. DT, ANN and SVMs showed 93.6%, 94.7% and 95.7% accuracy, respectively. They used 10-fold cross validation for evaluation. Mandal et al. [18] used LR, Naïve Bayes (NB) and DTs. They also analyzed the time complexity of each classifier. LR outperforms other classifiers with the highest accuracy. However, Borges et al. [19] evaluated the performance of Bayesian networks and DT and found that Bayesian networks performed better, with 97.80% accuracy.
Chaurasia et al. [20] used Bayesian theorem, DT, radial basis function network and J48. They evaluated the results on the WBCD dataset and applied pre-processing, data selection and data transformation to form a prediction model. They found that Naïve Bayes outperformed other models with a classification accuracy of 97.36%. Radial Basis Function (RBF) Network and J48 showed classification accuracies of 96.77% and 93.41%, respectively.
Kumar et al. [21] predicted breast cancer using twelve classification algorithms: AdaBoost, J-Rip, LR, lazy learner, decision table, IBK, J48, lazy K-star, multiclass classifier, multilayer perceptron, random forest, Naïve Bayes and random tree. They stated that other than Naïve Bayes classification, the algorithms performed with accuracy greater than 94% and that lazy and tree classifications outperformed other classification algorithms, with 99% accuracy.
Lee et al. [22] stated that although ensemble learning enables the improvement of performance of a base learner, it decreases the bias or variance. Abdar et al. [23] proposed a new ensemble classification algorithm, CWV-BANNSVM, by combining Boosting Artificial Neural Network (BANN) along with two SVMs to improve the performance for WBCD. In contrast to traditional ensemble learning, Alam et al. [24] proposed a novel dynamic ensemble learning algorithm to automatically determine the number of neural networks and their architecture. Different training sets are used for each neural network hence guaranteeing better learning from the whole training data samples. The proposed DEL is trained several times to find the correct values of learning rate parameter and the correlation strength parameter by using an incremental training approach. Osman et al. [25] stated that improvement is possible when using the ensemble boosting method. The method was integrated with a Radial Basis Function neural network algorithm and performance was increased to an accuracy of 98.4% for the WBCD dataset.
Most of the reported literature evaluates the performance of the proposed method based on ‘accuracy’. Accuracy is higher when the occurrence of true positives (TPs) and true negatives (TNs) is high compared to the false positives (FPs) and false negatives (FNs). Other than accuracy, precision and recall are also important for performance reporting. However, for medical diagnostic the performance of artificial intelligence systems should give more importance to false negatives (recall) than false positives (precision), because missing a condition can have serious consequences for patients. Therefore, it is important to evaluate the performance based on f-measures (e.g., F2, F3) that weigh recall more than precision.
3. Methodology
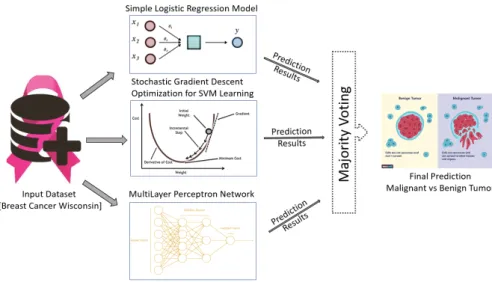
In this paper, a novel algorithm is proposed for breast tumor classification using a voting mechanism. The publicly-available WBCD is used for evaluation and comparisons are made with existing state-of-the-art methods. As shown in Figure1, the input dataset is supplied to the different classification learning models to detect and differentiate malignant and benign tumors.
The performance of eight different state-of-the-art machine learning classification algorithms were tested for tumor classification: simple logistic regression model, SVM learning with stochastic gradient descent optimization, multilayer perceptron network, random decision tree method, random decision forest method, SVM learning with sequential minimal optimization, k-nearest neighbor classification and Naïve Bayes classification algorithm.
These classifiers are evaluated and three classification algorithms are selected based on the best performance calculated using an f-measure. These selected classifiers are used to propose a new
ensemble classification method based on a voting mechanism. In this paper, two different voting mechanism were evaluated: hard voting (majority-based voting) and soft voting. Soft voting consist of either average of probabilities voting, product of probabilities, minimum of probabilities or maximum of probabilities voting.
The classification results of the three best classifiers are supplied to the ensemble classification method, which provides a final classification result. Details of the classification models and voting mechanism used are given in the following sub-sections.
Figure 1.An ensemble method based on majority-based voting mechanism for breast cancer tumor classification using different machine learning models.
3.1. Classification Methods
3.1.1. Simple Logistic Regression Model
The LR classification model [26] is a popular choice for modeling binary classifications. For this model, the conditional probability of one of the two output classes is assumed to be equal to a linear combination of the input features [27]. The logistic equation used for this classification model is:
Zi = ln( Pi 1− Pi
) (1)
wherePis the probability of the occurrence of eventi.
3.1.2. SVM Learning with Stochastic Gradient Descent (SGD) Optimization
We used SGD for support vector machine classification algorithm with hinge loss function. Gradient descent is one of the most popular optimization algorithms used in deep learning and machine learning algorithms. Stochastic gradient descent [28] selects random samples from a dataset instead of selecting the batch data as in batch gradient descent. Stochastic gradient descent optimization randomly shuffles samples in the training data set. It computes gradient and performs weight updates for each selected training samplex(i)and the labeloutput(i)until a minimum cost(Jmin(w))is reached.
Randomly shuffle samples in the training set Until approx. cost minimum(Jmin(w))is reached:
For each training samplei:
Compute gradients and perform weight updates For each weightj
wj=w+∆wj,where:∆wj =η(target(i)−output(i))x(ji),ηis learning rate
3.1.3. Multilayer Perceptron Network
A multilayer perceptron (MLP) [29] is an artificial neural network that contains many perceptrons. It is traditionally structured into three groups of layers, the input layer, the output layer and the (hidden) layers between these two. A deep network consists of many hidden layers. These hidden layers hold the key to multilayer perceptron computation. MLPs are often applied on supervised learning algorithms and learn the model based on the correlation between input and output variables. 3.1.4. Random Decision Tree
The random decision tree is one of the popular supervised machine learning algorithms used for the graphical representation of all the possible solutions [30]. The decisions are based on some conditions and are easy to interpret. It identifies and chooses the significant attributes that are helpful in classification. It selects only those attributes that return the highest information gain (IG).IGis defined as:
IG = E(ParentNode) − AverageE(ChildNodes) (3)
where Entropy (E) is defined as:
E =
∑
i
−Probi(log2Probi) (4)
andProbiis the probability of classi. 3.1.5. Random Decision Forest
Random decision forest is similar to the bootstrapping algorithm with decision tree (CART) model. Random decision forest tries to buildkdifferent decision trees by picking a random subsetSof training samples [31]. It generates the full Iterative Dichotomiser 3 (ID3) [32] trees with no pruning. It makes a final prediction based on the mean of each prediction. Random decision trees can interpret and handle irrelevant attributes in a simple manner. They are compact and can handle missing data. 3.1.6. SVM Learning with Sequential Minimal Optimization (SMO)
SMO [33] is the optimization method for Support Vector Machine (SVM) [34] training problem. SMO is more efficient than the quadratic programming solvers and uses heuristics to divide the whole training problem into minor problems so that these smaller problems can be solved analytically. Usually, it reduces training time by a wide margin. SMO uses “John Platt’s sequential minimal optimization algorithm” [35] for training an SVM [36].
3.1.7. K-Nearest Neighbor Classification
KNN [37] stores all the training data and classifies the query data based on a similarity measure. In KNNs,kis used to refer to the number of nearest neighbors that are to be included in the voting processes. KNNs use feature similarity. To get better performance, KNN parameter tuning is done by choosing an appropriate value ofk. The similarity between two points is calculated using, for example, the Euclidean distance.
3.1.8. Naïve Bayes Classification
The Naïve Bayes classification algorithm [38] is normally famous for its simplicity as well as effectiveness. The Naïve Bayes classification model is fast to build and it makes quick predictions. Naïve Bayes is a probabilistic classifier and it learns the probabilities of features based on the target class. It assumes that the occurrence of a particular attribute is independent of the occurrence of the other attributes. Even if it depends on the other attributes, Naïve Bayes can show better performance as it
does not require accurate probabilities estimates provided that the highest probability is allocated to the correct class. It is based on the Bayes theorem which states that:
P(A|B) = P(B|A)P(A)
P(B) (5)
whereP(A|B)andP(B|A)are the conditional probabilities of occurrence of an eventAgiven that eventBis true and vice versa. A, P(A), P(A|B)andP(B|A) are called proposition, prior probability, posterior probability and likelihood, respectively.
3.2. Voting Mechanism
3.2.1. Majority-Based Voting Mechanism (Hard Voting)
Majority-based voting [39] is widely used in ensemble classification. It is also known as plurality voting. In the approach proposed here, after applying the three above-mentioned classification algorithms, a majority-based voting mechanism is used to improve the classification results [40]. Each of these model classification results is computed for each test instance and the final output is predicted based on the majority results. In majority voting, the class labelyis predicted via majority (plurality) voting of each classifierC:
y = mode {C1(x), C2(x), .., Cn(x)} (6)
3.2.2. Soft Voting
In soft voting, the final output is predicted based on the predicted probabilities p for the classifiers [41]. In each case below, the probability of class labels assigned by the classifierC to inputxis defined as:
Average of Probabilities Voting:y= AVERAGE {C1(x), C2(x), ..., CL(x)} (7)
Product of Probabilities Voting:y= PROD {C1(x), C2(x), ..., CL(x)} (8)
Minimum of Probabilities Voting:y= MI N {C1(x), C2(x), ..., CL(x)} (9)
Maximum of Probabilities Voting:y= MAX {C1(x), C2(x), ..., CL(x)} (10) 4. Results
The publicly available WBCD dataset was analyzed (it can be downloaded from the UCI repository [42]). This dataset contained data taken from microscopic examination of breast masses. A digital scan of fine-needle aspirates was used to compute features. Fine-needle aspirate is one of the best methods to evaluate the presence of malignant tumors.
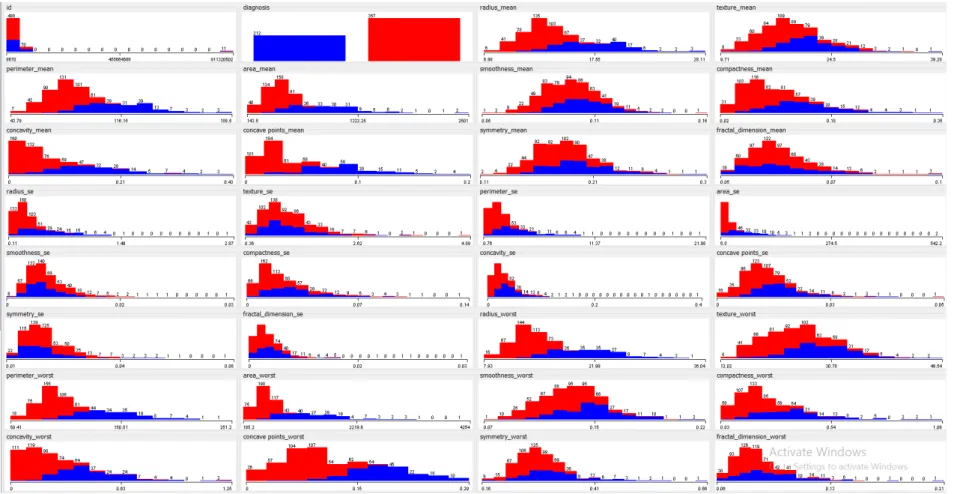
This dataset was comprised of 569 instances. Each instance contained 32 features that were extracted from images of nuclei. These include the nucleus texture, radius, perimeter, smoothness, area, compactness, concave points, concavity, fractal dimension and symmetry. The remaining features were computed by taking the mean, standard error and worst or largest mean of the above-mentioned features. Figure2shows the univariate attribute distribution of the above-mentioned features where the x-axis represents the attribute value and the y-axis represents the frequency of each value for both classes. The first and second features shown in Figure2are ID and diagnosis class (malignant/benign). Results shown in red and blue represent benign and malignant classes, respectively. A 70%–30% training-testing split was used for evaluation, as commonly reported in the literature.
Performance Evaluation Measures
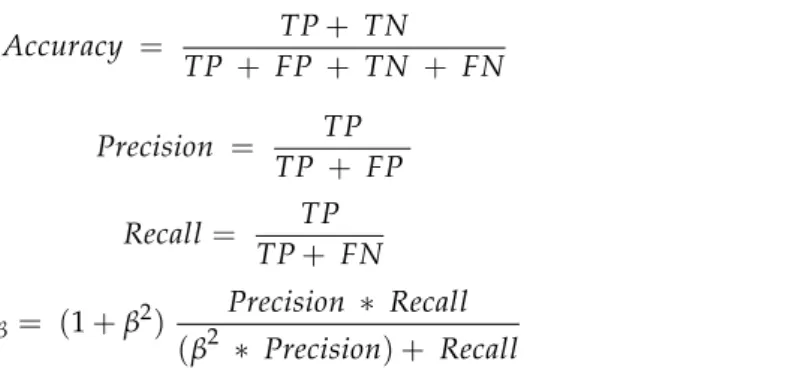
Given the true positive (TP), false positive (FP), true negative (TN) and false negative (FN) counts, the following performance evaluation measures were calculated:
Accuracy = TP+ TN TP + FP + TN + FN (11) Precision = TP TP + FP (12) Recall= TP TP+ FN (13) Fβ = (1+β 2) Precision ∗ Recall (β2 ∗ Precision) + Recall (14) whereβ2is a positive real number. For F1, F2, F3 score calculation,βis set to 1, 2 and 3 respectively.
In medical diagnostics research, precision and recall are the main metrics used for reporting performance. F-measure is also important in reporting performance in medical diagnostics, because it combines precision and recall into a single figure which is simpler to use for comparisons. In the medical community, a false negative is normally more devastating than a false positive therefore, recall is considered to be a more important measurement. An FP (precision) might not be as important as an FN (recall) because FPs can be discarded by clinicians but a missed condition could be very serious for a patient. In the light of that, a modified form of F1 that weighs recall more heavily than precision is a better metric. Therefore in this work F2 and F3 were used.
5. Discussion
The performances of eight different classification algorithms are evaluated on the WBCD testing dataset. Table1shows the computational time for these classification algorithms. Multilayer perceptron network takes longer than the other algorithms. For simple logistic regression, the L2 regularization method was used with the conjugate gradient (CG) method for optimization. SGD used optimal learning rate with alpha = 0.0001 and L2 regularization method for SVM. The hidden layer size for MLP was set to 100, with ‘relu’ activation function and stochastic gradient-based optimizer for weight optimization with learning rate set to 0.002. Random decision tree used Gini impurity to split the tree. The nodes were expanded until all leaves are pure or until all leaves contained less than two. An SMO optimization method normalized the training data and polynomial kernel for classification using SVM. For KNN, k = 4 nearest neighbors were searched using an Euclidean distance measure, and each neighbor was weighted equally for classification purposes. For Naïve Bayes classification, numeric estimator precision values were chosen based on the analysis of the training data.
Table 1.Computational times for the classification algorithms.
Classification Algorithm Computational Time (s)
Simple logistic regression model 0.34
SVM learning with SGD optimization 0.13
Multilayer perceptron network 3.10
Random decision tree method 0.01
Random decision forest method 0.06
SVM learning with SMO 0.30
K-nearest neighbor classification 0.01
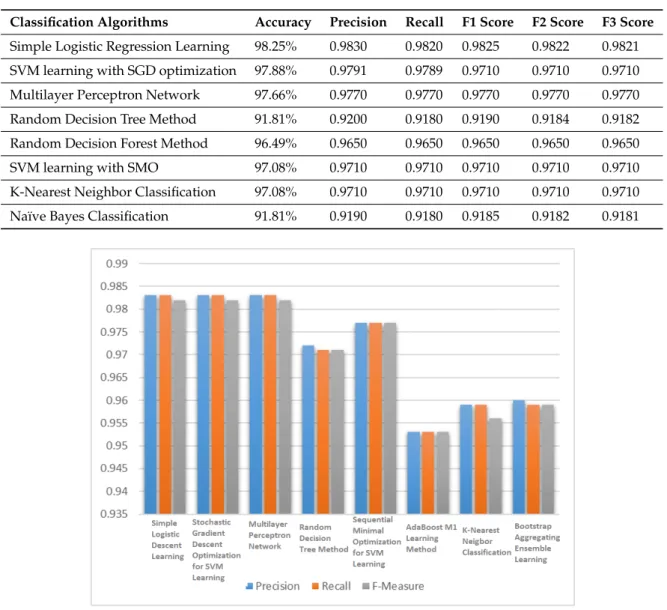
Table2shows the results for testing data on WBCD. The SLR model chose the attributes that resulted in the lowest possible squared error. SGD learning removed all the missing values and converts nominal attributes into binary ones. All attributes were also normalized. MLP learning used a back propagation algorithm for learning. All the nodes in MLP network were sigmoid. At each node, random decision tree considered randomly chosen k attributes without performing pruning. The SMO method made use of John Platt’s optimization algorithm for training SVM. KNN selected an appropriatekbased on cross validation and performs distance weighting for learning. Figure3compared the performance of the all eight classifiers in terms of F3 score. The simple logistic regression (SLR) learning model, SVM learning with stochastic gradient descent (SGD) optimization and multilayer perceptron network (MLP) showed better performance in terms of F3 score than the other five classification algorithms.
Table 2.Performance of the machine learning algorithms on WBCD.
Classification Algorithms Accuracy Precision Recall F1 Score F2 Score F3 Score
Simple Logistic Regression Learning 98.25% 0.9830 0.9820 0.9825 0.9822 0.9821
SVM learning with SGD optimization 97.88% 0.9791 0.9789 0.9710 0.9710 0.9710
Multilayer Perceptron Network 97.66% 0.9770 0.9770 0.9770 0.9770 0.9770
Random Decision Tree Method 91.81% 0.9200 0.9180 0.9190 0.9184 0.9182
Random Decision Forest Method 96.49% 0.9650 0.9650 0.9650 0.9650 0.9650
SVM learning with SMO 97.08% 0.9710 0.9710 0.9710 0.9710 0.9710
K-Nearest Neighbor Classification 97.08% 0.9710 0.9710 0.9710 0.9710 0.9710
Naïve Bayes Classification 91.81% 0.9190 0.9180 0.9185 0.9182 0.9181
Figure 3.F3 score of the classification algorithms for WBCD.
After analyzing these results, the three best classifiers were selected based on F3 score i.e., simple logistic learning, SVM learning with stochastic gradient descent optimization and multilayer perceptron network and passed their classification results to different voting mechanisms to predict a final output. For ensemble method classification, different unweighted voting schemes were used i.e., minimum probabilities, maximum probabilities, majority voting, product of probabilities and the average of probabilities.
Table3shows the results of the voting mechanisms for the WBCD. The results showed that majority-based voting performed better than the other voting mechanisms. Usually it is assumed that soft voting performs better than hard voting as it considers more information by using individual classifier’s uncertainty in the final prediction. However, these experiments show that for WBCD, the selected classification algorithms and majority-based voting (hard voting) performs better than soft voting mechanisms i.e., average of probabilities voting, product of probabilities, maximum of probabilities and minimum of probabilities. This might be explained because of the low confidence (low probability) of the selected classification algorithms. All these results reported are for 70:30 training testing split. For 10, 5 and 2 fold cross validation, the proposed algorithm achieved accuracies of 98.77%, 98.43%, and 99.23% respectively.
Table 3.Evaluation results of the proposed voting mechanisms for the WBCD.
Voting Mechanism Accuracy Precision Recall F1 Score F2 Score F3 Score
Majority-based 99.42% 0.9940 0.9940 0.994 0.9940 0.9940
Average of probabilities 98.83% 0.989 0.988 0.9885 0.9882 0.9881
Product of probabilities 98.12% 0.9850 0.9850 0.9850 0.9850 0.9850
Minimum of probabilities 98.46% 0.986 0.981 0.9835 0.9820 0.9815
Maximum of probabilities 99.41% 0.9840 0.9840 0.9840 0.9840 0.9840
6. Comparison with Existing Work
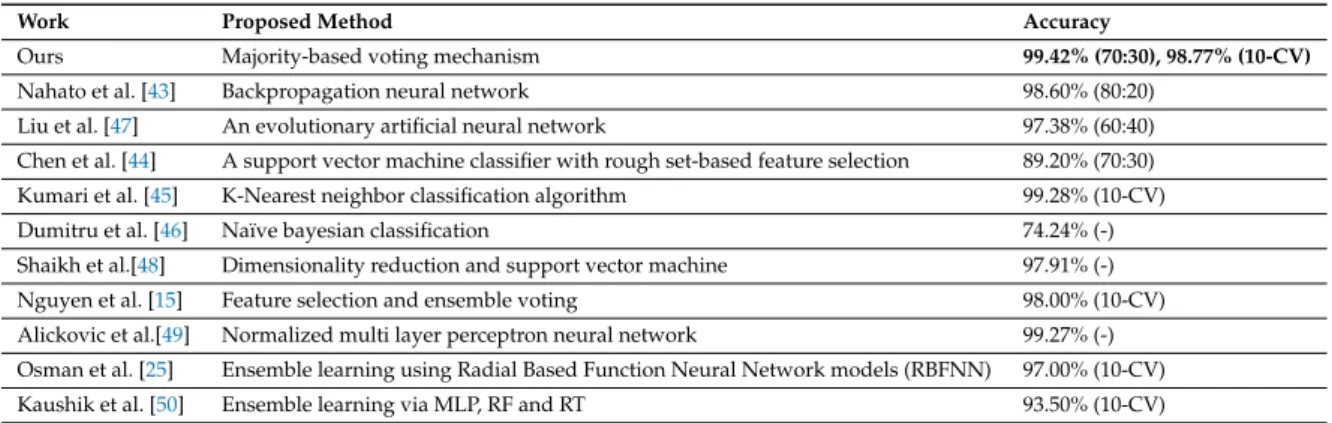
Table4 shows a comparison between the proposed majority-based voting mechanism with existing work on breast cancer prediction using the WBCD. Nahato et al. [43] used a back propagation neural network. Chen et al. [44] Kumari et al. [45] and Dumitru et al. [46] used conventional prediction algorithms like support vector machines, K-nearest neighbor and Naïve Bayes, respectively. Liu et al. [47] proposed a novel evolutionary neural network approach and Nguyen et al. [15] used feature scaling and principle component analysis prior to model training. Osman et al. [25] enhance the performance of radial based function neural network model (RFBNN) by integrating the neural network with ensemble features using a boosting method. As far as we can ascertain, the proposed approach performs better than any in the literature to date.
Table 4.Comparison with the existing work for breast cancer prediction using WBCD.
Work Proposed Method Accuracy
Ours Majority-based voting mechanism 99.42% (70:30), 98.77% (10-CV)
Nahato et al. [43] Backpropagation neural network 98.60% (80:20) Liu et al. [47] An evolutionary artificial neural network 97.38% (60:40) Chen et al. [44] A support vector machine classifier with rough set-based feature selection 89.20% (70:30) Kumari et al. [45] K-Nearest neighbor classification algorithm 99.28% (10-CV) Dumitru et al. [46] Naïve bayesian classification 74.24% (-) Shaikh et al.[48] Dimensionality reduction and support vector machine 97.91% (-) Nguyen et al. [15] Feature selection and ensemble voting 98.00% (10-CV) Alickovic et al.[49] Normalized multi layer perceptron neural network 99.27% (-) Osman et al. [25] Ensemble learning using Radial Based Function Neural Network models (RBFNN) 97.00% (10-CV) Kaushik et al. [50] Ensemble learning via MLP, RF and RT 93.50% (10-CV)
7. Conclusions
Breast cancer offers a unique context for medical diagnosis by also considering the patients’ condition, and their response to treatment. Machine learning has shown considerable improvement for breast cancer diagnosis. However, challenges remain for accurate diagnosis and monitoring of breast tumors despite improved technologies. There is a need to integrate the biological,
social and demographic stream of information to improve the predictive models. We have proposed here an ensemble classification by evaluating the performance of simple logistic regression learning, SVM learning with stochastic gradient descent optimization and multilayer perceptron network, random decision tree, random decision forest, support vector machine learning with sequential minimal optimization, K-nearest neighbor classifier, and Naïve Bayes classification algorithms. We have reported the performance of these eight classifiers using different performance measures i.e., accuracy, precision, recall, F1 score, F2 score, and F3 score. Then, we selected the three classifiers with the best F3 score and proposed an ensemble method using a voting mechanism. We used different unweighted voting mechanisms including majority-based voting, average of probabilities, product of probabilities, minimum of probabilities and maximum of probabilities. The majority-based voting mechanism shows better F3 score than the other voting mechanism with results that outperform the state-of-the-art, as far as we can establish.
For future research, we plan to evaluate different feature selection algorithms that can help us determine the smallest subset of features that can assist in accurate classification of breast cancer as either benign or malignant. Instead of an unweighted voting mechanism, researchers can evaluate the performance of different weighted voting mechanisms including simple weighted voting, rescaled weighted voting, best-worst weighted voting and quadratic best-worst weighted voting. It would be useful to use other datasets for breast cancer classification to evaluate and improve the performance of proposed algorithm. The findings of the present study can be a good starting point for breast tumor classification using the image dataset too.
Author Contributions: Conceptualization, A.S.A. and S.N.; methodology, S.N.; software, A.S.A.; validation, A.S.A., S.N. and S.A.V.; formal analysis, A.S.A.; investigation, A.S.A.; resources, S.N. and A.S.A.; data curation, A.S.A.; writing—original draft preparation, A.S.A.; writing—review and editing, S.N. and S.A.V.; visualization, A.S.A., S.N. and S.A.V.; supervision, S.N.; project administration, A.S.A. and S.N. All authors have read and agreed to the published version of the manuscript.
Funding:This research received no external funding.
Acknowledgments: A.S.A. would like to express his gratitude to King Khalid University, Saudi Arabia for providing administrative and technical support.
Conflicts of Interest:The authors declare no conflict of interest. References
1. Chagpar, A.B.; Coccia, M. Factors associated with breast cancer mortality-per-incident case in low-to-middle income countries (LMICs).J. Clin. Oncol.2019,37, 15. [CrossRef]
2. Sharma, G.N.; Dave, R.; Sanadya, J.; Sharma, P.; Sharma, K. Various types and management of breast cancer: An overview.J. Adv. Pharm. Technol. Res.2010,1, 109. [PubMed]
3. Turkki, R.; Byckhov, D.; Lundin, M.; Isola, J.; Nordling, S.; Kovanen, P.E.; Verrill, C.; von Smitten, K.; Joensuu, H.; Lundin, J.; et al. Breast cancer outcome prediction with tumour tissue images and machine learning. Breast Cancer Res. Treat.2019,177, 41–52. [CrossRef] [PubMed]
4. Guo, Y.; Shang, X.; Li, Z. Identification of cancer subtypes by integrating multiple types of transcriptomics data with deep learning in breast cancer. Neurocomputing2019,324, 20–30. [CrossRef]
5. Golden, J.A. Deep learning algorithms for detection of lymph node metastases from breast cancer: Helping artificial intelligence be seen. JAMA2017,318, 2184–2186. [CrossRef]
6. Li, L.; Pan, X.; Zhang, L. Multi-task deep learning for fine-grained classification and grading in breast cancer histopathological images.Multimed. Tools Appl.2018,810, 85–95. [CrossRef]
7. Zhu, Z.; Albadawy, E.; Saha, A.; Zhang, J.; Harowicz, M.R.; Mazurowski, M.A. Deep learning for identifying radiogenomic associations in breast cancer. Comput. Biol. Med.2019,109, 85–90. [CrossRef]
8. Bejnordi, B.E.; Veta, M.; Van Diest, P.J.; Van Ginneken, B.; Karssemeijer, N.; Litjens, G.; Van Der Laak, J.A.; Hermsen, M.; Manson, Q.F.; Balkenhol, M.; et al. Diagnostic assessment of deep learning algorithms for detection of lymph node metastases in women with breast cancer. JAMA2017,318, 2199–2210. [CrossRef]
9. Bi, W.L.; Hosny, A.; Schabath, M.B.; Giger, M.L.; Birkbak, N.J.; Mehrtash, A.; Allison, T.; Arnaout, O.; Abbosh, C.; Dunn, I.F.; et al. Artificial intelligence in cancer imaging: Clinical challenges and applications. CA Cancer J. Clin.2019,69, 127–157. [CrossRef]
10. Lamy, J.B.; Sekar, B.; Guezennec, G.; Bouaud, J.; Séroussi, B. Explainable artificial intelligence for breast cancer: A visual case-based reasoning approach. Artif. Intell. Med.2019,94, 42–53. [CrossRef]
11. Shen, L.; Margolies, L.R.; Rothstein, J.H.; Fluder, E.; McBride, R.; Sieh, W. Deep learning to improve breast cancer detection on screening mammography. Sci. Rep.2019,9, 1–12. [CrossRef] [PubMed]
12. Coccia, M. Deep learning technology for improving cancer care in society: New directions in cancer imaging driven by artificial intelligence. Technol. Soc.2020,60, 101198. [CrossRef]
13. Khan, S.; Islam, N.; Jan, Z.; Din, I.U.; Rodrigues, J.J.C. A novel deep learning based framework for the detection and classification of breast cancer using transfer learning. Pattern Recognit. Lett.2019,125, 1–6. [CrossRef]
14. Wang, H.; Yoon, S.W. Breast cancer prediction using data mining method. In Proceedings of the IIE Annual Conference Expo 2015, Nashville, TN, USA, 30 May–2 June 2015; pp. 818–828.
15. Nguyen, Q.H.; Do, T.T.; Wang, Y.; Heng, S.S.; Chen, K.; Ang, W.H.M.; Philip, C.E.; Singh, M.; Pham, H.N.; Nguyen, B.P.; et al. Breast Cancer Prediction using Feature Selection and Ensemble Voting. In Proceedings of the 2019 International Conference on System Science and Engineering (ICSSE), Dong Hoi City, Vietnam, 20–21 July 2019; pp. 250–254.
16. Ahmad, L.G.; Eshlaghy, A.; Poorebrahimi, A.; Ebrahimi, M.; Razavi, A. Using three machine learning techniques for predicting breast cancer recurrence. J. Health Med. Inf.2013,4, 3.
17. Nazir, S.; Ghazanfar, M.A.; Aljohani, N.R.; Azam, M.A.; Alowibdi, J.S. Data analysis to uncover intruder attacks using data mining techniques. In Proceedings of the 2017 5th International Conference on Information and Communication Technology (ICoIC7), Melaka, Malaysia, 17–19 May 2017; pp. 1–6.
18. Mandal, S.K. Performance analysis of data mining algorithms for breast cancer cell detection using Naïve Bayes, logistic regression and decision tree. Int. J. Eng. Comput. Sci.2017,6, 20388–20391.
19. Borges, L.R. Analysis of the Wisconsin Breast Cancer Dataset and Machine Learning for Breast Cancer Detection. Group1989,1, 369.
20. Chaurasia, V.; Pal, S.; Tiwari, B. Prediction of benign and malignant breast cancer using data mining techniques.J. Algorithms Comput. Technol.2018,12, 119–126. [CrossRef]
21. Kumar, V.; Mishra, B.K.; Mazzara, M.; Verma, A. Prediction of Malignant & Benign Breast Cancer: A Data Mining Approach in Healthcare Applications. arXiv 2019, arXiv:1902.03825.
22. Lee, S.; Amgad, M.; Masoud, M.; Subramanian, R.; Gutman, D.; Cooper, L. An Ensemble-based Active Learning for Breast Cancer Classification. In Proceedings of the 2019 IEEE International Conference on Bioinformatics and Biomedicine (BIBM), San Diego, CA, USA, 18–21 November 2019; pp. 2549–2553. 23. Abdar, M.; Makarenkov, V. CWV-BANN-SVM ensemble learning classifier for an accurate diagnosis of
breast cancer.Measurement2019,146, 557–570. [CrossRef]
24. Alam, K.M.R.; Siddique, N.; Adeli, H. A dynamic ensemble learning algorithm for neural networks. Neural Comput. Appl.2019, 1–16. . [CrossRef]
25. Osman, A.H.; Aljahdali, H.M. An Effective of Ensemble Boosting Learning Method for Breast Cancer Virtual Screening using Neural Network Model.IEEE Access2020,8, 39165–39174.
26. Landwehr, N.; Hall, M.; Frank, E. Logistic model trees. Mach. Learn.2005,59, 161–205. [CrossRef]
27. Sumner, M.; Frank, E.; Hall, M. Speeding up logistic model tree induction. In Proceedings of the European Conference on Principles of Data Mining and Knowledge Discovery, Porto, Portugal, 3–7 October 2005; pp. 675–683.
28. Bottou, L. Large-scale machine learning with stochastic gradient descent. InProceedings of COMPSTAT’2010; Springer: Berlin/Heidelberg, Germany, 2010; pp. 177–186.
29. Pal, S.K.; Mitra, S. Multilayer perceptron, fuzzy sets, and classification. IEEE Trans. Neural Netw.1992, 3, 683–697. [CrossRef] [PubMed]
30. Rokach, L. Decision forest: Twenty years of research. Inf. Fusion2016,27, 111–125. [CrossRef]
31. Daho, M.E.H.; Chikh, M.A. Combining bootstrapping samples, random subspaces and random forests to build classifiers. J. Med. Imaging Health Inform.2015,5, 539–544. [CrossRef]
32. Khedr, A.E.; Idrees, A.M.; El Seddawy, A.I. Enhancing Iterative Dichotomiser 3 algorithm for classification decision tree. Wiley Interdiscip. Rev. Data Min. Knowl. Discov.2016,6, 70–79. [CrossRef]
33. She, J.; Schmidt, M. Linear convergence and support vector identification of sequential minimal optimization. In Proceedings of the 10th NIPS Workshop on Optimization for Machine Learning, Long Beach, CA, USA, 8 December 2017; p. 5.
34. Nazir, S.; Yousaf, M.H.; Velastin, S.A. Inter and intra class correlation analysis (IICCA) for human action recognition in realistic scenarios. In Proceedings of the 8th International Conference on Pattern Recognition Systems (ICPRS), Madrid, Spain, 11–13 July 2017.
35. Ibarra, J.B.; Caya, M.V.C.; Bentir, S.A.P.; Paglinawan, A.C.; Monta, J.J.; Penetrante, F.; Mocon, J.; Turingan, J. Development of the Low Cost Classroom Response System Using Test-Driven Development Approach and Analysis of the Adaptive Capability of Students Using Sequential Minimal Optimization Algorithm. In Proceedings of the 2019 IEEE 6th International Conference on Industrial Engineering and Applications (ICIEA), Tokyo, Japan, 12–15 April 2019; pp. 689–693.
36. Nazir, S.; Yousaf, M.H.; Velastin, S.A. Feature Similarity and Frequency-Based Weighted Visual Words Codebook Learning Scheme for Human Action Recognition. In Proceedings of the Pacific-Rim Symposium on Image and Video Technology, Wuhan, China, 20–27 November 2017; pp. 326–336.
37. Nazir, S.; Yousaf, M.H.; Velastin, S.A. Evaluating a bag-of-visual features approach using spatio-temporal features for action recognition.Comput. Electr. Eng.2018,72, 660–669.
38. Al-Sabbah, S.A.; Mohammad, S.F.; Eanad, M.M. Use of the Naive Bayes Function and the Models of Artificial Neural Networks to Classify Some Cancer Tumors. Indian J. Public Health Res. Dev. 2019,10, 1563–1569. [CrossRef]
39. Delgado, J.; Ishii, N. Memory-based weighted majority prediction. In Proceedings of the SIGIR Workshop Recommender Systems, Berkeley, CA, USA, 19 August 1999.
40. Kang, X.B.; Lin, G.F.; Chen, Y.J.; Zhao, F.; Zhang, E.H.; Jing, C.N. Robust and secure zero-watermarking algorithm for color images based on majority voting pattern and hyper-chaotic encryption. Multimed. Tools Appl.2019,79, 1169–1202. [CrossRef]
41. Du, K.L.; Swamy, M. Combining Multiple Learners: Data Fusion and Ensemble Learning. InNeural Networks and Statistical Learning; Springer: Berlin/Heidelberg, Germany, 2019; pp. 737–767.
42. UCI. Breast Cancer Wisconsin Dataset. Available online:https://archive.ics.uci.edu/ml/datasets/Breast+ Cancer+Wisconsin+(Diagnostic)(accessed on 9 June 2019).
43. Nahato, K.B.; Harichandran, K.N.; Arputharaj, K. Knowledge mining from clinical datasets using rough sets and backpropagation neural network. Comput. Math. Methods Med.2015,2015, 460189. [PubMed]
44. Chen, H.L.; Yang, B.; Liu, J.; Liu, D.Y. A support vector machine classifier with rough set-based feature selection for breast cancer diagnosis.Expert Syst. Appl.2011,38, 9014–9022. [CrossRef]
45. Kumari, M.; Singh, V. Breast Cancer Prediction system. Procedia Comput. Sci.2018,132, 371–376.
46. Dumitru, D. Prediction of recurrent events in breast cancer using the Naive Bayesian classification.Ann. Univ. Craiova-Math. Comput. Sci. Ser.2009,36, 92–96.
47. Liu, L.; Deng, M. An evolutionary artificial neural network approach for breast cancer diagnosis. In Proceedings of the 2010 Third International Conference on Knowledge Discovery and Data Mining, Phuket, Thailand, 9–10 January 2010; pp. 593–596.
48. Shaikh, T.A.; Ali, R. Applying Machine Learning Algorithms for Early Diagnosis and Prediction of Breast Cancer Risk. In Proceedings of the 2nd International Conference on Communication, Computing and Networking, Islamabad, Pakistan, 6–7 March 2019; pp. 589–598.
49. Alickovic, E.; Subasi, A. Normalized Neural Networks for Breast Cancer Classification. In Proceedings of the International Conference on Medical and Biological Engineering, Banja Luka, Bosnia and Herzegovina, 16–18 May 2019; pp. 519–524.
50. Kaushik, D.; Kaur, K. Application of Data Mining for high accuracy prediction of breast tissue biopsy results. In Proceedings of the 2016 Third International Conference on Digital Information Processing, Data Mining, and Wireless Communications (DIPDMWC), New York, NY, USA, 16–19 July 2016; pp. 40–45.
c
2020 by the authors. Licensee MDPI, Basel, Switzerland. This article is an open access article distributed under the terms and conditions of the Creative Commons Attribution (CC BY) license (http://creativecommons.org/licenses/by/4.0/).