Multi Response Optimization of Turning
Parameters using Grey Relational Analysis in the
Taguchi Methodology
Sunil Kumar Bhasker Shrivastav
Department of Mechanical Engineering Department of Mechanical Engineering
YIT YIT
Chandramohan Kumar Suman Anand
Department of Mechanical Engineering Department of Mechanical Engineering
SKIT SKIT
Abstract
Now days, the surface quality in metal machining is most important. There are many machining process such as drilling, shaping, turning, slotting, grinding etc. Among the all machining process, turning is the machining process commonly used in industries to produce cylindrical work pieces. Turning parameters play a crucial role in turning the given work piece to the required shape. In the present work, turning process has been taken up for the surface roughness and material removal rate optimization. An attempt was also made to optimize the turning parameters for minimum surface roughness using Taguchi methodology. Also, grey relation analysis with Taguchi methodology was also used for the optimization of machining parameters for Minimum Surface Roughness During Turning of AISI 8620 Case Hardening Steel Using Grey Relational Analysis Technique for multi response optimization. Keywords: Taguchi Methodology, Orthogonal Array (OA), Grey Relation Analysis, Signal To Noise Ratio
________________________________________________________________________________________________________
I. INTRODUCTION
Turning plays an important role in in machining process or methods. Turning is the removal of metal from the outer diameter of a rotating cylindrical work piece. Turning is used to reduce the diameter of the work piece, usually to a specified dimension, and to produce a smooth finish on the metal. Often the work piece will be turned so that adjacent sections have different diameters. It is the most common process for the production of cylindrical shapes because of its simplicity, rapidity and economy. The purpose of the metal cutting process is not only to shape machine components but also to manufacture them so that they can achieve their functions according to geometric, dimensional and surface considerations. Here, through turning process has been selected for the study to determine the impact of process parameters.
The objectives of the present research are:
1) To investigate the influence of turning parameter such as cutting speed, feed rate and depth of cut on the surface roughness using Taguchi methodology during the turning of AISI 8620 case hardening steel.
2) To optimize turning parameters using grey relational grade for achieving nominal surface roughness.
II. LITERATURE REVIEW
used L9 orthogonal based Taguchi methodology with grey relation grade to optimized turning parameters for multi-response optimization during the turning of SKD 11 on computer numerical control machine. Nine experimental runs based on orthogonal array of Taguchi method were performed. The average surface roughness, maximum value of surface roughness and roundness were selected as quality targets. The results revealed that average surface roughness was most influenced by depth of cut and maximum value of surface roughness and the roundness was influenced by cutting speed. Gaitonde et. al. (2009) investigated the effect of machining parameters during hard turning of AISI D2 cold work tool steel with conventional and wiper ceramic inserts using response surface methodology. The experimentation was carried out with CC650, CC650WG and GC6050WH ceramic inserts. A second order prediction model in terms of machining parameters and tool wear was developed. The investigation was carried out using 2 level full factorial design. The result revealed that minimum surface roughness and tool wear was obtained with CC650WG wiper insert, while the CC650 conventional insert was useful in reducing the specific cutting force. Suresh et. al (2012) used L27 orthogonal array based Taguchi methodology to investigate the effect of cutting speed, feed rate and depth of cut on surface roughness, machining force and tool wear during the turning of AISI 4340 steel. An attempt was also made to optimize the turning parameters for minimum surface roughness, minimum cutting force and minimum tool wear. Selvaraj et. al (2013) employed Taguchi methodology to optimize the turning parameters for minimum surface roughness, minimum cutting force and minimum tool wear during the dry turning of nitrogen alloyed duplex stainless steel. The cutting speed and feed rate were considered as turning parameters. Johnsan et. al. (2014) employed Taguchi methodology for the optimization of cutting parameters and minimal use of cutting fluid during turning of oil hardened non shrinkable steel (OHNS). An attempt was also made to compare result that was obtained with dry turning and conventional wet turning with same machining conditions. The results indicated that the use of minimum cutting fluid increased the cutting performance and produced good surface finish.
III. ANALYSIS METHODOLOGY AND EXPERIMENTATION
This paper presents design of experiments (DOE), Taguchi method, Signal to noise ratio (S/N), orthogonal array (OA), Grey relational method, ANOVA and important terminology followed by optimization.
Design of Experiments
In order to conduct design of experiment, these guidelines can be implemented. – Recognition and statement of the problem.
– Choice of factors and levels. – Selection of the response variable. – Choice of experimental design. – Performing the experiment. – Data analysis.
– Conclusions and recommendations.
Taguchi Methodology
Taguchi adopted an outstanding philosophy for quality control in the manufacturing industries. . The entire of the technology and techniques arise entirely out of these three ideas. These concepts are:
– Quality should be designed into the product and not examined into it.
– Quality is best achieved by minimizing the deviations from the objective. The product or process should be so designed that it is protected to uncontrollable environmental variables.
– The cost of quality should be sedateas a function of deviation from the average and the losses should be sedate system-wide.
Signal to Noise Ratio
The signal to noise ratio is a simultaneous statistic. A simultaneous statistic is able to look at two characteristics of a delivery and roll these characteristics into a single number or figure of merit. The signal to noise ratio combines both the parameters into a single metric. A high value of signal to noise ratio implies that is much higher than the random effects of noise factors. Process operation consistent with higher signal to noise ratio always yields best quality with minimum variation.
Orthogonal Array
Grey Relational Analysis
Grey relational analysis is a method of measuring the degree of approximation between sequences according to the grey relational grade. The theories of grey relational analysis have already attracted the interest of researchers. In the grey relational analysis, the measured values of the experimental results were first normalized in the range between zero and one, which is also called grey relational generation. Next, the grey relational coefficients were calculated from the normalized experimental results to express the relationship between the desired and actual experimental results. Then, the grey relational grades were computed by averaging the grey relational coefficient corresponding to each performance characteristic. The overall equation of the multiple performance characteristics based on the grey relational grade. As a result, optimization of the complicated multiple performance characteristics can be converted into optimization of a single grey relational grade. The optimal level of the process parameters is the level with highest grey relational grade. With the grey relational analysis, the optimal combination of the process parameters can be predicted.
Analysis of Variance (ANOVA)
The main purpose of the analysis of variance (ANOVA) is the application of a statistical method to identify the effect of individual factors. Results from ANOVA can determine very clearly the impact of ach factor on the process results. The taguchi experimental method cannot judge the effect of individual parameters on the entire process; thus, the percentage of contribution using ANOVA is used to compensate for this effect. The total sum of the squared deviations SST is disintegrated into two sources: the sum of the squared deviations due to each process parameter and the sum of the squared error. The percentage contribution by each of the process parameter in the total sum of the squared deviations SST can be used to calculate the importance of the process-parameter change on the performance characteristics.
IV. EXPERIMENTAL SETUP
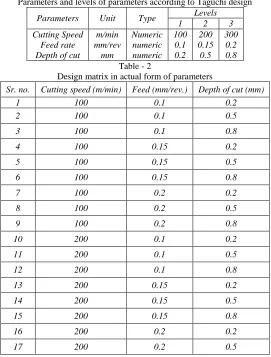
The aim of present research is to investigate the effect of turning parameter on surface roughness. Also, to optimize the machining parameters for the minimum surface roughness using Taguchi methodology and multi response optimization using Taguchi methodology with grey relation analysis, the minimum and maximum values of process parameters is selected according to review of past literature and based on machine specification. The levels of process parameters are decided according to L27 orthogonal array (3 factor 3 level) based Taguchi methodology as shown in table 1.
Table – 1
Parameters and levels of parameters according to Taguchi design
Parameters Unit Type Levels
1 2 3
Cutting Speed Feed rate Depth of cut
m/min mm/rev mm Numeric numeric numeric 100 0.1 0.2 200 0.15 0.5 300 0.2 0.8 Table - 2
Design matrix in actual form of parameters
Sr. no. Cutting speed (m/min) Feed (mm/rev.) Depth of cut (mm)
1 100 0.1 0.2
2 100 0.1 0.5
3 100 0.1 0.8
4 100 0.15 0.2
5 100 0.15 0.5
6 100 0.15 0.8
7 100 0.2 0.2
8 100 0.2 0.5
9 100 0.2 0.8
10 200 0.1 0.2
11 200 0.1 0.5
12 200 0.1 0.8
13 200 0.15 0.2
14 200 0.15 0.5
18 200 0.2 0.8
19 300 0.1 0.2
20 300 0.1 0.5
21 300 0.1 0.8
22 300 0.15 0.2
23 300 0.15 0.5
24 300 0.15 0.8
25 300 0.2 0.2
26 300 0.2 0.5
27 300 0.2 0.8
V. RESULTS AND DISCUSSIONS
A total number of 27 turning experiments according to L27 orthogonal array based Taguchi were performed as per design matrix. These results are further examined in MINITAB for individual analysis of MRR and surface roughness while MS EXCEL 2007software was used to calculate the grey relation grade.
ANOVA for Mean for Surface Roughness
In the present work, the ANOVA test was carried out at significance level of α = 0.05, i.e. for a confidence level of 95%. The first step of ANOVA is to check the assumptions of ANOVA. The analysis of variance (ANOVA) is based on three assumptions. (1) The variables are normally distributed (2) Homogeneity of variance (3) Independence
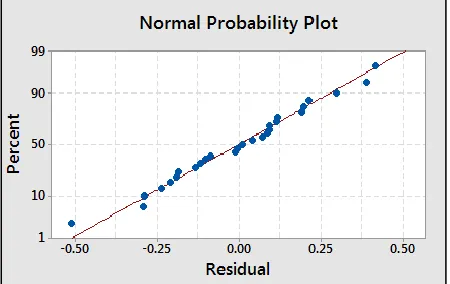
The population normality can be checked with a normal probability plot of residuals. If the distribution of residuals is normal, the plot will resemble a straight line. The normal probability plot of the residuals for surface roughness is shown in figure.4.1. The normal probability plot indicates whether the residuals follow a normal distribution or not, if the residuals follow a normal distribution majority of points will follow a straight line except some moderate scatter even with normal data. The figure displays that the residuals generally fall on a straight line implying that the errors are distributed normally.
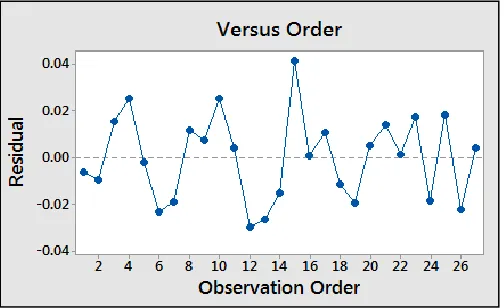
The constant variance assumption can be checked with Residuals versusFits plot. The figure.4.2 represents residuals versus the predicted surface roughness plot. This plot should show a random pattern of residuals on both sides of 0, and should not show any recognizable patterns. A common pattern is that the residuals increase as the fitted values increase. The figure shows that there is no obvious pattern and it shows unusual structure. This implies that there is no reason to suspect any violation of the independence or constant variance assumption.
Fig. 1: Normal probability plot of residuals for surface roughness Fig. 2: Plot of residuals v/s predicted surface roughness
Fig. 3: Plot of residuals v/s order
Minimization of Surface Roughness
The difference between the maximum and the minimum value of the turning parameters for surface roughness values is shown in table 2. The most effective factor affecting performance characteristics is obtained by comparing these values. This comparison gives the level of importance of controllable factors over the minimum surface roughness. The most effective controllable factor corresponds to the maximum of these values. Thus the feed has been found most significant parameter that affects the surface roughness followed by speed and depth of cut.
Table – 2
Response table for surface roughness
Level Cutting speed Feed Depth of cut
1 2.700 1.627 1.814
2 2.076 1.754 2.122
3 1.587 2.981 2.427
Delta (Max.-Min.) 1.113 1.354 0.613
Rank 2 1 3
ANOVA for S/N Ratio for Surface Roughness
The S/N ratio for smaller the better is used for situation where the target value is zero, such as computer response time, automotive emission, corrosion, surface roughness, tool wear, tool vibration etc. The equation for smaller the better ratio is
(𝑆 𝑁⁄ )𝑆𝐵 = - 10 log (𝑀𝑆𝐷𝑆𝐵) = - 10 log [(∑ 𝑦 2)
𝑁
⁄ ] (4.1)
The negative sign is used to ensure that the target value gives the best value for the response variable and therefore robust design. Mean standard deviation is given to display the relationship to the loss function.
In the present work, for surface roughness, the smaller the better S/N ration has been applied to identify the main influencing factor that affects the surface roughness. The ANOVA for S/N ratio for surface roughness has been carried out for a significance level of α = 0.05, i.e. for a confidence level of 95%.
The population normality can be checked with a normal probability plot of residuals. If the distribution of residuals is normal, the plot will resemble a straight line. The normal probability plot of the residuals of S/N ration for surface roughness is shown in figure.4. The figure displays that the residuals generally fall on a straight line implying that the errors are distributed normally. The constant variance assumption can be checked with Residuals versusFits plot. The figure.5 represents residuals versus the predicted S/N ratio of surface roughness plot. The figure shows that there is no obvious pattern and it shows unusual structure. This implies that there is no reason to suspect any violation of the independence or constant variance assumption.
Fig. 4: Normal probability plot of residuals for S/N ratio for surface roughness
Fig. 5: Plot of residuals v/s predicted S/N ratio for surface roughness Fig. 6: Plot of residuals v/s order for S/N ratio of surface roughness
Minimization of Surface Roughness using S/N Ratio
Table 3 presents the difference between the maximum and the minimum value of the turning parameters for S/N ratio for surface roughness values. The most effective factor affecting performance characteristics is obtained by comparing these values. The feed has been found most significant parameter that affects the surface roughness followed by cutting speed and depth of cut. Same results has been obtained as obtained through means for surface roughness
Table 3
Response table for S/N ratio (minimum is best) for surface roughness
Level Cutting speed Feed Depth of cut
1 -8.417 -3.687 -4.294
2 -5.941 -4.385 -5.936
3 -3.099 -9.385 -7.226
Delta (Max.-Min) 5.318 5.698 2.932
Rank 2 1 3
VI. CONCLUSION
The important conclusions drawn from the present work are summarized as follows:
1) From the analysis of ANOVA table for surface roughness, feed has been found most significant parameter that affects the surface roughness followed by cutting speed and depth of cut.
2) From the response table for surface roughness it is clear that minimum surface roughness is achieved at 3rd level of cutting
speed, 1st level of feed and 1st level of depth of cut.
3) From the plot between the surface roughness and turning parameters it is clear that surface roughness decreases with increase in cutting speed, decrease in feed and decrease in depth of cut.
REFERENCES
[1] H.K.Kansal, Sehijpal Singh, Pradeep Kumar: Effect Of Silicon Powder Mixed EDM On Machining Rate Of AISI D2 Die Steel; Journal of manufacturing
[2] Hang –Ming Chow, Biing-Hwa Yan, Fuang-Yuan Huang, Jung-Cherng Hung: Study Of Added Powder In Kerosene For The Micro-Slit Machining Using EDM On Titanium Alloy; Journal of Material Processing Technology 101(1998) 95-103.
[3] Pecas, P. and Henriques, E. (2003). Influence of silicon powder-mixing dielectric on conventional electrical discharge machining. Int. J. Mach. Tools Manuf.,
43, 1465-1471.
[4] Sameh S.Habib: Study Of Parameters In Electrical Discharge Machining Through RSM Approach; Applied mathematical modeling 33(2009) 4397-4407.
[5] Sourabh K. Saha and S.K. Choudhary; “Experimental Investigation And Empirical Modelling Of The Dry Electric Discharge Machining Process”;
International journal of Machine Tools & Manufacture 49 (2009) 297-308.
[6] Syed, K.H. and Palaniyandi,K. (2012). Performance of electrical discharge machining using aluminium powder suspended distilled water, Turkish Journal of
Engineering and Environmental Sciences. 36, 195-207.
[7] Wang, T., Zhe, j., Zhang,Y.Q., Li,Y.L. and Wen, X.R.(2013).Thermal and Fluid Field Simulation of Single Pulse Discharge in Dry EDM .Procedia CIRP. 6,
427–431
[8] Thamizhmanii S, Kamarudin K., Rahim E.A., SaparudinA. and Hassan S. (2007). “Tool wear and surface roughness in turning AISI 8620 using coated ceramic tool”, Proceedings of the World Congress on Engineering, Vol. 2
[9] Thiele Jeffrey D. and Melkote Shreyes N. (1999). “Effect of cutting edge geometry and work piece hardness on surface generation in the finish hard turning
of AISI 52100 steel”, Journal of Materials Processing Technology, Vol.94, pp. 216-226
[10] Tzeng Chorng-jyh, Lin Yu-Hsin, Yang Yung-Kuang and jeng Ming Chang (2008). “Optimization of turning operations with multi performance characteristics
using the taguchi method and grey relational analysis”, Journal of Material Processing Technology, Vol. 209, pp. 2753-2759
[11] Vats, U.K. and Singh, N.K. (2013).Optimization of surface roughness process parameters of Electrical discharge machining of EN-31 by response surface
methodology. International Journal of Engineering Research and Technology, 6(6) (2013), 835-840.
[12] Vishwakarma, M., Parashar, V. and Khare, V.K. (2012). Regression analysis and optimization of material removal rate on electrical discharge machine for
EN-19 alloy steel” International Journal of Scientific and Research Publications, 2(11).
[13] WaikarR.A. and Guo Y.B. (2008). “A comprehensive characterization of 3D surface topography induced by hard turning versus grinding”, Journal on Materials Processing Technology, Vol. 197, pp.189-199
[14] Wociech Zebala, Robert Kowalczyk, Andrzej Matars, "Analysis and optimization of sintered carbides turning with PCD tools", DAAAM International Symposium on Intelligent Manufacturing and Automation, pp. 283 – 290, 2015.
[15] Yin Fengjie, Fatemi Ali and Bonnen john (2010), “Variable amplitude fatigue behavior and life predictions of case hardened steels”, International journal of