REVIEW ARTICLE
OPTIMIZATION OF END MILLING PROCESS PARAMETERS FOR MINIMIZATION OF
SURFACE ROUGHNESS OF AISI P20 STEEL
*Wasim Khan and Niyati Raut
Mechanical Department, Viva institute of technology Virar (E) Mumbai, India
ARTICLE INFO
ABSTRACT
Main purpose of this research to investigate the effect of the main factors of the surface roughness in AISI P20 Steel end milling. The results of the research could be applied in the manufacture of automotive components and mold industries. This study was conducted by using CNC end milling machine with 8 mm diameters fine type carbide tool with twin cutting tip. The controlled factors were the speed, the feed rate and the depth of cut. For this experiment, we used Taguchi design with L16 Orthogonal Array and the result showed that the factors effected of surface roughness was the cutting speed is most influence factors affect the surface roughness. Furthermore, the surface roughness was likely to reduce when speed was 3000rpm and the feed rate was 1000mm/min and Depth of cut 0.8mm The result of the research led to the linear regression equation measurement value which was Ra = 6.760 - 0.946 Cutting speed –0.204 Depth of Cut – 0.368 Feed rate. The equation formula should be used with the speed in the range of 1200 - 3000rpm, rate of feed in the range of 1000 - 2500mm/min and the depth of cut 0.2 - 0.8. The equation was used to confirm the research results, it was found that the mean absolute percentage error (MAPE) of the surface roughness obtained from the predictive value comparing to the value of the experiment was 4.87%, which was less than the specified error and it was acceptable.
Copyright © 2016Wasim Khan and Niyati Raut.This is an open access article distributed under the Creative Commons Attribution License, which permits unrestricted use, distribution, and reproduction in any medium, provided the original work is properly cited.
INTRODUCTION
End milling operations are the most widely used and required machining operations in production industries. Because of its importance in production process it can be used for various milling operations such as face milling, edge milling, metal removing, manufacturing of complex materials and the contours etc. Earlier different types of work is done by researchers according to the literature survey and in this they also includes dynamics of an end milling in which instantaneous dynamic position of the cutter affects metal cutting forces and is directly proportional to the chip thickness which is formed during the operation. Depth of material cut and feed rate varies the chip thickness depending on the input parameters values. Increment in the radial axial depth of material cut leads to increase in metal cutting forces. In the end milling operation we have three input parameters i.e. cutting speed, depth of cut and feed rate and the output parameter is surface roughness. With the parameters such as cutting speed, depth of cut and feed rate we have other parameter which is cutting fluid. Cutting fluid is used to provide heat dissipation to reduce heat arising throughout the process and it is also used to get better surface finish.
*Corresponding author: Wasim Khan
Mechanical Department, Viva institute of technology Virar (E) Mumbai, India.
To optimize the end milling parameters for achieving good surface roughness we used Taguchi method (Dale, 2004). This method comes under the DOE (Design of Experiment), which follows the trial method of repetitive experimentation to get the qualitative estimation of parameters which has to be made. In the present work, the Taguchi’s method, and the grey rational analysis (GRA) have been used to plan the experiments and subsequent analysis of the data collected. Taguchi’s philosophy is founded on the fundamental concepts i.e. Quality should be designed into the product and not inspected into it and it is best achieved by minimizing the deviations from the target (Dale, 2004). Also Taguchi recommends orthogonal array (OA) to get lay out of the experiments. In this study, surface roughness is measured for AISI P20 steel by using L16 OA of Taguchi method. So many experiments were conducted in an end milling process and surface roughness was measured from the surface roughness tester (Douglas Montgomery, 2006).
Literature Review
Harne et al., (January 2015), applied orthogonal array, Signal
to Noise ratio and Analysis of variance to analyze effect of experiments. The input parameters are cutting speed, feed rate and depth of cut selected with output as a surface roughness response. In that mathematical model generated by regression
ISSN: 0976-3376
Asian Journal of Science and Technology Vol.07, Issue, 04, pp.2777-2787, April,2016ASIAN JOURNAL OF
SCIENCE AND TECHNOLOGY
Article History:
Received 13th January, 2015
Received in revised form
08th February, 2016
Accepted 27th March, 2016
Published online 27th April, 2016
Key words:
analysis. The result concluded that, the cutting speed and feed rate has great influences on the surface roughness. Hence feed rate is the dominant factor of the surface roughness and depth of cut has less effects on surface roughness. Hence lower the roughness value leads to higher cutting speed and low feed rate. The optimum parameters observed at optimum level are 3200rpm spindle speed, 250mm/min feed rate and 0.04mm
depth of cut. (Harne et al., 2015), Bala Raju et al., (March,
2015), Applied Taguchi technique for identify optimum surface roughness in CNC end milling process on Aluminum and mild steel material. The setup of end milling parameters done by Taguchi design of experiment and Signal to Noise ratio, Analysis of variance(ANOVA) are employed to find optimum level of different parameters of end milling process. The end milling input process parameters are cutting speed, Feed rate and depth of cut selected with output surface roughness as response. The result shows Taguchi parameters design successfully verified the optimum cutting parameters of Aluminum as 1400rpm of spindle speed, 50mm/min of feed rate and 0.75mm of depth of cut gives Ra= 0.29 microns of surface finish And for Mild steel the optimum levels of process parameters are 1400rpm of spindle speed, 50mm/min of feed rate and 0.75 mm depth of cut gives Ra= 1.19 microns of surface finish in Vertical CNC milling machine (Bala Raju
et al., 2015). Nimase et al., (June 2015),Used Taguchi design
of experiment and L8 orthogonal array method for optimizing the cutting parameters Signal to Noise ratio and analysis of variance used to obtain influencing parameters to the surface roughness. The input parameters are spindle speed, feed rate and depth of cut and surface roughness as output response are selected. Result concluded that from Signal to Noise ratio graph, the optimal setting of machining parameters for low surface roughness achieved at 2500rpm of spindle speed, 240mm/min of feed rate and 2.0mm depth of cut.
It is observed that the feed rate has more affected on the surface roughness about 46.36%, secondly was spindle speed of about 34.78% and depth of cut has less affected to the
surface roughness (Nimase, 2015). Amal et al., (August 2015),
Used Taguchi method for analyzing the effect of surface roughness with L9 orthogonal array. And they had selected four input factors like speed of cut, depth of cut and feed rate and three levels .For analysis they had used MINITAB software. After all the experiment and analysis it was found that feed rate is the most influencing parameter to surface roughness and cutting force followed by other parameters. The
smaller nose radius produces less cutting forces. (Amal et al.,
2015), Abhishek kumbhar et al., (September 2015), Used
Taguchi design for design an experiment based on L9 orthogonal array. The input process parameters for CNC milling machine are selected as cutting speed, feed rate and depth of cut with three levels of each machining parameters, grey relational analysis used for multi objective relation between machining parameters and milling process. Result concluded based on grey relational analysis are level 2 of 75m/min of cutting speed, level 1 0.15mm/revolution of feed rate and level 3 0.5mm of depth of cut. It increased 23.86% of Material removal rate and reduced 24.86% of surface roughness, the observed most influencing factor was feed rate and spindle speed on the surface roughness. (Abhishek
kumbhar et al., 2015), Lande et al., (December 2015) , The
experiment concluded on Aluminum 6351 on CNC end milling machine with input process parameters are selected as
spindle speed, feed rate, diameter of tool and DOC. The output parameters as surface roughness and Material Removal Rate. The result concluded by MINITAB 17 software to find the most optimal process parameter level and for multi objective optimization gray analysis used to give the values of optimum parameters. The gray relational analysis method successfully applied which gave, The optimal levels for combined objective function and significant parameters levels as order, Feed rate >
spindle speed > DOC > tool diameter. (Lande et al., 2015),
Pankaj Chandna et al., (2015), optimizes cutting parameters
like rate of feed , cutting speed and depth of cut by using Taguchi approach .The experiment have been performed as per the combination of levels of different process parameters suggested by the L9 orthogonal array .After the experiment it was found that at the particular experiment the values of signal to noise ratios is less and that is final surface roughness because in the case of cutting parameters always we have consider smaller is better hence it is clarify that from that particular experiment the effect of depth cut is more significant to increase the surface finish comparing to the other
factor like cutting sped and feed rate. (Pankaj Chandna et al.,
2015), Abhishek Dubey et al., (April 2014), The author stated
that "The Grey & Taguchi method is used to predict parameter design study of end milling operation with input variables spindle speed, depth of cut, feed rate & pressurized coolant jet & output as surface roughness. Result concluded from Grey relational analysis. The order of importance factors to minimize surface roughness are feed rate, depth of cut, spindle speed then pressurized coolant but spindle feed is the most influences factor among four factor predicted by ANOVA
approach. (Abhishek Dubey et al., 2014), Ramanujam et
al.,(April 2014),Perform the Multi Response optimization
using ANOVA and Desirability function analysis of ICONEL alloy with L9 orthogonal array of Taguchi methodology applied with input factors as cutting speed, feed rate, and depth of cut analyzed for surface roughness and material removed rate. Experimental result concluded that the optimal factor lies in 75m/min cutting speed, 0.06mm/tooth feed rate and 0.4 mm depth of cut with 64.8% increment in MMR.
The most optimal significant machining parameter is cutting speed followed by feed rate. The effects are 56.88% and
34.64% respectively. (Ramanujam et al., 2014), Ramesh et al.,
(April 2014), Conducted the experiment using response surface methodology face centered composite design using design expert version 7 software. The input process parameters are spindle speed, feed rate and depth of cut selected for vertical milling machine using 6mm diameter carbide end mill cutter with the output responses as surface roughness and material removal rate. Result concluded that a spindle speed increases the surface roughness increases and material removal rate increases as the feed rate increases. The low surface roughness achieved at medium speed, lower feed rate and medium depth of cut. The feed rate is most influencing factor concluded for surface roughness followed by speed. The optimal parameter levels in conventional milling machines are 4416rpm of speed, 0.49mm/revolution of feed and 2mm of depth of cut from 0.7950 microns surface roughness is achieved and lower material removal rate leads to higher
surface finish. (Ramesh et al., 2014), Ravikumar Patel et al.,
spindle speed, feed rate, and depth of cut. Mathematical model developed for milling process by surface roughness. The feed rate followed by spindle speed and lastly depends on depth of cut and result concluded that 92% accurate by using Taguchi Artificial Neural Network method for surface roughness.
(Ravikumar Patel, 2014), Rajesh Kumar et al., (December
2014), the modelling and optimization of end milling parameters on aluminum 6061 alloy using grey relation analysis based Taguchi design investigated that cutting parameters that are coolant , spindle speed , feed rate , depth of cut as input parameters. L18 orthogonal array and analysis of variance used. from conclusion of result stated that the optimum condition for high surface finish parameters are at spindle speed 765 rpm feed rate 50m/min and 0.8mm depth of cut obtained.
It was found that the feed rate is most influence parameters for
surface finish. (Rajesh Kumar et al., 2014), Pang et al.,(2014),
stated that An orthogonal array of the Taguchi method used to analyze the effect of most suitable combination of milling parameters on the surface roughness and cutting force which provides the most lowest surface roughness with lowest cutting force and that controlling parameters are depth of cut , spindle speed, and feed rate from by Taguchi and data generated by experiment were Taguchi d=0.6mm S= 1000rpm, f=40mm this proved that the Taguchi parameters design is an efficient way to determine od optimum combination of cutting
parameters which reduces the surface roughness. Shirsat et al.,
(2014), stated that, the Taguchi method is applied to improve surface roughness the input variables are feed rate, cutting speed, & depth of cut. The relation concluded to predict the surface roughness in milling process by parameters of aluminium material.
The experiment was done by non-conventional process approach. The result concluded the most optimum cutting parameters depth of cut 0.02mm cutting speed 1500 rpm & feed rate 300mm/min at 95% confidence level. The average values of surface roughness and Signal to Noise ratio achieved are 1.53 microns and -5.04 respectively. It was found that after all the experiment and analysis the parameters depth of cut shows most significant factor affecting surface roughness.
Krishnaraj et al., (2014), perform experiment on high speed
end milling of titanium alloy using Taguchi method investigates effects of cutting forces during process. The input variables selected cutting speed, depth of cut, Feed rate. Result concluded that (1) cutting forces depends upon angle of contact of tool with work piece (2) Higher depth of cuts, cutting forces stabilizes because stable cutting has more influences on cutting forces. (3) Optimum parameters are cutting speed 150mm/min depth of cut 0.75mm & feed rate 0.075 mm/rev is suitable for high speed end milling machining with 0.27 to 0.45 um surface finish obtained .From this study it was found that depth of cut and rate of feed have higher effect on cutting forces when compared to cutting speed whereas the effect of cutting speed has higher effect on temperature.
Thakur Premji et al., (2014),Preformed Optimal selection of
process parameters in CNC end milling of AL 7075-T6 Aluminum alloy using Taguchi -Fizzy approach for minimizing the surface roughness and maximizing the material removal rate simultaneously. The L27 orthogonal array with four factors and three levels are chosen in Taguchi design. The Signal to Noise ratio of surface roughness and material
removal rate as output parameters to Fizzy logic system and output received in multi response performance index. The optimum level of factor are identified by Analysis of variance method. The input process parameters selected as spindle speed, feed rate, depth of cut and nose radius. The result concluded that, the best combination of parameters observed spindle speed as 6000rpm, feed rate as 0.02mm/tooth, depth of cut as 0.6mm and nose radius as 0.4mm. The most influencing parameter identified is nose radius and depth of cut. Julia
Haricova et al., (2014), Used Analysis of variance to identify
the most significant factor in CNC milling process.
The input factors considered as helix angle, cutting velocity, and feed rate. The material used was Al, Mg, and Si. The result conclude that helix angle, is the most influencing parameter to surface roughness decreased with increase of cutting speed. The use of any coolant does not affects the surface roughness. The high speed is recommended for this
uncoated carbide end cutter tool and work piece. Ashok Raj et
al., (January 2013), Perform optimization milling parameters
of EN8 using Taguchi design of experiment and analysis of variance (ANOVA).The input parameters taken as cutting speed, Feed rate and depth of cut using side and face milling cutters. The significant machining parameters are identified by Signal to Noise ratio. The result concluded that, the cutting speed is statistically most influencing factor affects in surface roughness in milling process. The low surface roughness
achievedwith285mm/min of cutting speed, 0.27mm/revolution
of feed rate and 0.4mm of depth of cut observed. Side milling and face milling cutter is suitable for machining of EN8 steel which results into good surface finish with required accuracy.
AvinasThakre et al., (June 2013), stated that in the experiment
the four input parameters spindle speed , feed rate , depth of cut and coolant flow are considered by taguchi L9 orthogonal array technique with three levels for each factor. The experiment conducted on the 1040MS material on CNC vertical milling machine using carbide tool, The analysis of mean and variance is used to study of each machining parameters and result concluded by mean and variance technique, the most significant factor comes up is coolant flow to the surface roughness.
The coolant flow contributes 60% with optimal coolant flow rate and second most important factor was spindle speed that about 20% to surface finish. The optimal parameters range concluded that are 2500rpm of spindle speed, 800mm/min of feed rate, 0.8mm of depth of cut with 30liter/min of coolant flow for this combination of parameters, the surface roughness
achieved of 0.357 microns. Madhvan Reddy et al., (August
2013), Performed Optimization of surface roughness in high speed end milling operation using taguchi method. The input parameters are cutting speed, Feed rate and depth of cut selected for end milling process with three levels of each factors. An L9 orthogonal array and analysis of variance method used to identify the most influencing parameter factor in end milling process. The AL-Si- Mg-Fc alloy used for milling process. The result concluded that surface roughness decreases with increases with increase in cutting speed and increase with increase in feed rate and depth of cut. The rigidity of cutting and machine is largely depends upon the
depth of cut factor. Jaknarinchatthong et al., (November
spindle speed, feed rate and depth of cut selected. Preliminary experiments showed depth of cut does not affect the surface roughness hence it is fixed to 2mm. The result concluded that cutting speed significantly affect the surface roughness of nodular cast iron FCD 400 followed by feed rate. It also indicated that as higher value of spindle speed and lower the feed rate causes to reduce the surface roughness. The linear equation in research developed that Ra = 1.07-0.0006565 speed+0.000562 feed rat at the 500-1000rpm of speed and the 160-315mm/min of feed rate. The mean absolute error was found was 3.50% which is lesser than the predicted 5% percentage of error, hence the error result accepted in
experiment. Subramanian et al., (2013), stated that The
optimization of cutting parameters for cutting force in milling is done by Response Surface Methodology and Genetic Algorithm for guiding to minimum cutting force is estimated through second order mathematical equation and a comparison made and provided result and experimental result were found the deviation within 95% confidence level and concluded that cutting speed was the dominant factor in second order model followed by cutting feed rate and axial depth of cut and also concluded that high cutting speed and low cutting feed and axial depth of cut leads to the better surface finish. Sayeed
Ahmed et al., (2013), Used Regression analysis for validation
of result. The mathematical model developed by using RSM.
The cutting parameters consider here that is cutting speed, depth of cut and feed rate. For reducing vibration during machining process magneto rheological damping used that is improving the surface finishing, by this approach researcher analysed, reduction in cutting forces and result values of cutting coefficient from experiment notified that are very close to the predicted value hence this approach is acceptable.
Mohamad Syahmi Shahrom et al., (2013), the author
determined the effect of lubrication condition in surface finishing process and three other factors cutting speed, feed rate, depth of cut influencing the surface roughness value the experiment conducted by using Taguchi design approach from analyzed result value predicted that by minimum quantity of lubrication produces the better surface finish comparing to the full lubrication process and result shows significantly reduced
cost and environmental pollution also. Surasit Rawangwonget
al., (2013), used the factorial design for selection of
orthogonal array method approach and ANOVA method used for analysing of variables. The major factor considered as cutting speed, feed rate and depth of cut, by used of regression analysis, the predicted value of absolute percentage error for surface roughness comes greater than the performed experiment value, hence it’s found that, the approach of regression analysis in surface roughness process very important, result from regression analysis experiment directly improved and increases the surface finish. Lohithaksha Maiyar
et al., (2013), Optimize the cutting parameter of end milling
process for Inconel 718 super alloy in this case Taguchi orthogonal array with grey relational analysis tool used for experimental purpose. In the gray relational analysis they had selected material removal rate and surface finish for normalized value. Basically the largest normalized valve better the performance and after words it was compare with analysis of variance .After comparison it was found that Cutting speed most influence and significant factor for increasing surface finish.
Experimental Design
L16 Orthogonal Array method is the most effective method to study the result obtained from Design of experiments. A scientific approach to plan the experiments is a necessary approach for efficient conduct of experiments. By the statistical design of experiments the process planning of the experiment is carried out, so that exact data will be collected and analyzed by statistical methods resulting in the proper and objective conclusions. The advantages of design of experiments are nothing but the number of trial is reduced, Optimal setting of the parameters can be found out, Qualitative estimation of parameters can be made and Experimental error can be estimated. We have discussed Taguchi’s philosophy in which Taguchi’s inclusive system of quality engineering is one
of the greatest engineering achievements of the 20th century.
His methods attracts on the effective application of engineering strategies rather than advanced statistical techniques. It includes both upstream and also shop-floor quality engineering. Directed upstream methods efficiently use limited experiments to minimize variability and remain cost-effective, and robust designs for large-scale production and market place. Shop-floor techniques or methods fully provide cost-based, real time methods for monitoring and maintaining quality in production process. The farther upstream a quality method is used to bring into action, the greater leverages it produces on the betterment, and the more it minimizes the cost and time. He also proposes an “off-line” strategy for quality improvement as an alternative to a trial to inspect quality into a product on the production line. He finds that poor quality cannot be improved by the process of observation &inspection, screening and salvaging. No amount of inspection can used to put quality back into the product. Taguchi counsels a three-stage process: system design, parameter design and tolerance design. In the present task Taguchi’s parameter design approach is used to study the effect of process parameters on the various responses of the end milling process.
The heart of Taguchi method is his definition of the nebulous and tricky or illusory term quality. As the characteristic that avoids loss to the society from the time the product is shipped. To estimate relative amount of loss in terms of monetary units and is related to quantifiable product characteristic. Taguchi defines quality loss through his loss function. He unites the financial loss with the functional specification through a quadratic relationship that arises from a Taylor series expansion. The quadratic function takes the form of a parabola. So Taguchi defines the loss function as a quantity proportional to the deviation from the formal quality characteristic. He has found the following quadratic form to be a useful workable function:
L(y) = k (y-m)2
Where,
L = Loss in monetary units
k = constant which is depending on the magnitude of the characteristic and the monetary unit involved
y = actual value of the characteristic
The loss-function given above is an effective figure of merit for making engineering design decisions. Recognizing the dilemma, Taguchi created a transform function for the loss-function which is called as signal - to - noise (S/N) ratio. So the S/N ratio is the concurrent statistic and It is able to look at two characteristics of a distribution and also it is used to roll these characteristics into a single number or figure of merit. The S/N ratio consolidates several repetitions (minimum two data points are required) into one value. The equation for calculating S/N ratios for “smaller is better” (LB), “nominal is best” (NB) and“larger is better” (HB) types of characteristics. Here we use smaller is better because we have to minimize the surface roughness so as small as the value the surface roughness becomes that much smoother.
Smaller the Better:
(S/N)LB=-10log(MSD)LB ………(1)
Where,
MSDLB = 1/R ∑ ( )
The mean standard deviation (MSD) is a statistical quantity that reflects the deviation from the target value. The expressions for mean standard deviation (MSD) are different for different quality characteristics. For the “nominal is best” characteristic, the standard definition of mean standard deviation is used. For the other two characteristics the definition is slightly modified. For “smaller is better”, the unstated target value is supposed to be zero. For the steps in Design analysis and experimentation we have various steps such as selection of orthogonal array, assignment of parameters and interaction to the OA, selection of outer array, experimentation and data collection, data analysis and parameters design strategy. The significance of difference between the means of two samples can be judged by performing certain test either Z- test or t- test; but difficulty arises when we used to examine the significance of the difference amongst more than two sample means at same time. The ANOVA method or technique enables us to perform this simultaneous test and it is considered to be an important of analysis. ANOVA is essential procedure for testing the difference between different groups of data for homogeneity. In ANOVA analysis technique various steps are i.e. Take the mean of each sample, Sum of squares (SS) for variance in between the samples and Variance or Mean square (MS) between the samples.
Experimental Details
The objective was to obtain better surface roughness of the end milling process parameters for end milling machining process. The experiment were done conducted with AISI P20 steel and Carbide tool. The end milling process parameters were given different values and then optimized for minimum and better surface roughness on the P20 steel. P20 steel is high carbon steel which is widely used in dies. P20 steel is normally pre-hardened up to the 29 to 39HRC. It has good polishability and good texture ability use to make finishing easier. It distributes uniform hardness level across the larger surface areas of block. Nitriding properties of P20 steel makes it primary choice for plastic mold dies in plastic making. All experiments were
carried out on CNC vertical milling machine in workshop, Goregaon, Mumbai. The workpiece material used for the purpose was P20 steel as described above the dimension of the workpiece were 210mm x 80mm x 24mm. The chemical composition of P20 steel was found to be as shown in Table 1. The cutter used was an end milling cutter of diameter 8mm. In
Taguchi design, the number of experimental runs
exponentially increases with the increase in the number of factors as well as their levels. This results in large amount of experimentation cost and considerable time period. So, in order to compromise these two adverse factors and searching for the optimal process condition through a limited number of experiments Taguchi L16 orthogonal array consisting of 16 sets of data was selected to optimize the performance characteristics of the end milling process. Experiments were conducted with the process parameters as given in Table2. Selected established matrix shown in Table 3 based on the Taguchi L16 orthogonal array consisting of 16 sets of coded conditions and the experimental results for the responses of surface roughness (Ra).
Table 1. Chemical compositions of AISI P20 Steel
C Si Mn S Cr Mo Ni
0.35 0.45 0.85 0.35 0.035 1 0.8
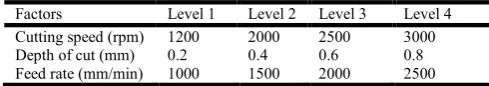
Table 2. Experiment Factor and Their Levels
Factors Level 1 Level 2 Level 3 Level 4
Cutting speed (rpm) 1200 2000 2500 3000
Depth of cut (mm) 0.2 0.4 0.6 0.8
Feed rate (mm/min) 1000 1500 2000 2500
Experimental Result
The Taguchi design experiments were conducted to study the effect of process parameters over the output response characteristics with the process parameters and interactions assigned to columns as given in Table and 16 experiments
were conducted using Taguchi experimental design
methodology and each experiment was simply repeated three times for obtaining S/N values. In the present study all the designs, plots and analysis have been carried out using Minitab statistical software.
Analysis and Discussion of Results
The most favourable values which are optimal settings of process variables in terms of mean response characteristics are established by examining and then analysing the response curves and the ANOVA tables.
Effect of Process Parameters on Surface roughness
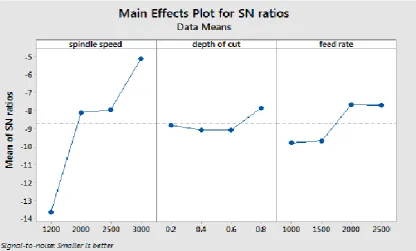
In order to get the effect of process parameters on the surface roughness, experiments were conducted using L16 OA. The experimental data is given in Tables 3. The average values of surface roughness (Ra) for each parameter at levels 1, 2, 3 and 4 for raw data and S/N data are plotted in Figures (a) and (b) respectively.
Effects of spindle speed on surface roughness
From the figure (a) it shows that, the input parameter as spindle speed on P20 steel with carbide tool for output response as a surface roughness which is mainly affected by speed. As from the figure (a) shows that, as the spindle speed increases from 1200rpm to 3000rpm the mean surface roughness value continuously decreases its value from 4.9µm to 1.795µm respectively.
It same happened in S/N ratio graph figure 6.2 for smaller is better, As speed increases continuously from 1200 to 3000rpm the S/N ratio value goes -13.6608 to -5.0829 respectively
Effects of Depth of cut on surface roughness
From the figure (a) graph of means it shows that as depth of cut increase from 0.2 to 0.8mm it provides reduction in surface roughness value from 3.179 µm to 2.55 µm respectively. In figure 6.2 graph of S/N ratio is also conclude that as depth of cut increases its value from 0.2mm to 0.8mm it first decreases the value of S/N ratio from -8.8154 to -9.070 at the range 0.2 to 0.6mm, than after it provides the increment in the S/N ratio value up to -7.8454 at 0.8mm depth of cut.
Effects of Feed rate on surface roughness
As shown in figure (a), as feed rate value increases from 1000 to 2500mm/min. it provides the mean surface roughness value in decreasing order from 3.47µm to 2.498µm respectively. From figure (b). As feed rate increases from 1000mm/min to 2500mm/min it continuously increases the value of S/N ratio from -9.79 to -7.6871respectively.
Selection of optimal levels
In order to study the significance of the process variables towards surface roughness, analysis of variance (ANOVA) was performed. It was found that feed rate and depth of cut are non-significant process parameters for surface roughness from Tables 4 and 5 respectively. From these tables, it is clear that spindle speed significantly affects the mean surface roughness values.
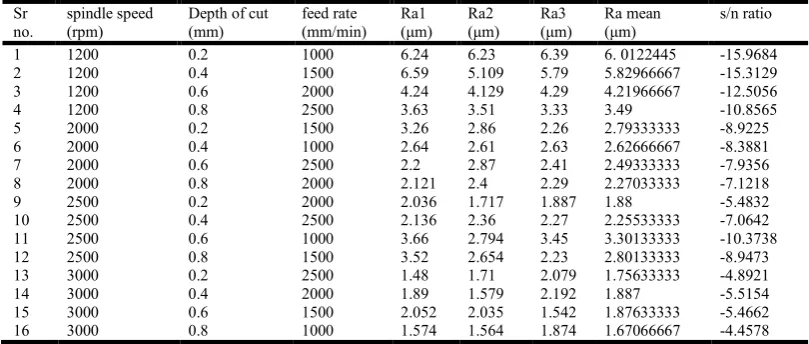
Table 3. Experimental Results of Cutting Rate, depth of cut and feed rate, with output response Surface Roughness
Sr no.
spindle speed (rpm)
Depth of cut (mm)
feed rate (mm/min)
Ra1 (μm)
Ra2 (μm)
Ra3 (μm)
Ra mean (μm)
s/n ratio
1 1200 0.2 1000 6.24 6.23 6.39 6. 0122445 -15.9684
2 1200 0.4 1500 6.59 5.109 5.79 5.82966667 -15.3129
3 1200 0.6 2000 4.24 4.129 4.29 4.21966667 -12.5056
4 1200 0.8 2500 3.63 3.51 3.33 3.49 -10.8565
5 2000 0.2 1500 3.26 2.86 2.26 2.79333333 -8.9225
6 2000 0.4 1000 2.64 2.61 2.63 2.62666667 -8.3881
7 2000 0.6 2500 2.2 2.87 2.41 2.49333333 -7.9356
8 2000 0.8 2000 2.121 2.4 2.29 2.27033333 -7.1218
9 2500 0.2 2000 2.036 1.717 1.887 1.88 -5.4832
10 2500 0.4 2500 2.136 2.36 2.27 2.25533333 -7.0642
11 2500 0.6 1000 3.66 2.794 3.45 3.30133333 -10.3738
12 2500 0.8 1500 3.52 2.654 2.23 2.80133333 -8.9473
13 3000 0.2 2500 1.48 1.71 2.079 1.75633333 -4.8921
14 3000 0.4 2000 1.89 1.579 2.192 1.887 -5.5154
15 3000 0.6 1500 2.052 2.035 1.542 1.87633333 -5.4662
16 3000 0.8 1000 1.574 1.564 1.874 1.67066667 -4.4578
Table 4. Analysis of Variance for SN ratios
Source DF Seq SS Adj SS Adj MS F P
Spindle speed 3 154.401 154.401 51.467 24.80 0.001
Depth of cut 3 4.069 4.069 1.356 0.65 0.609
Feed rate 3 16.977 16.977 5.659 2.73 0.137
Residual Error 6 12.450 12.450 2.075
Total 15 187.896
Table 5. Analysis of Variance for Means
Source DF Seq SS Adj SS Adj MS F P
Spindle speed 3 22.6760 22.6760 7.5587 17.94 0.002
Depth of cut 3 0.9823 0.9823 0.3274 0.78 0.548
Feed rate 3 3.0563 3.0563 1.0188 2.42 0.165
Residual Error 6 2.5282 2.5282 0.4214
Figure a. Effects of Process Parameters on Surface roughness
Figure b. Effects of Process Parameters on Surface Roughness (S/N Data)
Table 6. Response Table for Signal to Noise Ratios: Smaller is better
Level Spindle speed Depth of cut Feed rate
1 -13.661 -8.817 -9.797
2 -8.092 -9.070 -9.662
3 -7.967 -9.070 -7.656
4 -5.083 -7.846 -7.68
Delta 8.578 1.224 2.141
Rank 1 3 2
Table 7. Response Table for Means
Level Spindle speed Depth of cut Feed rate
1 4.956 3.179 3.471
2 2.546 3.150 3.325
3 2.560 2.973 2.564
4 1.798 2.558 2.499
Delta 3.159 0.621 0.973
Table 8. Data-Pre Processing Result
Experiment No. Normalized S/N Ratio
1. 1
2. 0.94
3. 0.699
4. 0.5558
5. 0.3878
6. 0.3414
7. 0.3021
8. 0.2314
9. 0.0890
10. 0.2264
11. 0.5139
12. 0.3900
13. 0.0377
14. 0.0918
15. 0.0876
16. 0
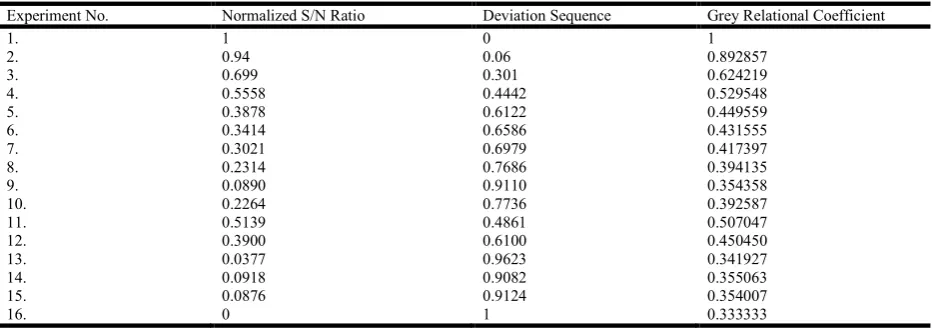
Table 9. Grey Relational Coefficient and the Grey Relational Grade
Experiment No. Normalized S/N Ratio Deviation Sequence Grey Relational Coefficient
1. 1 0 1
2. 0.94 0.06 0.892857
3. 0.699 0.301 0.624219
4. 0.5558 0.4442 0.529548
5. 0.3878 0.6122 0.449559
6. 0.3414 0.6586 0.431555
7. 0.3021 0.6979 0.417397
8. 0.2314 0.7686 0.394135
9. 0.0890 0.9110 0.354358
10. 0.2264 0.7736 0.392587
11. 0.5139 0.4861 0.507047
12. 0.3900 0.6100 0.450450
13. 0.0377 0.9623 0.341927
14. 0.0918 0.9082 0.355063
15. 0.0876 0.9124 0.354007
16. 0 1 0.333333
Table 10. Calculated Grey Relational
Experiment No. Cutting speed (rpm) Depth of cut (mm) Feed Rate (mm/min) Ra (μm) Grade
1. 1 1 1 1 1
2. 1 2 2 0.892857 0.892857
3. 1 3 3 0.624219 0.624219
4. 1 4 4 0.529548 0.529548
5. 2 1 2 0.449559 0.449559
6. 2 2 1 0.431555 0.431555
7. 2 3 4 0.417397 0.417397
8. 2 4 3 0.394135 0.394135
9. 3 1 3 0.354358 0.354358
10. 3 2 4 0.392587 0.392587
11. 3 3 1 0.507047 0.507047
12. 3 4 2 0.450450 0.450450
13. 4 1 4 0.341927 0.341927
14. 4 2 3 0.355063 0.355063
15. 4 3 2 0.354007 0.354007
16. 4 4 1 0.333333 0.333333
Table 11. Response table for the grey relational grade
Symbol Machining parameters Grey relational grade Main effect (max-min) Rank
Level 1 Level 2 Level 3 Level 4
A Cutting speed 0.7616* 0.4231 0.4260 0.3461 0.4155 3
B Depth of cut 0.5364* 0.5179 0.4757 0.4268 0.4268 2
C Feed Rate 0.5724* 0.5367 0.4319 0.4203 0.5724 1
Table 12. Confirmation results
Unit Predicted Experimental Error
The response tables show the average of each response characteristic (S/N data and means) for each level of each factor. The tables include ranks based on delta statistics, which compare the relative value of effects. The delta statistic is the highest minus the lowest average for each factor. Minitab 17 software assigns ranks based on delta values; rank 1 to the highest delta value, rank 2 to the second highest, and so on. The ranks is used to indicate the relative importance of each factor to the response. The ranks and the delta values show that spindle or cutting speed has the greatest or maximum effect on surface roughness and is followed by feed rate and depth of cut in that order. As quality characteristic of surface roughness is the “smaller the better” type, it can be seen from Figure (a) that the fourth level of spindle speed, fourth level of depth of cut and first level of feed rate provide minimum value of surface roughness.
Effect of process parameters on surface roughness
In order to see the effect of process parameters on the surface roughness, experiments were conducted using L16 OA. The experimental data are given in Table 4. The average values of the surface roughness for each parameter at levels 1, 2, 3 and 4 for surface mean of means and S/N data are plotted in Figures (a) and (b). DF - degrees of freedom, SS - sum of squares, MS - mean squares (Variance), F-ratio of variance of a source to variance of error, P < 0.05 - determines significance of a factor at 95% confidence level. It is seen from the response Tables 4 and 5 that the spindle speed effects more on the surface roughness followed by feed rate and depth of cut. The delta
ranks also shows that 1st rank to the spindle speed, 2nd rank to
the feed rate and the 3rd rank to depth of cut as in both table of
S/N ratio and means. All these data are used for the analysis and evaluation of the optimal parameters combination. The response variables measured were surface roughness, surface roughness tester Mitutoyo S- 210 is used to measure the surface roughness for end milling operation
GRA (Grey Relational Analysis)
The experimental result come out for surface roughness (Ra) are given in the Table 8, Values of Ra are desirable. Thus the data sequences have the smaller-the-better characteristics, the “smaller-the-better” (which means that if the required value is small then it is good response) methodology, i.e. equation (1), was used for date pre-processing. The values of the surface
roughness (Ra) are set to be the reference sequence X0(0) (k)
the results of sixteen experiments were the comparability
sequences Xi(0) (k), ki= 1,2,….16, k= 1-16 Table 9 given all of
the sequences after fulfilling the data pre-processing by getting the normalized value using equation (1). The reference sequence and the comparability sequences were calculate as
X0*(k) and X1* (k), respectively.
xi
*
(ki)=
( ) ( )
( ) ( ) ………(1)
Also, the deviation sequence oi, maximum deviation oi max (k) and minimum deviation oi min (k) can be calculated. The
deviation sequences oi (1) using equation for deviation
sequence can be calculated as follows:
o1(1) =│xo
*
(1) – x1
*
(1) │= │1.0000-1.0000│ = 0
The distinguishing coefficient can be substituted for the Grey relational coefficient. All the process parameters have been listed in Table 9. The Grey relational coefficients and the grade for all sixteen comparability sequences are as follows.
Computing the Grey Relational Coefficient and the Grey Relational Grade
After data pre-processing is carried out, a grey relational coefficient can be calculated with the pre-processed sequence. It expresses the relationship between the ideal and actual normalized experimental results. The grey relational coefficient is defined as follows:
( ) =
( ) ………(2)
If all the parameters are given equal preference, is taken as 0.5. The grey relational coefficient for each experiment of the L16 OA can be calculated using Equation 6.4 and the same is presented in Table 11.
By taking Reference value is 1.
After obtaining the grey relational coefficient, the grey relational grade is computed by averaging the grey relational coefficient corresponding to each performance characteristic. The overall evaluation of the performance characteristics is based on the grey relational grade that is where the grey
relational grade for the ith experiment and n is the number of
performance characteristics. Table 12 shows the grey
relational grade for each experiment using L16 OA. The higher
grey relational grade represents that the corresponding experimental result is closer to the ideally normalized value. Experiment has the best performance characteristics among sixteen experiments because it has the highest grey relational grade. It can be seen that in the present study, the optimization of the complicated performance characteristics of End milling of P20 steel has been converted into optimization of a grey relational grade. Since the experimental design is orthogonal, it is then possible to separate out the effect of each machining parameter on the grey relational grade at different levels. For example, the mean of the grey relational grade for the spindle speed at levels 1, 2, 3, and 4 can be calculated by averaging the grey relational grade for the experiments 1 to 4, 5 to 8, 9 to 12, and 13 to 16 respectively as shown in Table 13. The mean of the grey relational grade for each level of the other machining parameters, namely, feed rate and depth of cut can be computed in the same manner. The mean of the grey relational grade for each level of the machining parameters is summarized and shown in Table 13. In addition, the total mean of the grey relational grade for the sixteen experiments is also calculated and presented in Table 13. The larger the grey relational grade, the better is the performance characteristics. However, the relative importance among the machining parameters for the performance characteristics still needs to be known, so that the optimal combinations of the machining parameter levels can be determine more accurately. Table 13. the optimal parameter combination was determined as A1 (Cutting speed) - B1 (Depth of cut) - C1 (Feed rate).
Confirmation Test
determining the optimum level of process parameters, a new experiment is designed and conducted with optimum levels of CNC End milling parameters obtained. By use of regression equation we have predicted the optimum surface roughness value. The regression equation obtained from Minitab given as follows:
Ra (predicted) = 6.760 - 0.946 A1 - 0.204 B1 - 0.368 C1 = 6.760 - 0.946x0.7616 - 0.204x0.5364 - 0.368x0.5724 = 5.7194µm
Confirmatory experiments were performed using the optimum values and it was found that experimental response values were close enough to predicted values. These values and percentage error between actual and predicted values of the responses are given in table XIV. The percentage error between the actual and predicted values of the responses falls below 5% which is 4.87%, which shows that the optimized value of CNC End milling process parameters obtained is good enough for achieving the target set during the experiment. The comparison again shows the good agreement between the predicted and the experimental values.
Conclusion
The optimal sets of process parameters were obtained for performance measures using Taguchi design of experiment methodology. From the analysis of variances, the most significant factor was concluded spindle speed and also from main effects plot of process parameters to the output response factor as a surface roughness. The spindle speed also shows the minimum values of S/N ratio -13.6608 in S/N ratio graph regarding to process parameters. The ranks obtained in Analysis of variance as follows, 1st rank to spindle speed, 2nd rank to feed rate and 3rd rank to depth of cut in both analysis (response Table for Means and : Response Table for Signal to Noise Ratios: Smaller is better). The confirmation test is taken and comparison made between the predicted value of surface roughness which is obtained from regression analysis equation and the actual value of surface roughness which is obtained from practical experiment process.
REFERENCES
Abhishek Dubey, Devendra Pathak, Nilesh Chandra, AjendraNath Mishra, Rahul Davis, “A Parametric Design Study of End Milling Operation using Grey Based Taguchi
Method”, ”, International Journal of Engineering Trends
and Technology (IJETT)– Volume 21 , pp. 103-110, March
2015.
Abhishek Kumbhar, RohitBhosale, Amit Modi, Shalaka Jadhav, Suresh Nipanikar, Aditya Kulkarni, “Multi-objective Optimization of Machining Parameters in CNC
End Milling of Stainless Steel 304”, International Journal
of Innovative Research in Science, Engineering and
Technology, Vol. 4, Issue 9, pp. 8419-8426, September
2015.
Amal, T.S., Vidya, V. and Abraham, K. Varughese, “Machining Parameters Optimization In End Milling Of
Ti6Al4V Using Taguchi Method”, International Journal of
Research in Engineering & Technology, Vol. 3, Issue 8,
pp. 31-40, Aug 2015.
Ashok Raj, R., T Parun, K Sivaraj and T M Kannan, “Optimization of Milling Parameters ofEN8 Using Taguchi
Methodology”, International Journal of Mechanical
Engineering and Robotics Research, Vol. 2, No. 1, pp.
202-208, January 2013.
Avinash, A. Thakre, “Optimization of Milling Parameters for
Minimizing Surface Roughness Using Taguchi‘s
Approach”, International Journal of Emerging Technology
and Advanced Engineering, Volume 3, Issue 6, pp.
226-230, June 2013.
Bala Raju, J., AnupKumar, J., DayalSaran, P., Dr. C.S. Krishna Prasad Rao, “Application of Taguchi Technique for Identifying Optimum Surface Roughness in CNC end Milling Process.
Dale, H. Besrerfield, Total quality management, Pearson Education (Singapore) Pvt Ltd, Delhi India 2004.
Douglas Montgomery, Design and analysis of experiment, Wiley India PVT.LTD, Delhi 2006.
Hajra choudhary, S.K. Elements of Work shop technology Vol
II .(machine tools), Media promoters and publishers PVT
LTD, Mumbai 2008
Harne, M.S., Ravikumar L. Shirsat, “Optimization of End Milling Parameters on Surface Roughness of Die Steel
HCHCr by Taguchi Method”, International Journal of
Science and Research (IJSR), Volume 4 Issue 1, pp.
2699-2702, January 2015.
International Journal of Emerging Technology and Advanced Engineering, Volume 4, Issue 4, pp. 1140-1146, April 2014.
Jaknarin Chatthong, Surasit Rawangwong, Julaluk
Rodjananugoon, Romadorn Burapa, And Worapong Boonchouytan, “An Investigation of Optimum Cutting Conditions in Face Milling Nodular Cast Iron FCD 400
Using Carbide Tool”, International Journal of Materials,
Mechanics and Manufacturing, Vol. 1, No. 4, pp. 309-313,
November 2013.
Jijo anatomy, Design of Experiment, Elsevier Science & Technology Books, October 2003.
Julia Hricova, Martin Kovac, Peter Sugar, “Experimental Investigation of High Speed Milling of Aluminium Alloy” International Journal of Engineering Development and
Research, pp. 773-777, 2014.
Kothari, C.R. Research Methodology methods and techniques, New Age International Publishers, New Delhi India 2004. Krishnaraja, V., S Samsudeensadhama, R Sindhumathia, P
Kuppan, “A study on high speed end milling of titanium
alloy”, , Procedia Engineering 97, pp. 251-257, 2014.
Lande, A.R., Gaidhani, Y.B., S.B. Patil, “Experimental Investigation of AL-6351 by Using Gray Taguchi
Methodology”, International journal of Innovation in
Engineering and Technology, volume 6, pp. 371-380, 2
December 2015.
Lohithaksha, M. Maiyara, Dr. R. Ramanujamb, K. Venkatesanc, Dr. J. Jerald, “Optimization of Machining Parameters for End Milling of Inconel 718Super Alloy
Using Taguchi Based Grey Relational Analysis”, Procedia
Engineering 64, pp. 1276-1282, 2013.
Madhava Reddy, S. “Optimization of Surface Roughness in High-Seed End Milling Operation Using Taguchi’s
Method”, International Journal of Mechanical Engineering
and technology (IJMET), Volume 4, Issue 4, pp. 249-258,
Mohamad SyahmiShahrom ,Nafrizuan Mat Yahya and Ahmad ad RazlanYusoff, “Taguchi Method Approach on Effect of Lubrication Condition on Surface Roughness in Milling
Operation”, Procedia Engineering 53, pp. 594-599, 2013.
Nimase, R.N., Dr. P. M. Khodke, “Effect of Machining Parameters on Surface Roughness of Al-7075 Alloy in End
Milling “International Research Journal of Engineering
and Technology (IRJET), Volume: 02 Issue: 03, pp.
1505-1508, June-2015.
Panga J.S., M.N.M. Ansari a, Omar S. Zaroog Moaz H. Ali, S.M. Sapuan, “Taguchi design optimization of machining parameters on the CNC end milling process of hallo site nanotube with aluminium reinforced epoxy matrix (HNT/Al/Ep) hybrid composite”, Housing and Building
National Research Center, HBRC Journal, pp. 138–144,
2014.
Pankaj Chandna, Dinesh Kumar, “Optimization of End Milling Process Parameters for Minimization of Surface Roughness
of AISI D2 Steel”, International Journal of Mechanical,
Aerospace, Industrial and Mechatronics Engineering Vol:
9, No: 3, pp. 452-457, 2015.
Raghuwanshi, B.S. Work shop technology vol. II (machine tools), Dhanpat Rai & co. LTD, Delhi India 2001.
Rajesh Kumar, M. K. Pradhan, Rishi kumar, “Modeling and optimization of end milling parameters on aluminium 6061 alloy using GRA based Taguchi method coupled with PCA”, 5th International & 26th All India Manufacturing Technology, Design and Research Conference (AIMTDR 2014), pp. 90.1-90.6,IIT Guwahati, Assam, India, December 12th–14th, 2014.
Ramanujam, R., Lohithaksha, M. Maiyar, K. Venkatesan and
MithunVasan, “Multi-Response Optimization Using
ANOVA and Desirabilityfunction Analysis: A Case Study
in end Millingof inconel Alloy”, ARPN Journal of
Engineering and Applied Sciences, VOL. 9, NO. 4, pp.
457-463, APRIL 2014.
Ramesh, B., A. Elayaperumal, R. Venkatesh, S. Madhav, Kamal Jain, “Determination of optimum parameter levels
formulti-performance characteristics in conventional
milling of beryllium copper alloy by using response surface
methodology”, International Journal of Innovative
Research in Science, Engineering and Technology, Vol. 3,
Issue 4, pp. 10916-10923, April 2014.
Ravikumar, D. Patel, Nigam, V. Oza and Sanket, N. Bhavsar, Prediction of Surface Roughness in CNC Milling Machine by Controlling Machining Parameters Using ANN”, International Journal of Mechanical Engineering and
Robotics Research, Vol. 3, No. 4, pp. 353-359, October
2014.
Sayeed Ahmed, G.M., P.Ravinder Reddy, N.Seetharamaiah, “Experimetal Evaluation of Metal Cutting Coefficient under the Influence of Magneto-Rheological Damping in
End Milling Process”, Procedia Engineering 64, pp.
435-445, 2013.
Shirsat, L.S., N.D. Khutafale, R.A. Tamboli, “Implementation of Taguchi Design of Experiment for Better Surface Finish
in Milling Operations”, International Journal of
Engineering Development and Research, Volume 2, Issue
1, pp. 440- 444, 2014.
Subramanian, M., M. Sakthivel, K. Sooryaprakash,
R.Sudhakaran, “Optimization of Cutting Parameters for Cutting Force in Shoulder Milling of Al7075-T6 Using Response Surface Methodology and Genetic Algorithm”,
Procedia Engineering 64, pp. 690-700, 2013.
Surasit Rawangwonga, Jaknarin Chatthonga, Worapong Boonchouytana,and RomadornBurapa, “An Investigation of Optimum Cutting Conditions in Face Milling
Aluminium Semi Solid 2024 Using Carbide Tool”, Energy
Procedia 34, pp. 854-862, 2013.
Thakur Paramlit Mahesh, R. Rajesh, “Optimal Selection of Process Parameters in CNC end milling of AL 7075-T6 aluminium alloy using a Taguchi-Fuzzy approach”, procedia materials science 5, pp. 2493-2502, 2014.