549
Modified Whale Optimization Algorithm For
Feature Selection In Micro Array Cancer Dataset
M. Sathya, Dr .S.Manju Priya
Abstract: The investigation of cancer disease have become the recent trend in data mining. The availability of gene expression data has allowed researchers to explore large volume of gene expression data for differentiating cancer causing genes from normal functioning genes. Microarray data are composed of large quantities of genes that are expression of certain conditions. Predicting and classifying genes that are responsible for causing tumor or cancer are challenging. Since large amounts of genes require high computations. Also, Microarray datasets are known for high dimensionality, and require dimensionality reduction or feature selection methods for building models. For cancer detection, a modified whale optimized algorithm is proposed to select feature genes from the microarray dataset. Selecting relevant feature genes helps in dimensionality reduction of the dataset and target genes that are responsible for causing cancer. The proposed method’s performance is studied by using different cancer microarray dataset.
Keywords: microarray dataset, feature selection, classification, search strategy, Whale optimization algorithm, dimensionality reduction, gene expression data.
—————————— ——————————
1.
INTRODUCTION
Microarray technology allows researchers to measure and discover genes that are responsible for causing tumor or cancer. The prognosis of cancer disease is studied using gene expression analysis utilizing micro array technology. By using micro array technology, the molecular, cellular and functional expression levels of thousands of genes can be measured in parallel. Microarray dataset largely differs from other datasets as the number of samples studied would be less than the features, which run into several thousands. The classification of microarray data is based on binary approach, where the genes are classified into healthy and cancer-causing ones, while multiclass problems target to spate the genes with different types of tumor or cancer. Microarray data analysis does not yield better gene selection and classification accuracy for multiclass problems. The presence of a large number of features causes class imbalance, redundant genes, large variance and outliers, which largely influence the prediction accuracy of machine learning models. Mainly a microarray dataset experiments are used to understand disease development under certain experimental condition to differentiate between healthy and disease state. In data mining several algorithms are used to handle dimensionality reduction (Deegalla et al., 2007; Shen & Tan, 2005; Boulesteix, 2004; Plaza et al., 2005), feature selection and feature engineering. Feature dimension reduction mainly targets to differentiate between relevant and irrelevant features and removes irrelevant features, while feature selection method targets to select relevant feature and creates subsets.
The feature selection in microarray dataset should be capable of finding relevant features maintaining the feature values unaltered. Feature selection and dimensionality reduction methods improve the prediction rate of classification task and avoid over-fitting problems with respect to sample inadequacy and high feature dimension. Feature selection techniques are generally grouped into three main categories, namely filter (Yang, 2010; Huerta, 2006), wrapper (Nanni et al., 2012; Mortazavi & Moattar, 2016) and embedded methods (Apolloni, 2016;Kar et al., 2015;Prasartvit et al., 2013). Filter method uses feature statistically while deriving feature importance and the statistical measure includes distance, correlation and information theory. Wrapper methods subset features with respect to a classifier’s performance use search strategy such as heuristic search, breadth first search, random search etc. Embedded method uses feature ranking as a part of the learning models and the selected features are used to construct the models, examples include SVM and RF. When compared to wrappers, filter methods are less computationally expensive and generally faster than wrappers. While wrapper methods are computationally expensive due to the extensive search process involved, metaheuristics search based methods are extensively used for the classification problem, involving more complex procedures and computations. The choice of metaheuristic methods for optimization problem is high due to its higher performance and ability to generate optimal solutions (Mishra et al., 2012; Fong et al., 2014;Li et al., 2013;Ghosh et al., 2019). Some of the metaheuristics algorithms widely used in data mining are genetic algorithmic model, Ant colony optimization algorithmic model, artificial bee colony algorithmic model, particle swarm optimization algorithmic model and simulated annealing. In the family metaheuristics algorithm Whale optimization algorithm (WOA) was introduced (Mirjalili, Lewis, 2016) which mimics the hunting strategy of humpback whales. Since microarray datasets are high-dimensional, filtering subsets from larger feature space requires an extensive and strong search method. To effectively select feature subsets, a modified or improved whale optimization algorithm is presented in this study. With the simplicity and less dependency on the parameters of WOA, the local minima can be extended to fit the best solution at random through which the exploration can be tuned to fit the best position of the agents. The proposed _____________________________________
• M. Sathya, Research Scholar, Dept. of Computer
Science,Karpagam Academy of Higher Education,
Coimbatore.
550 modified WOA aims to improve the exploration of WOA
algorithm by employing a fitness function which finds the location of the agents at minimum distance. This paper is structured and ordered into six sections: Section 1 discusses introduction to microarray data and feature selection, Section 2 talks of recent related literatures on microarray feature selection, Section 3 explains the proposed feature selection method, Section 4 deals with experimental setup, Section 5 explains the results and Section 6 gives the conclusion.
2.
RELEATED
WORKS
Dash et al., 2019 proposed a metaheuristic method for gene selection using binary shuffled for leap algorithm. The accuracy of the proposed method is tested on five microarray datasets. The proposed method is tested against feature selection methods such as DE, PSO and GA by using KNN model, ANN model and SVM model by using the mas base classifiers. BSFLA outperforms other methods on all five datasets. The study used CNS, ADCA Lung, AllAML, Leukemia and prostate microarray dataset. Yan et al., 2019 proposed a binary coral reef optimization algorithm for feature selection of microarray dataset. KNN, SVM and EML are used as the base classifiers to find out the prediction quality of the planned method. The study uses 13 different microarray datasets and the accuracy of the method is compared with different methods such as IGA, MBPSO, ISFLA and WOASAT. The proposed method outperforms other methods when combined with KNN. Gangavarapu & Patil, 2019 proposed a novel filter-wrapper hybrid feature selection on GA using weighted occurrence frequency and penalty scheme. The proposed method was evaluated on three microarray dataset and compared with filter and wrapper approach. The proposed hybrid GA method outperforms other methods by producing 4.17% with TIS dataset, 15.14% on Skin cancer dataset and 9.93% on Seizure dataset. Baliarsingh et al., 2019 proposed a new method to minimize the genes to maximize the classification accuracy. The proposed work involves multi-objective chaotic emperor penguin algorithm. The initial set of genes is filtered using fisher score and MRMR, and the performance of the method is compared with non-dominated sorting genetic algorithm, multi-objective PSO and chaotic version of multi-objective optimization. The experimental study shows that the proposed method is more efficient than other methods. Lu et al., 2019 introduced a genetic algorithm based online gradient boosting technique to study the prognosis of breast cancer. To better the classification quality, genetic algorithm is coupled with online gradient boosting model. The proposed model is evaluated on breast cancer dataset and it has achieved an overall improvement of 28% over other methods. Allam et al. 2018 proposed a wrapper based feature selection method and a binary teaching learning based optimization. The genes are taken by the planned model which improves the precision rate of Naïve Bayes to 98%, SVM to 98.43% and KNN to 94.91%, and DT to 94.61%, and DA to 98.63% on breast cancer dataset. Dashtban et al., 2018 introduced a new method to overcome the higher dimension problem in microarray data and select informative genes. The study proposed a bio-inspired multi-objective algorithm inspiring bat algorithm. Using local search strategy, the method is evaluated on three different microarray datasets to extract the cancer genes. The classification results prove that the proposed method is robust in detecting cancer genes with
551 of the three classifiers. Das et al., 2017 proposed a
bi-objective genetic algorithm giving ensemble-based feature selection. The proposed method selects the features using information theoryand a rough set which classifies genes in parallel. The results of parallel processing significantly reduce the processing time, and the proposed method shows higher accuracy rate than other methods do.
3
METHODOLOGY
The goal of this study is to detect relevant features from the microarray data to identify the presence and absence of cancer or tumor. Feature selection methods employ several optimization algorithms to grow gradually less than the number of features to derive the best feature subset. The WOA algorithm introduced by Mirjalili, Lewis, 2016 is used for many optimization problems to find the optimal solution and select relevant features. Many studies used WOA algorithm to select relevant features and showed that the performance of WOA could be improved further to produce better results, and used for feature selection in microarray datasets for cancer and tumor classification.
A.WHALEOPTIMIZATIONALGORITHM
The concept of WOA was motivated from the hunting strategy of humpback whales and deriving a mathematical model for the hunting strategy. The hunting strategy use a bubble-net technique in which the whales circle around the prey, usually small fishes and eat. Whales move deep below the fishes and start moving to the surface, creating a big circle of bubbles. The bubbles act as a trap and force the fishes to move to the surface. The whales hunt the fish moving to the surface. Technically the hunting process involves three stages (Mirjalili, Lewis, 2016), namely circling, exploitation and exploration. The quality of exploitation and exploration determines the quality of fishes eaten. Encircling phase: During this phase whales identify the position of the fishes and encircle them. Initially the point of the optimum location is not defined and initiated at random. Based on the random initiation other agent update their position and the updated position become the optimum location to the target. The position of the whale and the encircling can be represented by equation 1 and 2 (Mirjalili, Lewis, 2016).
⃗⃗ ( ) ( ) (1) ( ) ( ) x ⃗⃗ (2)
The term ⃗⃗ and ⃗ gives vector coefficients, t represents the present iterations, term ⃗⃗ gives the position vector and ⃗⃗ said to be the best solution (position) started at random. The vector ⃗⃗ and ⃗ coefficients are calculated using equation 3 and 4 (Mirjalili, Lewis, 2016).
x (3)
(4)
The components of ⃗ are decreased from 2 to 0 during each iteration linearly and represents the random value between 0 and 1.
Exploitation phase: This phase involves two steps i) encircling and ii) updating the position spirally. Encircling behavior can be formulated by decreasing ⃗ linearly from 2 to 0 for each iteration (Mirjalili, Lewis, 2016).
Update spiral position: The position of the whale to the fish, the helical shaped movement of the whales is given by,
( ) ⃗⃗ ( ) ( ) (5)
Where ⃗⃗ ′ ⃗⃗ ( )__ ⃗⃗ ( ) is the current position between the fish and the whale, b unchanging factor or constant that represents the spiral migration of the whales and b also a random vector of [-1, 1]. Also, there exists a probability of choice:either diving deep through circling and forming spiral is given mathematically by equation 6 and the random vector of value is p [0,1] (Mirjalili, Lewis, 2016).
( ) { ( ) ⃗⃗ ⃗⃗ ( ) ⃗⃗⃗⃗⃗⃗ ( ) (6)
Exploration phase
Exploration for fishes is a global search and whales search for the fishes moving to the surface. The choice of switching between exploitation and exploration is based on ⃗⃗ , a vector with values of [0,1] where 0 implies exploration and 1 exploitation. And the whale’s new position is given by the equation 7 and 8 (Mirjalili, Lewis, 2016).
⃗⃗ ⃗⃗⃗ (7)
( ) ⃗⃗⃗ ⃗⃗⃗ (8) whereXrandgives the new position of the whale which is chosen at random from the other whales (Mirjalili, Lewis, 2016).
Pseudo code for WOA algorithm (WOA) Generate number of Whales Xi (i = 1, 2, ..., n) Find the fitness of each search agent
X*=the best whale solution
while (t < maximum number of runs) for each whale in Xi Update a, A, C, l, and p
if1 (p<0.5)
if2 (|A| < 1)
Update the position of the current search agent by the Eq. (1)
else if2 (|A|≥1)
Select a random search agent (Xrand) Update the position of the current search agent by the Eq. (8)
end if2 else if1 (p≥0.5)
Update the location of the current search by the Eq. (5)
end if1 end for
Update search agent’s location using fitness function Update X* if there is a better solution
t=t+1 end while
return X*
B.PROPOSEDMODIFIEDWHALEOPTIMIZATION ALGORITHMICMODEL(MWOA)
552 easy bleeding, etc., Lymphoma cancer occurs at
infection-fighting cells of the immune system, termed as lymphocytes. The symptoms of this cancer are fever, night sweats, shortness of breath, unexplained weigthloss, etc., Prostate cancer may occur in the urinary bladder of men. The pain occurs in bones. There are various symptoms or causes for this cancer like burning during urination, blood in urine, loss of bladder control, etc. In WOA the selection of solution is completely at random as most of the optimization algorithms initiate. The random selection of solution does not guarantee achievements of global optimum, as the location of the search agents is found to be finalized with respect to the distance to reach the food source. For the feature selection problem, the number of solutions by a search agent include both addition and removal of a feature. The choice of the whale agents is completely at random, and the random choice is given by a fitness function f(x) = x{(xii) if x=1} and {f(x) = 0 if x=0}, where the fitness function is the choice of considering the search agent solution, i.e., the choice of including a feature into the subset when x=1. The fitness of the search agent is measured by the distance between the search agents. When the length in-between a search agent and the whale is high, the fitness of the agent is low, as the distance is larger. When the length in-between a search agent and the whale is low, then the fitness becomes high, as the distance is low. Lower distance helps to update the whale position in the next iteration. The search agent’s position is measured by using the Eq.(9)
Xii = (Pmin-Pmax) (9)
The feature selection for microarray dataset suffers from a large feature space as the micro array dataset dimension is large. The optimal feature subset is achieved through a fitness function which directly measures each of the search agent’s fitness to produce best solution (Bs). The fitness function is given by Bs (10),
Bs= IM (sub)-cardinality(sub)+accuracy(sub) ( 10) Where IM(sub) is the information Measure of each feature in the subset, cardinality(sub) is the proportion of the total features present in the dataset to the features present in the subset and accuracy(sub) is the classification accuracy of the subset on a classifier. The classification accuracy of the subset is measured using KNN.
Pseudo code for modified WOA algorithm (MWOA) Number of whales are generated as Xi (i = 1, 2, ..., n) Fitness function of each search agent is to found by X*= Best search solution
While (t < maximum number of iterations) for each whale in Xi
Update a, A, C, l, and p if 1 (p<0.5)
if 2 (|A| < 1)
By Eq. (1) update position of the current search agent
else if 2 (|A|≥1)
Select a random search agent (Xrand) By Eq. (8) Update position of the current search agent
end if 2 else if 1 (p≥0.5)
By Eq. (5) Update position of the current search
end if 1
end for
Search agents updates the position by using function f(xii) By Eq. (10) Calculate the fitness of each search agent using the fitness function Best Solution (Bs)
If the best search solution is found then update X* t=t+1
end while return X*
4.
EXPERIMENT
SETUP
The performance evaluates the modified WOA on microarray dataset’s three publicly available benchmark datasets. The features extracted by modified WOA are compared with PSO algorithm by building classification models using SVM, NB and KNN. The proposed modified WOA and PSO are implemented using R tool, which is an open source software.
Data Set
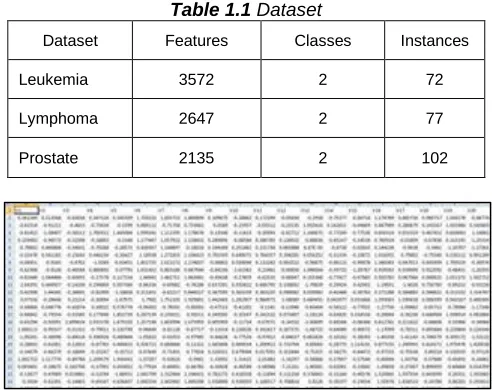
The experimental study uses Leukemia, Lymphoma and prostate micro array datasets (Table 1.1) to study the model’s performance. The data sets are publicly available in the internet. Leukemia dataset consists of 72 instances, 3572 features and 2 classes, lymphoma dataset consists of 77 instances, 2647 features, and 2 classes. Prostate dataset has 102 cases, 2135 features and 2 classes. The performance of this model is evaluated on the testing and training datasets. The datasets are divided into testing and training set in the ratio of60:40. A sample of leukemia dataset is given in Fig. 1.0.
Table 1.1 Dataset
Dataset Features Classes Instances
Leukemia 3572 2 72
Lymphoma 2647 2 77
Prostate 2135 2 102
Fig 1.0 Sample of leukemia Dataset
Evaluation Metrics
553 When the proportion of positive instances is said to be
positive, then it is called as True positive. When the instances are said as true negatives then it is called as True negatives. False positive is the positive instances that are said to be negatives. False negative is the negative instances that are said to be positives. The performance of the classification models helps to find the accuracy by using evaluation metric. Accuracy is calculated using the formula,
( ( ) ( ))
( ( ) ( ) ( ) ( )) To calculate Sensitivity using the below formula,
Sensitivity= ( ( ))
( ( ) ( )) By using the below formula Specificity calculated Specificity= ( ( ))
( ( ) ( ))
Table 1.2 Confusion Matrixes
Facts (or) Real
PREDICTED INFORMATION Positive Negative
Positive True Positives (TPs)
False Positives (FPs)
Negative False Negatives (FNs)
True Negatives (TNs)
5.
RESULTS
AND
DISCUSSION
To find the accuracy of feature selection in the proposed method by using modified MWOA is on the classification models using SVM, NB and KNN using Lymphoma, Leukemia and Prostate cancer microarray data. According to Table 1.3 the total number of features selected by MWOA for Leukemia dataset is 43 from 3572, for Lymphoma dataset 39 from 2647 and for prostate dataset 135 from 2135 features. On the other hand, PSO algorithm selected about98 features for leukemia dataset, 19 for prostate dataset and 295 for lymphoma dataset. The performance of the models is tested using the selected features and compared with classification models SVM, NB and KNN. The classification accuracy achieved for leukemia dataset by SVM was55.17%, for prostate dataset SVM 85.36% and for lymphoma dataset 90.32%. KNN achieved 79.31% for leukemia dataset, 76.60% for prostate dataset and 77.41% for lymphoma dataset. NB classifier achieved an accuracy of 75.86% on leukemia, 73.17% on prostate dataset and 80.64% on Lymphoma dataset. The overall performance of MWOA for Lymphoma dataset shows that SVM achieved the highest accuracy of 90.32%, while KNN achieved the highest accuracy of 79.31% on leukemia dataset and NB 80.64% on Lymphoma dataset (Table 1.4).
Table 1.3 Features selected by MWOA and PSO
No of
features MWOA PSO
Leukemia 3572 43 98
Prostate 2135 135 19
Lymphoma 2647 39 295
Table 1.4 Performance of the models using MWOA
MWO+ SVM
MWOA+KN
N MWOA+NB
Leukemia 55.17% 79.31% 75.86% Prostate 85.36% 76.60% 73.17% Lymphoma 90.32% 77.41% 80.64%
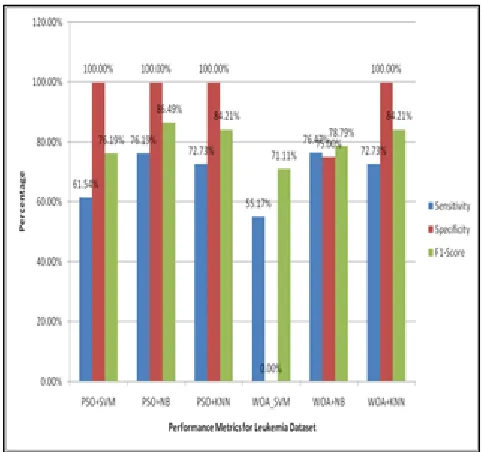
On the other hand, SVM on features selected by PSO algorithm achieved an accuracy of 65.51% on leukemia, 82.91% on prostate dataset and 79.32% on lymphoma dataset. KNN achieved an accuracy of 79.31% on leukemia dataset, 78.04% on prostate dataset and 74.14% on lymphoma dataset. NB achieved 82.75% of accuracy on leukemia dataset, 81.92% on prostate dataset and 80.64% on lymphoma dataset (Table 1.5). SVM achieved the highest accuracy of 82.91% on prostate dataset, KNN 79.31% on leukemia dataset and NB 82.75% on leukemia dataset. The overall performance of SVM showed higher accuracy of 85.36% on prostate dataset than PSO (52.91%) did. On lymphoma dataset the performance of SVM was high with 90.32% of accuracy when compared to PSO with 79.32%. NB classifier achieved the highest accuracy of 82.75% on leukemia outperforming SVM and KNN. The sensitivity, specificity and f1-score for prostate, lymphoma and leukemia datasets respectively are given in Fig (1.3, 1.4 and 1.5). The findings of the study reveal that the proposed SVM and MWOA models exceed the performance of PSO-based feature selection.
Fig 1.1 Accuracy of the models using MWOA
Table 1.5 Performance of the models using PSO
PSO+SVM PSO+KNN PSO+NB
Leukemia 65.51% 79.31% 82.75%
Prostate 82.91% 78.04% 81.92%
554
Fig 1.2 Accuracy of the models using PSO algorithm
Fig 1.3 Performance metrics for Prostate Dataset
Fig 1.4 Performance metrics for Lymphoma Dataset
Fig 1.5 Performance metrics for Leukemia Dataset
6.
CONCLUSION
Feature selection plays a significant role in improving the classification performance. For high dimensional microarray datasets selecting the irrelevant features and reducing the data dimensions is crucial. This study proposed a modified WOA for feature selection in microarray dataset. The contribution to feature chosen by the proposed method for classifying tumor and cancer disease is tested using SVM, KNN and NB models on lymphoma, leukemia and prostate datasets. The results are compared with the features selected by PSO algorithm. The findings of the study show that the proposed MWOA outperforms PSO-based feature selection when using SVM as the base classifier. SVM outperforms NB and KNN on prostate and lymphoma datasets with an accuracy of 90.32% (135) and 85.36% (39) respectively. The present work can be extended to use a greater number of micro array datasets using other classification models. Also, as a future work, optimization of selecting relevant features utilizing feature information in the microarray dataset for multiclass problem would address more gene selection problems and help to better understand the prognosis of cancer. [1 – 42].
7
REFERENCES
[1] S. Mirjalili, A. Lewis, The whale optimization algorithm, Adv. Eng. Softw. 95 (2016) 51–67.
[2] Dash, R., Dash, R., &Rautray, R. (2019). An evolutionary framework based microarray gene selection and classification approach using binary shuffled frog leaping algorithm. Journal of King Saud University-Computer and Information Sciences. [3] Yan, C., Ma, J., Luo, H., & Patel, A. (2019). Hybrid
binary Coral Reefs Optimization algorithm with Simulated Annealing for Feature Selection in high-dimensional biomedical datasets. Chemometrics and Intelligent Laboratory Systems, 184, 102-111.
555 dimensionality of high-dimensional biomedical
datasets. Applied Soft Computing, 105538.
[5] Baliarsingh, S. K., Vipsita, S., Muhammad, K., &Bakshi, S. (2019). Analysis of high-dimensional biomedical data using an evolutionary multi-objective emperor penguin optimizer. Swarm and Evolutionary Computation, 48, 262-273.
[6] Lu, H., Wang, H., & Yoon, S. W. (2019). A dynamic gradient boosting machine using genetic optimizer for practical breast cancer prognosis. Expert Systems with Applications, 116, 340-350.
[7] Allam, M., &Nandhini, M. (2018). Optimal feature selection using binary teaching learning based optimization algorithm. Journal of King Saud University-Computer and Information Sciences. [8] Dashtban, M., Balafar, M., &Suravajhala, P. (2018).
Gene selection for tumor classification using a novel bio-inspired multi-objective approach. Genomics, 110 (1), 10-17.
[9] Pashaei, E., Pashaei, E., & Aydin, N. (2018). Gene selection using hybrid binary black hole algorithm and modified binary particle swarm optimization. Genomics.
[10]Mohamed, N. S., Zainudin, S., & Othman, Z. A. (2017). Metaheuristic approach for an enhanced mRMR filter method for classification using drug response microarray data. Expert Systems with Applications, 90, 224-231.
[11]Pashaei, E., & Aydin, N. (2017). Binary black hole algorithm for feature selection and classification on biological data. Applied Soft Computing, 56, 94-106. [12]Prasad, Y., Biswas, K. K., &Hanmandlu, M. (2018). A
recursive PSO scheme for gene selection in microarray data. Applied Soft Computing, 71, 213-225.
[13]Gao, X., & Liu, X. (2018). A novel effective diagnosis model based on optimized least squares support machine for gene microarray. Applied Soft Computing, 66, 50-59.
[14]Lai, C. M. (2018). Multi-objective simplified swarm optimization with weighting scheme for gene selection. Applied Soft Computing, 65, 58-68.
[15]Lu, H., Chen, J., Yan, K., Jin, Q., Xue, Y., &Gao, Z. (2017). A hybrid feature selection algorithm for gene expression data classification. Neurocomputing, 256, 56-62.
[16]Medjahed, S. A., Saadi, T. A., Benyettou, A., &Ouali, M. (2017). Kernel-based learning and feature selection analysis for cancer diagnosis. Applied Soft Computing, 51, 39-48.
[17]Das, A. K., Das, S., & Ghosh, A. (2017). Ensemble feature selection using bi-objective genetic algorithm. Knowledge-Based Systems, 123, 116-127.
[18]Plaza, A., Martinez, P., Plaza, J., & Perez, R. (2005). Dimensionality reduction and classification of hyperspectral image data using sequences of extended morphological transformations. IEEE Transactions on Geoscience and remote sensing, 43(3), 466-479.
[19]Boulesteix, A. L. (2004). PLS dimension reduction for classification with microarray data. Statistical
applications in genetics and molecular biology, 3(1), 1-30.
[20]Shen, L., & Tan, E. C. (2005). Dimension reduction-based penalized logistic regression for cancer classification using microarray data. IEEE/ACM Transactions on Computational Biology and Bioinformatics (TCBB), 2(2), 166-175.
[21]Deegalla, S., &Boström, H. (2007, December). Classification of microarrays with knn: Comparison of dimensionality reduction methods. In International Conference on Intelligent Data Engineering and Automated Learning (pp. 800-809). Springer, Berlin, Heidelberg.
[22]Yang, C. H., Chuang, L. Y., & Yang, C. H. (2010). IG-GA: a hybrid filter/wrapper method for feature selection of microarray data. Journal of Medical and Biological Engineering, 30(1), 23-28.
[23]Huerta, E. B., Duval, B., &Hao, J. K. (2006, April). A hybrid GA/SVM approach for gene selection and classification of microarray data. In Workshops on Applications of Evolutionary Computation (pp. 34-44). Springer, Berlin, Heidelberg.
[24]Apolloni, J., Leguizamón, G., & Alba, E. (2016). Two hybrid wrapper-filter feature selection algorithms applied to high-dimensional microarray experiments. Applied Soft Computing, 38, 922-932.
[25]Kar, S., Sharma, K. D., &Maitra, M. (2015). Gene selection from microarray gene expression data for classification of cancer subgroups employing PSO and adaptive K-nearest neighborhood technique. Expert Systems with Applications, 42(1), 612-627. [26]Nanni, L., Brahnam, S., &Lumini, A. (2012).
Combining multiple approaches for gene microarray classification. Bioinformatics, 28(8), 1151-1157. [27]Prasartvit, T., Banharnsakun, A., Kaewkamnerdpong,
B., &Achalakul, T. (2013). Reducing bioinformatics data dimension with ABC-kNN. Neurocomputing, 116, 367-381.
[28]Mortazavi, A., &Moattar, M. H. (2016). Robust feature selection from microarray data based on cooperative game theory and qualitative mutual information. Advances in bioinformatics, 2016.
[29]Mishra, S., Shaw, K., & Mishra, D. (2012). A new meta-heuristic bat inspired classification approach for microarray data. Procedia Technology, 4, 802-806. [30]Fong, S., Deb, S., Yang, X. S., & Li, J. (2014).
Feature selection in life science classification: metaheuristic swarm search. IT Professional, 16(4), 24-29.
[31]Li, Y., Wang, G., Chen, H., Shi, L., & Qin, L. (2013). An ant colony optimization based dimension reduction method for high-dimensional datasets. Journal of Bionic Engineering, 10(2), 231-241.
[32]Seyyed Reza Khaze, Isa Maleki(2015). A New Approach in Bloggers Classification with Hybrid of K-Nearest Neighbor and Artificial Neural Network Algorithms.in Indian Journal of Science and Technology, volume 8, issue 3, 237-246.
556 [34]Ghosh, M., Begum, S., Sarkar, R., Chakraborty, D.,
&Maulik, U. (2019). Recursive Memetic Algorithm for gene selection in microarray data. Expert Systems with Applications, 116, 172-185.
[35]Rajendran T and Sridhar K P. Epileptic seizure classification using feed forward neural network based on parametric features. Int J Pharma Res 2018; 10(4): 189-196.
[36]Hariraj V, et al. Fuzzy multi-layer SVM classification of breast cancer mammogram images. Int J Mech Eng Tech 2018; 9(8): 1281-1299.
[37]Rajendran T et al. Epileptic Seizure-Classification using Probabilistic Neural Network based on Parametric Features. Int J Sci Tech Res 2020. (Article in Press).
[38]Emayavaramban G, et al. Identifying User Suitability in sEMG Based Hand Prosthesis Using Neural Networks. Curr Signal Transd Ther 2019; 14(2): 158 – 164.
[39]Rajendran T and Sridhar K P. An Overview of EEG Seizure Detection Units and Identifying their Complexity- A Review. Curr Signal Transd Ther 2020. (Article in Press).
[40]Rajendran T et al. Recent Innovation in Soft Computing Applications. Curr Signal Transd Ther 2019; 14(2): 129 – 130.
[41]Rajendran T et al. Advanced Algorithms for Medical Image Processing. Open Biomed Eng J 2019; 13(Suppl-1, M1): 102.