Page 132
WHAT DOES STUDY-TIME REVEAL ABOUT PERCEPTUAL VISUAL DIFFICULTY? DEBATING TWO THEORIES ABOUT STUDY-TIME ALLOCATION IN SPATIAL
GEOMETRY TASKS Mirela Widder
Technion - Israel Technology Institute, Haifa, Israel
Abstract
In spatial geometry instruction, investigating study-time allocation has the potential to further guide and assist the quest of understanding visual difficulty, and to shed additional light on the issue of using prototypes. Many classroom practices are designed based on the intuitive belief that difficulty increases the time allocated for learning. However, empirical findings from studies on metacognition show this is not always so. Research on metacognition suggests two theoretical explanations: 1) the Difficulty Reduction model intended to explain findings explaining simple cognitive tasks, and 2) the Region of Proximal Learning framework, explaining complex cognitive tasks. This preliminary study attempted to empirically examine study-time allocated for perceiving 3-D geometrical situations from 2-D sketches in spatial geometry tasks. The study aimed at debating the two theories about study-time allocation by using a priori measure of visual difficulty of 2-D sketches depicting cubes with auxiliary constructions. 12 corresponding pairs of normatively and un-normatively oriented cube-related sketches of different visual difficulty levels were individually approached by 174 12th grade high-school students, studying mathematics at the highest stream level. Data consisted of self-reported study-time while attending these sketches. Findings show that transforming the sketches’ orientation from normative to un-normative, triggered a substantial change in the metacognitive mechanisms involved in decisions about study-time allocated to learning. This may indicate that a greater cognitive complexity is involved in comprehending un-normatively oriented sketches. Therefore, these preliminary findings have theoretical and practical implications for both spatial geometry instruction and metacognitive research.
Keywords: study-time allocation, visual difficulty, measuring visual difficulty, normative/un-normative orientation, spatial geometry instruction
1. INTRODUCTION
In assessing mathematical performance of students, factors of strong practical interest include not only the scores received for comprehension, but also the time allocated for reaching understanding (Gredler, 1999). While scores measure the relative quality of students’ performance in a test, time allocation presents us with subtler information, reflecting metacognitive processes ancillary to learning. Literature on metacognition suggests that subjective judgements of learning-performance underlie decisions about further investment of effort and time in learning (Ackerman, 2013; Metcalfe & Kornell, 2005; Nelson & Narens, 1990; Son & Kornell, 2009; Thiede & Dunlosky, 1999).
Page 133
However, reality reveals that most learners do not study very difficult items for unreasonably – possibly even infinitely – long time. Attempting to solve this paradox, Metcalfe and Kornell (2005) suggest the existence of a region of proximal learning, specific to the individual, where a small amount of time and effort yield maximal learning gains. According to the Region of Proximal Learning framework (RPL), people stop learning when they feel they are making no further progress, and their perceived rate of learning approaches zero. Therefore, easy items are rapidly learned, since very soon the rate of learning approaches zero; with no further perceived learning, learners stop studying easy items after a relatively short time. With medium-difficulty items, knowledge increases slowly and steadily and learners perceive themselves to be making progress for a longer time. Hence, study-time will be significantly longer too. For very difficult items, learning stops when learners realize their efforts are in vain, and they are making no headway. In other words, if the perceived degree of learning has not yet reached the norm of study, more study-time will be allocated to the item, until the perceived rate of learning reaches zero. This theory is also supported by empirical findings (Metcalfe & Kornell, 2005).
Ackerman (2014) tried to reconcile these contradicting empirical findings by making a distinction between simple and complex cognitive tasks. Building upon Funke's (2010) classification of perception and memorization as simple elementary cognitive tasks contrasted to complex cognitive tasks such as problem solving and decision-making, Ackerman (2014) asserted that the Discrepancy Reduction model is consistent with the process of study-time allocation for simple tasks, where learners are able to reach their norm of study before their perceived rate of learning diminishes to zero. As task complexity increases, the perceived rate of learning may reach zero before learners are able to satisfy their learning criterion, and study-time allocation can be better explained within the Region of Proximal Learning (RPL) framework.
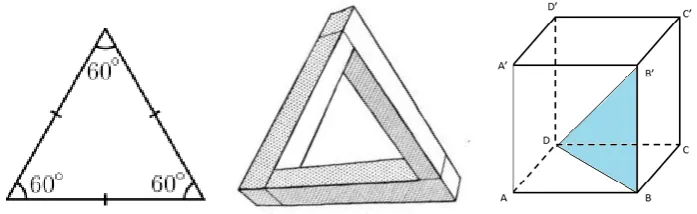
Ackerman's reconciliation of both theories as task dependent makes sense, but are all tasks comprised under the same category of equal cognitive complexity? Consider for example visual perception, classified as a simple elementary cognitive task (Funke, 2010). It is questionable whether the same classification is valid for both: perceiving a sketch of an equilateral triangle, and perceiving an impossible structure such as the Penrose triangle (Figure 1). Moreover, it is well established that perceiving 3-D geometric situations from static 2-D sketches are neither easy, nor natural to the learner (Bakó, 2003; Christou, Pittalis, Mousoulides & Jones, 2005; Gutiérrez, 1996; Parzysz, 1988). Additional empirical evidence about study-time allocated to different perceptual tasks is needed for drawing the line between simple and complex tasks.
Fig. 1. Is perception a simple cognitive task in all cases?
This preliminary study attempted to empirically examine study-time allocated for perceiving 3-D geometrical situations from 2-D sketches of different visual difficulty in spatial geometry. The study aimed at debating the two theories (the DR model and the RPL framework) through answering the following question:
Page 134 2. VISUAL DIFFICULTY
In previous research, visual difficulty measure (VDM) of 2-D sketches depicting cubes with auxiliary structures was constructed and validated (Widder, Berman & Koichu, 2014). VDM is based on calculating the ratio between two types of information embedded in the sketch: Potentially Helpful Information (PHI) that may elicit visualization and support deductive reasoning, and Potentially Misleading Information, that may hinder perception. Visual difficulty is higher as the sketch contains more PMI and less PHI, i.e. as VDM is lower (see examples in Figure 2). Since VDM depends solely
on the sketch, a priori measurement of visual difficulty embedded in the sketch is possible. This enables ranking the visual difficulty of cube-related 2-D sketches in advance, and evenly dividing
them into three levels of visual difficulty, low (0.6 ≤ 𝑉𝐷𝑀 < 0.8), medium (0.4 ≤ 𝑉𝐷𝑀 < 0.6), and high (0.2 ≤ 𝑉𝐷𝑀 < 0.4), visual difficulty sketches.
Fig. 2. Different visual difficulty levels of cube-related sketches (VDM).
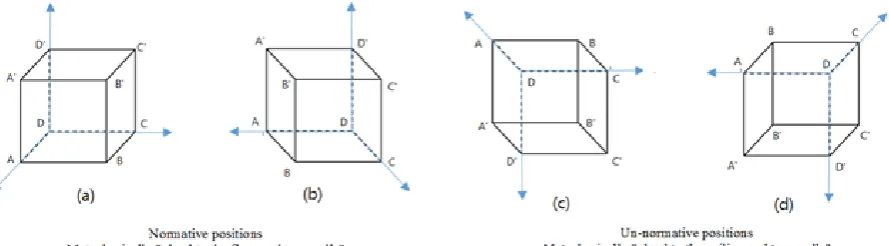
The findings of Widder, Berman and Koichu (2014) show that PHI and PMI are not the only features of a 2-D sketch influencing one’s vision; the orientation of the drawn object affects perception as well (Edelman & Bülthoff, 1992; Larios, 2003). Sketches in spatial geometry textbooks tend to present students with cubes oriented in a certain normative position, that could be metaphorically described as "glued to the floor and two walls" (see Figures 3(a) and 3(b)). However, as exemplified in Figures 3(c) and 3(d), there exist other, differently oriented sketches of cubes, that could be metaphorically described as "glued to the ceiling and two walls". Such un-normatively oriented sketches of cubes are very seldom encountered during spatial geometry instruction. In contrast, the frequent use of normatively oriented sketches of cubes makes them prototypical for high-school students (Larios, 2003; Maracci, 2001).
Page 135
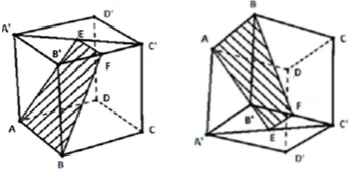
Sketches of un-normatively positioned cubes can be obtained by vertically flipping the sketches of normatively positioned cubes. For example, Figure 3(c) is obtained by vertically flipping Figure 3(a), and Figure 3(d), by vertically flipping Figure 3(b). This transformation alters the orientation of the sketch, but does not change the visual geometrical information contained in the sketch. Consequently, the values of #PHI, #PMI, and the ratio #PHI/#PMI (VDM) are invariant under this transformation. Nevertheless, Widder, Berman and Koichu (2014) found evidence that deviations from normative sketches are more challenging for learners’ visual perception, resulting in a significant decrease in learners’ performance when presented with un-normatively oriented sketches compared to the corresponding normatively oriented sketches. Figure 4 shows an example of two corresponding cube-related sketches.
Fig. 4. Two corresponding normatively and un-normatively oriented cube-related sketches
As explained in detail in Methodology section, study-time allocation was examined for CRVDT questionnaire items (Widder, Berman & Koichu, 2014), and addressed both mentioned aspects of visual difficulty in cube-related 2-D sketches: visual difficulty derived from visual information embedded in the sketch, as measured and ranked by VDM, and visual difficulty derived from the sketch's orientation (normative or un-normative).
3. METHODOLOGY
3.1. Cube-Related Visual Difficulty Test (CRVDT)
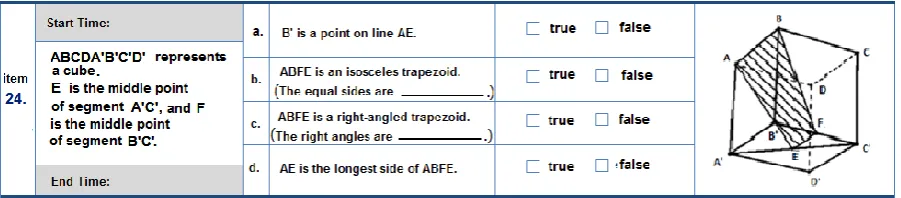
The CRVDT questionnaire (Widder, Berman & Koichu, 2014) included 24 items:12 pairs of corresponding normative and un-normative cube-related spatial geometry items (four of low, four of medium and four of high visual difficulty levels). A sample pair of corresponding items are presented in Figures 5 and 6. To prevent participants from eventual reconsideration and correction of errors, because of comparison between corresponding items, CRVDT questionnaire was divided into two parts, ensuring that corresponding items were comprised in different parts of the test. All 24 items were randomly divided between the two parts of the CRVDT questionnaire, under this constraint. Figure 5 below shows a sample CRVDT item, comprising a normatively oriented cube. Given the middle points of the base-diagonal A’C’ and the side-edge B’C’, respondents were asked about the features of quadrilateral ABFE.
Page 136
The corresponding un-normative CRVDT item contained the similar question about the vertically flipped un-normatively oriented sketch (see Figure 6).
Fig. 6. The corresponding un-normative CRVDT item for the item in Figure 5
The CRVDT questionnaire was tested for validity and reliability (see Widder, Berman and Koichu, 2014).
3.2. Participants
Participants included 174 high-school students, studying mathematics at the highest stream level in the 12th grade. According to the Israeli mathematics curriculum, students studying mathematics in the highest stream level complete studying both planar and spatial geometry in the 11th grade, and combine their knowledge in stereometry (including cubes, prisms, pyramids, cylinders and cones) with trigonometry in 12th grade. Therefore, participants were familiar with cubes and typical auxiliary constructions in the context of cubes.
3.3. Research Trajectory
While administering CRVDT, two big digital wall clocks, showing hours, minutes and seconds, were displayed in front of the class, for everybody to see. Previous research findings inferred that electronic measures confirm self-reported distribution of study-time (Taraban, Maki & Rynearson, 1999). Accordingly, respondents were asked to mark beginning and ending time (hour/minute/second) for solving each CRVDT item, thus enabling calculation of the amount of time invested in comprehending each item. Because time pressure appears to be a factor in deciding which items to study (Son & Metcalfe, 2000), CRVDT questionnaire was administered with no time limitations, thus encouraging participants to answer all items after thorough consideration. Having ample time, learners do not have to worry that addressing one item for longer time, would mean giving another item short shrift (Son & Metcalfe, 2000). Therefore, learners’ study-time allocation was expected to be limited mostly by their inner norm of study or their perceived rate of learning, eventually allowing us to take a closer glimpse of items’ visual difficulty. All the participants answered CRVDT questionnaire within a range of 18 to 52 minutes.
3.4. Data Analysis
Page 137 4. RESULTS
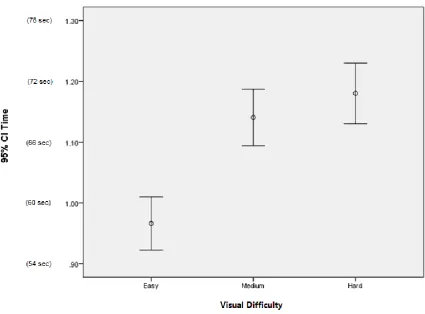
ANOVA results show that the main effect of visual difficulty (independent variable), on study-time allocation (dependent variable) is statistically significant, F (1.857, 317.582) = 41.124, p < .001. The values of F for each contrast, and their related significance values, tell us that the study-time was significantly longer for high visual difficulty items (M = 1.185, SE = 0.33) than for low visual difficulty items (M = 0.972, SE = 0.025), F (1,171) = 58.383, p < .001. In addition, the difference between the study-time allocated for low and medium visual difficulty items is also significant, F (1,171) = 60.79, p < .001. However, the study-time allocated for high visual difficulty items was not significantly longer than for medium visual difficulty items (M = 1.143, SE = 0.030), F (1,171) = 2.927, p = .089. Figure 7 displays the means of the study-time allocated for different question difficulty levels and the plot of these means (error bars).
Fig. 7. The interaction between sketches’ visual difficulty and study-time
On one hand, the findings seem to be consistent with the Region of Proximal Learning framework: low visual difficulty items are quickly learned, while longer study-time is required for medium visual difficulty items, and learners stop studying difficult items whenever they feel they are making no progress. On the other hand, it is still possible to explain the findings in accordance with the Discrepancy Reduction model. The study-time allocated to medium visual difficulty items was significantly longer than the study-time allocated to low visual difficulty items. Although not significantly different, still longer study-time was allocated to high visual difficulty items compared to the study-time allocated to medium visual difficulty items.
Page 138
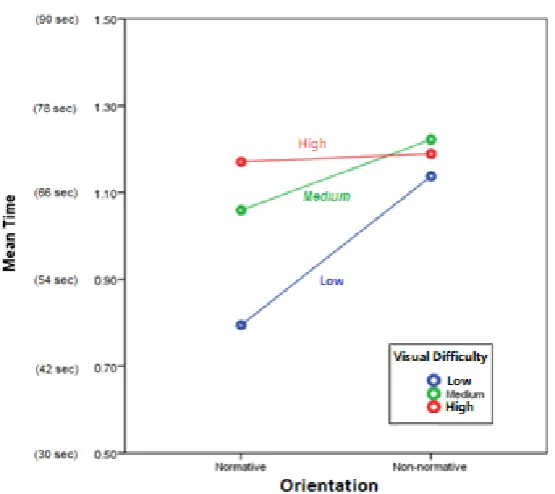
The interaction graph in Figure 8 infers that for normatively oriented items, as the visual difficulty level increased, study-time was significantly prolonged: for low to medium visual difficulty items, F (1,173) = 113.123, p < .001; for medium to high visual difficulty items, F (1,173) = 15.64, p < .001; for low to high visual difficulty items, F (1,173) = 174.684, p < .001. These results are consistent with the Discrepancy Reduction model.
However, for un-normatively oriented items, the findings do not comply with the Discrepancy Reduction model. First, as can be noticed in interaction graph in Figure 8, there seems to be very little difference between the study-time allocated for un-normatively oriented items of various visual difficulty. Moreover, the only significant difference was between the study-time allotted to low vs. medium visual difficulty items, F (1,173) = 5.862, p=0.017. Our other findings for visual difficulty vs. study-time allocation in un-normatively oriented items are not statistically significant: for medium vs. high visual difficulty items, F (1,173) = 0.956, p = .329; for low vs. high visual difficulty items, F (1,173) = 1.755, p = .187. Second, when comparing the study-time allocation for normatively vs. un-normatively oriented items, the augmentation across the different difficulty levels is uneven. The interaction graph in Figure 8 shows a minor difference in time allocation for high visual difficulty normative and un-normative sketches (the line is almost flat). For medium and low visual difficulty items, there is a significant increase in the time spent for comprehending un-normatively oriented sketches compared to normatively oriented sketches. For low visual difficulty items, the line displays a sharper slope, showing a relatively sharper increase in the allocated study-time. In addition, the findings show that medium visual difficulty items are studied for longer time, not only compared to low visual difficulty items, but also compared to high visual difficulty items. These interesting findings, suggesting that visual perception tasks may comprise of different cognitive complexity levels, can be better explained within the RPL framework.
Orientation Visual difficulty Mean Time Standard Error 95% Confidence Interval
Normative
Low 1.146 0.035 (1.077,1.214)
Medium 1.224 0.034 (1.156,1.292)
high 1.195 0.038 (1.119,1.271)
Un-Normative
Low 0.798 0.021 (0.755,0.840)
Medium 1.063 0.032 (1.001,1.126)
high 1.176 0.034 (1.109,1.243)
Page 139
Fig. 8. The effect of Orientation on Mean Time across sketches’ visual difficulty
5. DISCUSSION
Findings showed a meaningful difference in study-time allocated for normative and un-normative sketches for different difficulty levels (see Figure 8). Study-time allocated to normatively oriented items increased as the items’ visual difficulty level increased, thus matching the Discrepancy Reduction model (Nelson & Narens, 1990; Thiede & Dunlosky, 1999), believed to be suitable for simple cognitive tasks, such as visual perception (Ackerman, 2014; Funke, 2010). Low visual difficulty items were quickly learned, while medium visual difficulty items took longer to learn, and high visual difficulty items took even longer. These findings imply that for normatively oriented sketches, as visual difficulty increased, learners took longer time to satisfy, sometimes mistakenly, their norm of learning.
The change in study-time allocation for un-normatively oriented items was perplexing: the steepest increase in study-time was for the low visual difficulty items, followed by a more moderate increase for the medium visual difficulty items, but still surpassing the almost unchanged study-time allocated to high visual difficulty items (see Figure 8 above). Although surprising, these findings can be explained within the Region of Proximal Learning framework (Metcalfe & Kornell, 2005), reserved for complex cognitive tasks (Ackerman, 2014). The increase in study-time allocation for un-normative low and medium visual difficulty sketches implies that, along with the increase in difficulty, respondents perceived their learning as efficient, and therefore invested additional time in comprehending the sketches. In contrast, study-time allocated for high visual difficulty un-normative sketches was shorter than for medium visual difficulty un-normative sketches. This implies that respondents persisted for a while in learning the high visual difficulty items, and then stopped, either because they believed, sometimes by mistake, that they succeeded to reach their learning norm, or because they were making no head with their learning, and were unwilling to invest additional time in vain (Ackerman, 2013).
Page 140
students' investment of study-time for normatively and un-normatively oriented high difficulty sketches was similar. This possible explanation is in line with the Diminishing Criterion Model (Ackerman, 2014), inferring that as study-time is prolonged, learners become increasingly willing to compromise and to provide responses having less confidence in their correctness. In other words, learners’ goals are not constant, but rather shift downwards with time (Ackerman, 2014).
Moreover, there seems to be very little difference in study-time allocated for un-normative sketches across different visual difficulty levels (see Figure 8). As there was no external time limit to CRVDT questionnaire, this finding is rather surprising, and may imply the existence of an upper limit to the time that learners are disposed to invest in comprehending a 2-D sketch. This finding is also in line with the Diminishing Criterion Model (Ackerman, 2014). Establishing the existence of such a time limit and the circumstances under which learners turn to visual misleading aspects of the sketch, call for further investigation.
6. CONCLUSIONS
Investigating study-time allocation has the potential to further guide and assist the quest of understanding visual difficulty, and to shed additional light on the issue of using prototypes in spatial geometry instruction.
Evidently, changing the sketches’ orientation from normative to un-normative, triggered a substantial change in the metacognitive mechanisms involved in decisions about study-time allocated to learning. These changes may indicate an increase in sketches’ cognitive complexity across all difficulty-levels: while perceiving spatial geometrical situations out of prototypical normatively oriented 2-D sketches involves simple cognitive processes, un-normatively oriented 2-D sketches turn spatial perception into a more complex cognitive task, involving additional mental processes to derive new information out of the given sketch. This implies that perceptual complexity is task dependent, and therefore perception cannot be regarded as one whole simple elementary task.
These preliminary findings may also have practical implications for spatial geometry instruction. Given that teachers' knowledge and beliefs about educational processes are closely connected to their classroom practices (Farrell & Bennis, 2013), it is of practical importance that teachers fully understand the mechanisms that lay behind study-time allocation, as a means of improving instruction and assessment.
ACKNOWLEDGMENTS
The professional guidance and support of Professor Boris Koichu, Weizmann Institute, Israel, is gratefully acknowledged.
REFERENCES
1. Ackerman, R & Goldsmith, M 2011, 'Metacognitive regulation of text learning: On screen versus on paper', Journal of Experimental Psychology: Applied, vol. 17, no. 1, pp. 18-32.
2. Ackerman, R 2013, 'A metacognitive stopping rule for problem solving', In M Knauff, M Pauen, N Sebanz, & I Wachsmuth (eds.), Proceedings of the 35th Annual Conference of the Cognitive Science Society, Austin, TX: Cognitive Science Society, pp. 121–126.
3. Ackerman, R 2014, 'The diminishing criterion model for metacognitive regulation of time investment', Journal of Experimental Psychology: General, vol. 143, no. 3, pp. 1349-1368.
Page 141
5. Christou, C, Pittalis, M, Mousoulides, N, & Jones, K 2005, 'Developing 3D dynamic geometry software: Theoretical perspectives on design', In F Olivero & R Sutherland, (eds.), Visions of mathematics education: Embedding technology in learning, Bristol, UK: University of Bristol, pp. 69-77.
6. Edelman, S & Bülthoff, HH 1992, 'Orientation dependence in the recognition of familiar and novel views of three-dimensional objects', Vision research, vol. 32, no.12, pp. 2385-2400.
7. Farrell, TS & Bennis, K 2013, 'Reflecting on ESL teacher beliefs and classroom practices: A case study', RELC Journal, vol. 44, no. 2, pp. 163-176.
8. Funke, J 2010, 'Complex problem solving: a case for complex cognition?', Cognitive processing, vol. 11, no. 2, pp. 133-142.
9. Gredler, ME 1999, 'Classroom assessment and learning', New York: Longman.
10. Gutiérrez, A 1996, 'Visualization in 3-dimensional geometry: In search of a framework, In L Puig, & A Gutiérrez (eds.), Proceedings of the 20th Conference of the International Group for the Psychology of Mathematics Education, Valencia: Universidad de Valencia, vol. 1, pp. 3-19.
11. Larios, OV 2003, 'Geometrical rigidity: An obstacle in using dynamic geometry software in a geometry course', Electronic Proceedings of the 3rd Conference of the European Society for Research in Mathematics Education.
12. Maracci, M 2001, 'The formulation of a conjecture: the role of drawings', In Heuvel-Panhuizen (ed.), Proceedings of the 25th Conference of the International Group for Psychology of Mathematics Education, Holland: Utrecht University, vol. 3, pp. 335-342.
13. Metcalfe, J & Kornell, N 2005, 'A region of proximal learning model of study time allocation', Journal of Memory and Language, vol. 25, pp. 463-477.
14. Nelson, TO & Narens, L 1990, 'Metamemory: A theoretical framework and new findings', In G Bower (ed.), The psychology of learning and motivation: Advances in research and theory, CA: Academic Press, San Diego, vol. 26, pp. 125–173.
15. Parzysz, B 1988, '‘Knowing’ vs. ‘seeing’: Problems of the plane representation of space geometry figures', Educational Studies in Mathematics, vol. 19, pp. 79-92.
16. Son, LK & Metcalfe, J 2000, 'Metacognitive and control strategies in study-time allocation', Journal of Experimental Psychology: Learning, Memory, and Cognition, vol. 26, pp. 204-221. doi: http://dx.doi.org.elib.openu.ac.il/10.1037/0278-7393.26.1.204
17. Son, LK & Kornell, N 2009, 'Simultaneous decisions at study: Time allocation, ordering, and spacing', Metacognition and Learning, vol. 4, no. 3, pp. 237-248.
18. Taraban, R, Maki, WS & Rynearson, K 1999, 'Measuring study-time distributions: Implications for designing computer-based courses', Behavior Research Methods, Instruments, & Computers, vol. 31, no. 2, pp. 263-269.
19. Thiede, KW & Dunlosky, J 1999, 'Toward a general model of self- regulated study: An analysis of selection of items for study and self- paced study time', Journal of Experimental Psychology: Learning, Memory, and Cognition, vol. 25, pp. 1024–1037.