fermentation
Review
Syngas Fermentation: A Microbial Conversion
Process of Gaseous Substrates to Various Products
John R. Phillips, Raymond L. Huhnke and Hasan K. Atiyeh *
Biosystems and Agricultural Engineering Department, Oklahoma State University, 214 Ag Hall, Stillwater, OK 74078, USA; [email protected] (J.R.P.); [email protected] (R.L.H.)
* Correspondence: [email protected]; Tel.: +1-405-744-8397; Fax: +1-405-744-6059
Received: 27 April 2017; Accepted: 12 June 2017; Published: 16 June 2017
Abstract:Biomass and other carbonaceous materials can be gasified to produce syngas with high concentrations of CO and H2. Feedstock materials include wood, dedicated energy crops, grain wastes, manufacturing or municipal wastes, natural gas, petroleum and chemical wastes, lignin, coal and tires. Syngas fermentation converts CO and H2to alcohols and organic acids and uses concepts applicable in fermentation of gas phase substrates. The growth of chemoautotrophic microbes produces a wide range of chemicals from the enzyme platform of native organisms. In this review paper, the Wood–Ljungdahl biochemical pathway used by chemoautotrophs is described including balanced reactions, reaction sites physically located within the cell and cell mechanisms for energy conservation that govern production. Important concepts discussed include gas solubility, mass transfer, thermodynamics of enzyme-catalyzed reactions, electrochemistry and cellular electron carriers and fermentation kinetics. Potential applications of these concepts include acid and alcohol production, hydrogen generation and conversion of methane to liquids or hydrogen.
Keywords:syngas fermentation; acetyl-CoA pathway; acetogen; biofuel; gasification
1. Introduction to Syngas Fermentation
Syngas fermentation is a hybrid thermochemical/biochemical platform that takes advantage of the simplicity of the gasification process and the specificity of the fermentation process to deliver ethanol and potentially other chemicals. Biomass is converted to ethanol through the thermochemical platform, i.e., gasification and the biological platform, i.e., fermentation in syngas fermentation [1]. Energy-rich biomass and waste materials are converted by gasification to syngas, which consists of CO, H2and CO2. These gases are then converted to ethanol and other chemicals by acetogenic autotrophic microbes [2]. These microorganisms, “possess a very valuable (trait)” have “the ability to grow in strict autotrophy” and “to produce added-value compounds” [3]. After twenty five years of syngas fermentation research for the production of ethanol, this application is now being deployed at a near commercial scale. However, “these studies have yet to define a methodology for generating high ethanol production levels with stable culture.” [4]. In this paper, we present a review of feedstocks, syngas production, metabolic pathway, bioreactor design, mass transfer, thermodynamics, electrochemistry and microbial kinetics of the syngas fermentation process and propose a conceptual model to describe the syngas fermentation.
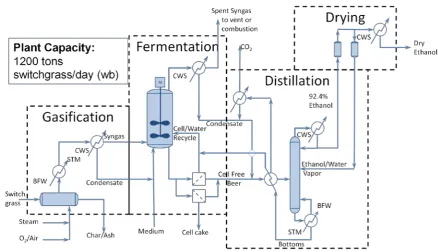
A process flow diagram for the conversion of switchgrass, a dedicated perennial energy crop, to ethanol is shown in Figure1. Switchgrass is first converted to syngas in gasification with O2and/or steam. CO and H2from the cooled syngas is utilized by the bacterial culture in fermentation for cell growth and product synthesis. Beer from the fermentation is then distilled to recover ethanol, and the bottom stream from distillation is returned to the fermentation. Recovered ethanol, taken from overhead of the distillation column, is processed using a molecular sieve to achieve the final product specification.
Fermentationoverhead of the distillation column, is processed using a molecular sieve to achieve the final 2017,3, 28 2 of 26
product specification.
Figure 1. Process flow diagram for the gasification of switchgrass followed by syngas fermentation to produce fuel ethanol; BFW: boiler feedwater system; STM: steam; Syngas: synthesis gas; CWS: circulating water system; wb: wet basis.
A key consideration in any fuel process is preserving the energy content of the feedstock in the final product. Energy is expended in each production step; after solid biomass is heated to a high temperature for the gasification step, energy is recovered from the syngas as steam, and heat is lost to the environment. Energy diverted to cell growth, heat lost from the fermenter, unconverted syngas and unrecovered acetic acid represent energy diverted from the ethanol product. The economy of the fermentation process is enhanced through improvements in efficiency that conserve energy and increase product yield. Energy efficiency represented by retaining the higher heating value from the products, through gasification [5] and as increased product yield from fermentation [6], and the use of energy efficient separation technologies, such as membrane separation, are very important to achieve a profitable commercial process for fuels or chemicals.
1.1. Energy Demand
World energy demand is expected to grow from 553 exajoules (1 EJ = 1018 J = 0.948 quadrillion BTU = 0.948 Quad) in 2012 to 865 EJ in 2040 per the U.S. Energy Information Administration’s International Energy Outlook for 2013 [7,8]. The world demand for transportation fuels is also projected to rise from 182 EJ in 2010 to 249 EJ in 2040 (from 182 to 229 trillionliters of petroleum). Consumption of liquid biofuels will increase from 2.78 EJ in 2010 (77.2 trillionliters of gasoline equivalent) to 6.21 EJ projected in 2040 (172.4 trillionliters gasoline equivalent).
1.2. Potential Resources
Balan [9] compiled an extensive list of projects for the development of lignocellulosic biofuels supported by the governments of the U.S. and the EU that have achieved a range of success. Syngas fermentation projects have advanced to commercial scale [10,11]. The accounting of biofuels by the EIA includes biomass-to-liquids (BTL) and biodiesel; while ethanol remains the most prominent liquid fuel from biomass. BTL also includes pyrolysis oil and Fischer–Tropsch liquids that share
Figure 1.Process flow diagram for the gasification of switchgrass followed by syngas fermentation to produce fuel ethanol; BFW: boiler feedwater system; STM: steam; Syngas: synthesis gas; CWS: circulating water system; wb: wet basis.
A key consideration in any fuel process is preserving the energy content of the feedstock in the final product. Energy is expended in each production step; after solid biomass is heated to a high temperature for the gasification step, energy is recovered from the syngas as steam, and heat is lost to the environment. Energy diverted to cell growth, heat lost from the fermenter, unconverted syngas and unrecovered acetic acid represent energy diverted from the ethanol product. The economy of the fermentation process is enhanced through improvements in efficiency that conserve energy and increase product yield. Energy efficiency represented by retaining the higher heating value from the products, through gasification [5] and as increased product yield from fermentation [6], and the use of energy efficient separation technologies, such as membrane separation, are very important to achieve a profitable commercial process for fuels or chemicals.
1.1. Energy Demand
World energy demand is expected to grow from 553 exajoules (1 EJ = 1018J = 0.948 quadrillion BTU = 0.948 Quad) in 2012 to 865 EJ in 2040 per the U.S. Energy Information Administration’s International Energy Outlook for 2013 [7,8]. The world demand for transportation fuels is also projected to rise from 182 EJ in 2010 to 249 EJ in 2040 (from 182 to 229 trillion liters of petroleum). Consumption of liquid biofuels will increase from 2.78 EJ in 2010 (77.2 trillion liters of gasoline equivalent) to 6.21 EJ projected in 2040 (172.4 trillion liters gasoline equivalent).
1.2. Potential Resources
Fermentation2017,3, 28 3 of 26
1.2.1. Biomass
The major portion of projected U.S. biofuels consumption of 1.84 EJ in 2012, rising to 2.34 EJ in 2040 [12], is from ethanol with consumption of 1.71 EJ in 2012 almost exclusively supplied from corn, rising to 1.99 EJ in 2040 with less than 1% projected to derive from cellulosic feedstock. These projections reflect lowered expectations due to slow progress in the technical and economic competence of cellulosic fuel production, coupled with the increased reserves for U.S. oil and gas production. However, global capacity to produce biomass for energy production is projected as 11 to 28 billion tonnes by 2050 [13], which represents 200 to 500 EJ annually.
1.2.2.Wastes
In addition to forest and agriculture wastes, municipal solids wastes (MSW) can be an energy resource. Combustible material discarded in the U.S. municipal waste stream is estimated at about 117 million tonnes [14] representing about 2 EJ potential for energy production with only small increase expected through 2030. Use of MSW combined with chemical and petroleum wastes in syngas production may be important as an environmentally-sound management practice. Paper mill wood wastes and black liquor can supply syngas for energy production [15]. These materials are a gathered resource with a negative value, incurring cost for disposal, and represent an opportunity for energy production with environmental benefit.
1.3. Syngas Production
Gasification of biomass to produce syngas provides the simple precursors CO and H2 for fermentation. Atsonios et al. [15] published a process flow diagram for similar production of syngas (followed by catalytic mixed alcohol synthesis). When gasification is coupled with fermentation of the syngas, the robustness and adaptability of the acetogenic bacteria reduce the requirements for gas cleaning and adjustment by the water gas shift reaction required for catalytic conversion of syngas.
Liew et al. [11] discussed a fixed-bed, a circulating fluidized bed (CFB) and entrained flow gasifiers, with preference for CFB for biomass and entrained flow for liquids and solids that are easily pulverized. For syngas fermentation, low pressure and high temperature in the gasification chamber promote CO and H2formation and reduce higher molecular weight hydrocarbons or “tar” in the syngas produced, and an atmospheric indirect heated CFB is preferred [5].
Biomass and waste materials contain nitrogen, sulfur, chlorine and other constituent elements, in addition to complex hydrocarbon structures, such as aromatics that decompose slowly in gasification. These compounds remain in the syngas product as N2and other minor components, such as ammonia (NH3), hydrogen sulfide (H2S) and tars [16,17]. Residual hydrocarbon tars can foul equipment surfaces and orifices and can be inhibitory in fermentation along with chemical species produced in combustion like hydrogen cyanide (HCN). Woolcock and Brown [18] presented an extensive review of syngas contaminants, gas specifications for particular applications and technologies used for gas cleanup. Some chemical species that poison chemical catalysts such as NH3, carbonyl sulfide (COS) and H2S can be used as nutrient components for the growth of the acetogenic bacteria when present at low levels. Fermentation uses syngas with a composition dependent on the type of gasifier used and its operating conditions. Fermentation can simplify the process flow diagram for syngas cleaning and emissions treatment, lowering capital requirements compared to catalytic processes, such as Fischer–Tropsch.
1.4. Microbial Conversion of CO and H2
easily acetic acid and ethanol. Production of acetic acid supplies energy for synthesis of cell mass, including lipids, proteins and other complex cell components from the simple inorganic gas substrates (CO, H2and CO2). The ability of some acetogens to reduce organic acids to alcohols, particularly acetic acid to ethanol, is the basis for biofuel production. Knowledge of the acetogenic mechanisms supports successful process design for energy conservation in biofuels’ production.
The use of dedicated biomass energy crops, waste biomass and municipal and industrial wastes as feedstock for energy and chemical synthesis promotes reuse and recycling of materials consumed in our society. This can establish a true cycle of renewable, carbon-neutral, energy and chemical production.
2. Chemoautotrophic Microbes
The bacteria used in syngas fermentation belong to a group of prokaryotic single cell organisms termed “acetogens”, which are defined by the use of the acetyl-CoA pathway for reductive synthesis of acetyl-CoA from CO2, energy conservation for growth and assimilation of carbon from CO and CO2 into biomass [2]. The cellular mechanisms of acetogenesis are present and used by bacteria, archaea and eukaryotes alike. Acetogens inhabit a wide range of ecosystems and have diverse capacities for substrate utilization and product formation, dependent on the growth environment.
Acetogenesis was recognized in 1932 when the production of acetic acid from H2and CO2by sewage sludge was reported [20]. Subsequently, Klass Wieringa [21] isolatedClostridium aceticum, demonstrating synthesis of acetic acid from H2/CO2 by this pure culture. The type culture for acetogenesis,Clostridium thermoaceticum, reclassified asMoorella thermoacetica[22], was isolated by Francis Fontaine [23]. Harland Wood and Lars Ljungdahl studied the acetyl-CoA pathway, providing the definition of the incorporation of CO and of the tetrahydrofolate (THF)-dependent reduction of CO2to a methyl group, in the formation of acetyl-CoA. The acetyl-CoA pathway is also referred to as the Wood–Ljungdahl pathway of autotrophic growth. A detailed description of the history of the discovery of acetogenesis is given in a review [2], and the enzymology is reviewed by Ragsdale [24].
2.1. Species and Habitat
Drake et al. [2] cited 100 species of acetogens, from 22 genera in his review. These acetogens were of various morphologies (rods, cocci and spirochetes) with a wide range of temperature optima from 5 to 62◦C. Acetogens were isolated from a wide variety of habitats including soil, sewage sludge, feces, rumen fluid, sediments and industrial wastes. The pH conditions ranged from alkaline to acidic, and most habitats were not strictly anoxic.
The first acetogen reported to produce ethanol from syngas wasClostridium ljungdahlii[25,26]. Shortly thereafter,Butyribacterium methylotrophicumwas reported to produce butanol and ethanol from CO [27]. Other prominent species of acetogenic alcohol producers areC. autoethanogenum[28], C. carboxidivorans, which has also been shown to synthesize butanol and hexanol [29,30], and C. ragsdalei[31]. New species continue to be discovered, including moderately alkaliphilic acetogens that produce ethanol; for example, Alkalibaculum bacchi represents yet another new genus and species [32,33].
Mixed culture syngas fermentations for the production of ethanol and acetic acid and conversion of organic acids to their respective alcohols were also reported [34,35]. Enrichment of acetogens in chicken manure in India [4] and cow manure in China [36] shows the potential of natural inocula. However,Clostridium difficile andC. sordellii, acetogenic human pathogens, were detected in the enriched fermentation [36], which suggests that extreme caution should be exercised in the selection and use of syngas fermenting microorganisms.
Fermentation2017,3, 28 5 of 26
effectively via the autotrophic pathways. Nutrients essential to the growth of functional cell mass are the object of competition between a consortium of bacteria and other organisms. Efficient mechanisms for nutrient uptake are required for the bacteria to thrive especially in the environment with very low nutrient concentrations. Isolation of acetogens typically uses a medium enriched with yeast extract with pH stabilized using a Good’s buffer, like 2-(N-morpholino)ethanesulfonic Acid (MES) [37]. Several studies have substituted other complex medium components for yeast extract; for example, corn steep liquor [38,39] or cotton seed extract [40]. A defined medium without complex nutrients was used withC. ljungdahliito achieve 48 g/L of ethanol [41].
Culture methods were modified to control mass transfer for successful growth ofC. carboxidivorans in defined medium and produce butanol and hexanol [30].
2.2. Structure
Acetogens are found as rods, cocci and spirochetes and can be either Gram-positive or Gram-negative [2]. The typical ethanol producing acetogen is a rod-shaped Gram-positive motile bacterium that can form spores. C. carboxidivorans, also known as strain P7, is described as “Gram-positive, motile rods (0.5×3µm) occurring singly and in pairs. Cells rarely sporulate, but spores are subterminal to terminal with slight cell swelling. Obligate anaerobe with an optimum growth temperature of 38◦C and an optimum pH of 6.2. Grows autotrophically with H2/CO2or CO and chemoorganotrophically” [29].
The cell membrane is a phospholipid bilayer embedded with proteins, which divides the cytoplasm from the external environment and mediates cell function [42]. Fifteen enzymes closely associated with the acetyl-CoA pathway [24] are listed in Table1.
Table 1.Enzymes of the acetyl-CoA (Wood–Ljungdahl) pathway.
Enzyme Reaction Reference
Carbon Monoxide dehydrogenase CO+H2O→CO2+2 H++2 e− [43]
Hydrogenase H2→2 H++2 e− [44]
Ferredoxin oxidoreductase FdRd→FdOx+2 e− [45]
Formate dehydrogenase CO2+NADPH→HCOO−+NADP+ [46]
Formate kinase HCOO−+ATP4−+H+→HCOOPO3−+ADP3− [47]
Formyl THF synthetase1 HCOOPO
3−+THF→HCOTHF+HPO42−+H+ [48]
Methenyl THF cyclohydrolase HCOTHF+H+→HC+THF+H2O [44]
Methylene THF dehydrogenase HC+THF+NADPH→H2CTHF+NADP+ [49]
Methylene THF reductase H2CTHF+2H++2e−→H3CTHF [50]
Methyl transferase H3CTHF+H++
Co+
E2+→THF+H3C
h
Co3+iE+ [44]
Corrinoid-Iron-Sulfur protein
Co+
E2+ [51]
Acetyl-CoA synthase H3C[Co3+]E++CO+CoASH→CH3COSCoA+
Co+
E2++H+ [24]
Phosphotransacetylase CH3COSCoA+HPO42−+H+→CH3COOHPO−3 +CoASH [52]
Acetate kinase CH3COOHPO−3 +ADP3−→CH3COO−+ATP4−+H+ [52]
Aldehyde dehydrogenase CH3COO−+NADPH+2H+→CH3CHO+NADP++H2O [53]
Alcohol dehydrogenase CH3CHO+NADPH+H+→CH3CH2OH+NADP+ [54]
1THF–tetrahydrofolate.
2.3. Pathway
Fermentation2017,3, 28 6 of 26
the form and availability of reactants. The simple inorganic chemical substrates, CO, H2and CO2, are transformed, step by step, first to acetyl-CoA and then to organic products, such as acetic acid and ethanol. Some acetyl-CoA is diverted to form complex organic cell components, carbohydrates, proteins and lipids. However, the majority of gas consumed provides energy for cell function, resulting in the accumulation of acetic acid and ethanol.
surface of the cell membrane or embedded in the membrane. Each cell acts independently, but the combined action of all cells sets conditions in the fermentation bulk liquid. Reactions inside cells are mediated by enzymes (Table 1); each binds specific reactants and converts them to specific products, and these enzymatic reactions are typically reversible. The reactions occur at local conditions of pH and chemical concentrations inside the cell, conditions that determine the activity of the enzymes and the form and availability of reactants. The simple inorganic chemical substrates, CO, H2 and CO2, are transformed, step by step, first to acetyl-CoA and then to organic products, such as acetic acid and ethanol. Some acetyl-CoA is diverted to form complex organic cell components, carbohydrates, proteins and lipids. However, the majority of gas consumed provides energy for cell function, resulting in the accumulation of acetic acid and ethanol.
Figure 2. The Wood–Ljungdahl pathway for the production of ethanol and acetic acid; THF: tetrahydrofolate; ACS: acetyl CoA synthase; CODH: carbon monoxide dehydrogenase; H2ase:
hydrogenase; NADPH: reduced nicotinamide adenine dinucleotide phosphate; adapted from [1,57].
2.3.1. Stoichiometry
The production of acetic acid and ethanol from syngas is represented in the literature by the stoichiometry for a single reductant, production from either CO or H2 with CO2 [2,25,55,58–60]. The pure component stoichiometry and associated Gibbs free energy, ΔG°, are given in Table 2, Equations (1) and (5) for the production of acetic acid and Equations (6) and (12) for the production of ethanol. The similar stoichiometry from CO and H2 to form products, 4 moles per mole of acetic acid and 6 moles per mole of ethanol, reinforce that CO and H2 both act as reductants, providing indistinguishable electrons for the subsequent production reactions. ΔG° provides an insight into the direction of a reaction and whether or not it is a spontaneous or not. A negative ΔG° for a reaction means it is spontaneous in the forward direction to make products. A positive ΔG° for a
Figure 2. The Wood–Ljungdahl pathway for the production of ethanol and acetic acid; THF: tetrahydrofolate; ACS: acetyl CoA synthase; CODH: carbon monoxide dehydrogenase; H2ase: hydrogenase; NADPH: reduced nicotinamide adenine dinucleotide phosphate; adapted from [1,57].
2.3.1. Stoichiometry
Fermentation2017,3, 28 7 of 26
more favorable thermodynamically. For example, ethanol production in Equation (6) from only CO is thermodynamically more favorable than in Equations (7) to (12) from both CO and H2or from both H2 and CO2. In addition, the higher the molar ratios of H2:CO, the greater the efficiency of incorporating carbon from CO into acetic acid or ethanol.
Table 2. Stoichiometry of acetic acid and ethanol production from syngas and change in Gibbs free energy at 298◦K and 100 kPa.
Products Reaction ∆G◦kJ/mol
Acetic Acid 4 CO+2 H2O →CH3COOH+2 CO2 (1) −154.6 3 CO+H2+H2O →CH3COOH+CO2 (2) −134.5
2 CO+2 H2→CH3COOH (3) −114.5
CO+3 H2+CO2 →CH3COOH+H2O (4) −94.4 4 H2+2 CO2 →CH3COOH+2 H2O (5) −74.3
Ethanol 6 CO+3 H2O →CH3CH2OH+4 CO2 (6) −217.4 5 CO+H2+2 H2O →CH3CH2OH+3 CO2 (7) −197.3 4 CO+2 H2+H2O →CH3CH2OH+2 CO2 (8) −177.3 3 CO+3 H2→CH3CH2OH+CO2 (9) −157.2 2 CO+4 H2→CH3CH2OH+H2O (10) −137.1 CO+5 H2+CO2 →CH3CH2OH+2 H2O (11) −117.1 6 H2+2 CO2 →CH3CH2OH+3 H2O (12) −97.0
Acetic Acid CO+CO2+6H++6e−→CH3COOH+H2O (13) −94.4 Ethanol CO+CO2+10H++10 e− →CH3CH2OH+2H2O (14) −117.1
Production can proceed using either CO or H2[55], but fermentation with syngas, containing CO, CO2 and H2, typically shows simultaneous uptake of both CO and H2[38,41]. Intermediate stoichiometry can be written beginning with production from pure CO and substituting one H2for one CO and reducing consumption of H2O and production of CO2by one for each step. In this way, five balanced equations are obtained showing the “quantum” or molecular production of acetic acid from any combination of four, CO plus H2, with two carbons fixed in acetic acid. Similarly, seven balanced equations are obtained showing the “quantum” production of ethanol from a combination of six, CO plus H2, with two carbons fixed in ethanol. The overall stoichiometry observed in fermentation will be the average of the “quantum” stoichiometry; for example, 4.3 moles CO plus 1.7 moles H2can produce 1 mole of ethanol.
The substitution of H2for CO as reductant in fixing two carbons in the product, either acetic acid or ethanol, suggests a general stoichiometry independent of the origin of electrons, whether from CO or H2. Reducing equivalents of H2(2 H++ 2 e−) are provided by either CO or H2, while carbon comes from CO and CO2. The methyl group of acetic acid is formed from CO2, and the carbonyl is formed from CO. The general stoichiometry of acetic acid formation is given in Equation (13) and the general stoichiometry of ethanol formation in Equation (14). Consumption of four reductants (including CO and H2) and two carbons (CO or CO2including the CO used as reductant) will produce acetic acid. Consuming six reductants per two carbons will produce ethanol. The energy, H+and e−are supplied by oxidation of CO or H2, and Equations (15) and (16) describe acetic acid and ethanol production.
CO+CO2+ (n CO+ (3−n)H2)→CH3COOH+n CO2+ (1−n)H2O
3≥n≥ −1 (15)
CO+CO2+ (n CO+ (5−n)H2)→CH3CH2OH+n CO2+ (2−n)H2O
5≥n≥ −1 (16)
quantum stoichiometry. However, on a molar level of reaction,nis not restricted to integer values, and Equations (15) and (16) represent the average stoichiometry.
2.3.2. Production Reactions
The acetyl-CoA pathway has been defined over 70 years of research [24,56] and is shown in Figure2. Energy and carbon from syngas are used to produce acetyl-CoA. CO2 is converted to a methyl group in the tetrahydrofolate cycle, through a series of reactions that consume one adenosine triphosphate (ATP) and three reducing equivalents of hydrogen (2 H++ 2 e−derived from CO or H2). Acetic acid can be released from the cell into the bulk liquid (by diffusion or facilitated diffusion) [61] or reduced through acetaldehyde to ethanol consuming another two reducing equivalents [62].
Carbon
Carbon enters the acetyl-CoA pathway reactions as CO2or CO. CO2is required for the formation of formate [46], which is bound to tetrahydrofolate and reduced to form the methyl group of acetyl-CoA. A methyl cation is transferred to acetyl-CoA synthase (ACS) via an enzyme that contains cobalt (and is called the corrinoid iron-sulfur protein or CoFeSP). The carbonyl of acetyl-CoA is derived from CO bound to carbon monoxide dehydrogenase (CODH), transferred within the bi-functional enzyme to the acetyl-CoA synthase (ACS) active site [63] and condensed with the methyl group and coenzyme A to form acetyl-CoA (Figure2). Acetyl-CoA is either incorporated in cell components or converted to acetic acid inside the cell, and the conversion of acetyl-CoA to acetic acid via acetyl-phosphate replaces the ATP used to convert CO2to the methyl cation.
Acetic acid is released by the acetate kinase enzyme to the cytoplasm (inside the cell) and is reduced to ethanol by carboxylic acid reductase [53] and alcohol dehydrogenase using reduced electron carriers like the reduced nicotinamide adenine dinucleotide (NADH) that are not strongly associated with the membrane. The enzymes acetaldehyde dehydrogenase and alcohol dehydrogenase, which are required to reduce acetic acid to ethanol, have been isolated fromMoorella thermoacetica (formerlyClostridium thermoaceticum) andClostridium formicoaceticum[53,54]. Based on commercial acetone-butanol-ethanol (ABE) fermentation, acyl-CoA (acetyl- or butyryl-CoA) is reduced to aldehyde and then to alcohol using low potential electron carriers, at the expense of one ATP. This loss of ATP in equimolar ratio to ethanol production would make ethanol production from syngas impossible. Fraisse [54] and White [53] found that acetic acid is converted directly to acetaldehyde; acetyl-CoA is not the direct precursor of acetaldehyde and ethanol; and ATP is not lost when alcohol is produced. Aldehyde dehydrogenase and alcohol dehydrogenase were also found to be functional for the reduction of other carboxylic acids to their respective alcohols, including reduction of butyric acid to butanol [30,53,64]. Ethanol production is affected by the internal electrochemical potential and internal pH of the cell, which are determined by the concentration of accumulated CO and H2.
Energy
During syngas fermentation, energy flows by the transfer of electrons. One pair of electrons (2 e−) is supplied for reaction in the cell by each CO oxidized on CODH or H2oxidized on hydrogenase (H2ase); a pair of protons (2 H+) is released to the cytoplasm for each oxidized CO [43] or H2[44]. The electrons are distributed to reaction sites within the cell by electron carriers like ferredoxin and NAD(P)H. Electrons from CODH and H2ase are first transferred to the membrane-associated clostridial ferredoxin [65] and then are transferred to other electron carriers like NAD(P)H for use in pathway reactions and other cell function. Electrons are transferred via enzymes and cofactors coded in the acetogenic genome in theRnf (forRhodobacternitrogen fixing) operon. TheRnf operon produces a membrane-bound protein complex that is critical to electron transfer and translocation of protons across the cell membrane [66–68].
Fermentation2017,3, 28 9 of 26
potential to NADH. This “bifurcation” is proposed to translocate protons across the cell membrane through theRnf complex proteins. However, electrons from H2are likely transferred via ferredoxin to theRnf complex, then distributed to NAD(P)H and membrane-integral flavins, equalizing the intracellular potential of all electron carriers. The reduced flavin nucleotides carry protons across the membrane, and the associated electrons, still near the potential of H2, reduce methylene-THF to methyl-THF in a critical reaction of the production pathway. To develop the bifurcation concept, Schuchmann and Muller [69] reported methylene-THF reductase to be neither membrane associated, nor membrane attached. However, Hugenholtz et al. [70] found this critical enzyme was membrane bound, but easily displaced by disruption of the cells for isolation of proteins. The cell membrane serves to insulate the low potential electrons transferred to the flavin and, thus, establish the proton gradient, membrane potential and the proton-motive force used to produce ATP for cell growth.
A single crossover integration in C. ljungdahlii was reported to block the production of “a membrane associated polyferredoxin accepting electrons from ferredoxin and transferring them to membrane domains of theRnf complex” [68]. Autotrophic growth on H2and CO2was blocked by this mutation, and the “proton gradient, membrane potential and protonmotive force collapsed”. The reduction of ferredoxin well above its midpoint potential (E◦0=−420 mV) by H2drives the function of theRnf complex, but the imposed mutation blocked the transfer of electrons from H2into theRnf complex circuit, and without a supply of energy, the chemical potential across the membrane was dissipated. Presumably, autotrophic growth of theC. ljungdahliimutant on CO would also have been blocked, although this was not reported by [68]. Insulation of the electron current by the cell membrane is critical to the function of theRnf electron transfer chain that transports H+across the membrane and terminates in reduction of methylene-THF to methyl-THF.
2.3.3. Key Oxidation/Reduction Reactions in the Acetyl-CoA Pathway
Electrochemical reactions involve the transfer of electrons and protons. Electrons are transferred from a reduced chemical as it is oxidized to a less reduced (or oxidized) chemical [42,71]. The reduced and oxidized forms of both the electron donor and electron acceptor are called the redox couple. The reaction releasing the oxidized form and electrons, from its reduced form, is called a “half-cell reaction”. Important half-cell reactions of the acetyl-CoA pathway are shown in Table3. Each half-cell reaction (and redox couple) has a mid-point potential (expressed in mV) at which the concentrations of the reduced and oxidized forms are equal. CO2/CO is a redox couple, and the CO2/CO half-cell can be paired with the H2half-cell; ferredoxin mediates this electron transfer in acetogens [45]. The combined half reactions comprise the water-gas shift reaction, Equation (17); CO and H2O are converted to H2 and CO2in this reversible reaction.
CO+H2O↔CO2+H2 (17)
The elementary reactions of the pathway are balanced for charge and conserve elemental species when written as in Figure 2. The chemical equations can be analyzed using pH and chemical concentrations at the enzymes to establish thermodynamic relationships. Several important reactions of the pathway are characterized by paired electrochemical half-cell reactions. The electrons are supplied by the hydrogen (H+/H
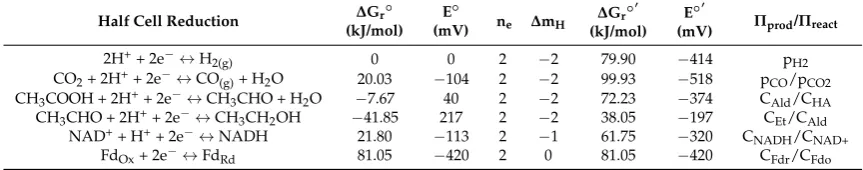
Table 3. Selected half-cell reactions of the acetyl-CoA pathway.∆Gr◦and E◦indicate the standard Gibbs free energy change and midpoint potential of the half-cell reaction at pH = 0, while∆Gr◦
0 and E◦0 are at pH = 7.0, neand∆mHare the numbers of electrons transferred and protons consumed, respectively, andΠprod/Πreactis the form of the mass action ratio.
Half Cell Reduction ∆Gr
◦
(kJ/mol) E◦
(mV) ne ∆mH
∆Gr◦
0
(kJ/mol) E◦0
(mV) Πprod/Πreact
2H++ 2e−↔H2(g) 0 0 2 −2 79.90 −414 pH2
CO2+ 2H++ 2e−↔CO(g)+ H2O 20.03 −104 2 −2 99.93 −518 pCO/pCO2
CH3COOH + 2H++ 2e−↔CH3CHO + H2O −7.67 40 2 −2 72.23 −374 CAld/CHA
CH3CHO + 2H++ 2e−↔CH3CH2OH −41.85 217 2 −2 38.05 −197 CEt/CAld
NAD++ H++ 2e−↔NADH 21.80 −113 2 −1 61.75 −320 C
NADH/CNAD+
FdOx+ 2e−↔FdRd 81.05 −420 2 0 81.05 −420 CFdr/CFdo
2.4. ATP and Cell Growth
Autotrophic growth and production are dependent on the transport of protons and electrons across the cell membrane to generate the proton-motive force that drives synthesis of ATP [72]. The proton-motive force consists of a pH differential plus a difference in electrochemical potential as shown in Equation (18) [42].
∆p=∆ϕ−2.3RT
F ∆pH (18)
where∆pis the proton-motive force (mV) driving transfer of protons across the membrane,∆ϕis the
potential difference across the membrane (mV),∆pH is the pH differential across the membrane, R is the gas constant (8.314 J/mol K), T is the temperature (K) and F is the Faraday constant (96.485 J/mV mol e−).
Protons released into the cytoplasm are consumed in the formation of acetyl-CoA, acetic acid and ethanol, maintaining the charge balance, while one pair of protons (2 H+) is expelled from the cell for each acetyl-CoA formed. This proton pair is carried across the membrane by a reduced flavin electron carrier, while the electrons are used in the reduction of methylene-THF to methyl-THF [49]. The removal of H+ from the interior of the cell develops a differential of pH and electrochemical potential across the membrane. Protons, as positively-charged particles, are attracted to the more negatively-charged interior of the cell and driven by the higher concentration of protons outside the cell [73]. This proton-motive force pulls protons through an ATP synthase, driving rotation in the ATPase structure that mechanically forms and releases ATP from three binding sites for ATP/ADP + Pi on the enzyme [74,75]. One ATP is consumed in converting formate to formyl phosphate, and one ATP is recovered in the conversion of acetyl phosphate to acetate. Product formation via the acetyl-CoA pathway yields no net ATP; in syngas fermentation, ATP is obtained only from the chemiosmotic mechanism of the ATP synthase [73,76].
3. Microbial Conversion of Gas Phase Substrates
FermentationFermentation 20172017,3, , 283, 28 11 of 2611 of 26
Figure 3. Depiction of an acetogenic bacterial cell showing the supply of CO and H2 into the cell and
efflux of CO2 by mass transfer, the reaction on enzymes dependent on nutrients taken from the
medium to support culture kinetics of growth and production and the thermodynamic determination of products in syngas fermentation.
3.1. Gas Solubility
CO and H2 are sparingly soluble in water, and their solubility depends on the partial pressure of the individual species according to Henry’s law. As an example, for CO:
𝐶𝐶𝐶𝐶𝐶𝐶=𝑦𝑦𝐶𝐶𝐶𝐶 𝑃𝑃𝑇𝑇/𝑝𝑝𝐶𝐶𝐶𝐶 (19) where CCO is the liquid phase concentration of CO,yCO is the gas phase mol fraction of CO, PT is the
total pressure and HCO is the Henry’s law constant for CO. The Henry’s law constants for CO, H2
and CO2 at 37 °C are given in Table 4. Saturated concentration of either CO or H2 in water under 100 kPa of pure gas is less than 10-3 mol/L. CO and H2 must be continuously replenished in the liquid medium to support active fermentation. The lowest concentrations of CO and H2 are inside the cell where the enzymes that catalyze oxidation reside. In contrast, CO2 is produced in fermentation that consumes CO, and in that case, CO2 is transferred from inside the cell through the liquid phase to the gas phase. The concentration of CO2 will be highest inside the cell.
Table 4. Henry’s law constants and diffusivities for gases in water at 37 °C a.
Gas
H (kPa L/mol) Di,W(m2/s)CO 121,561 2.50 × 10⁻⁹
H2 140,262 6.24 × 10⁻⁹
CO2 4240 2.69 × 10⁻⁹
O2 101,300 3.25 × 10⁻⁹
a Adapted from [77].
3.2. Transport Theory
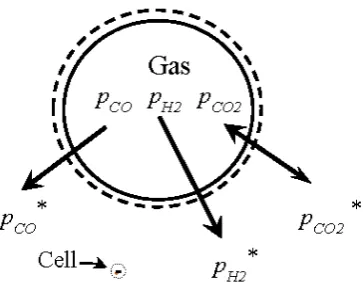
The low solubility of CO and H2, gases that provide the energy for syngas fermentation and energy conserved in ethanol product, requires these gases to be continually replenished in the fermentation broth to sustain production. The rate of mass transfer of substrate gas from the bulk gas through the gas-liquid interface and the bulk liquid into the cell, depicted in Figure 4, can be described by film theory [78].
CO
H
2CO2
Acetic Acid
Ethanol
Mass transfer of CO and H2into the cell limitsrate of production and poises thermodynamics.
Culture kinetics limits rate of substrate uptake, growth and production.
Thermodynamicssets ratio of products.
Nutrientsprovide components of catalyst enzymes.
Figure 3. Depiction of an acetogenic bacterial cell showing the supply of CO and H2into the cell and efflux of CO2by mass transfer, the reaction on enzymes dependent on nutrients taken from the medium to support culture kinetics of growth and production and the thermodynamic determination of products in syngas fermentation.
3.1. Gas Solubility
CO and H2are sparingly soluble in water, and their solubility depends on the partial pressure of the individual species according to Henry’s law. As an example, for CO:
CCO=yCOPT/HCO (19)
whereCCOis the liquid phase concentration of CO,yCOis the gas phase mol fraction of CO,PTis the total pressure andHCOis the Henry’s law constant for CO. The Henry’s law constants for CO, H2and CO2at 37◦C are given in Table4. Saturated concentration of either CO or H2in water under 100 kPa of pure gas is less than 10−3mol/L. CO and H2must be continuously replenished in the liquid medium to support active fermentation. The lowest concentrations of CO and H2are inside the cell where the enzymes that catalyze oxidation reside. In contrast, CO2is produced in fermentation that consumes CO, and in that case, CO2is transferred from inside the cell through the liquid phase to the gas phase. The concentration of CO2will be highest inside the cell.
Table 4.Henry’s law constants and diffusivities for gases in water at 37◦Ca.
Gas H(kPa L/mol) Di,W(m2/s)
CO 121,561 2.50×10⁻⁹
H2 140,262 6.24×10⁻⁹
CO2 4240 2.69×10⁻⁹
O2 101,300 3.25×10⁻⁹
aAdapted from [77].
3.2. Transport Theory
Figure 4. Schematic of gas to liquid mass transfer in the fermentation broth. Partial pressure in the gas phase, pCO, pH2, pCO2 and in the equilibrium bulk liquid phase pressure, pCO*, pH2*, pCO2*. The bubble
boundary is indicated by the solid line and the liquid film by the dashed line; a single cell is indicated inside the small circle; the scale of the bubble is 1 mm in diameter; the size of the cell is 0.5 μm in diameter by 3 μm long; there are more than 1010 cells per liter of fermentation broth.
Diffusion of gas components within the bulk gas is very fast relative to the consumption rate, and the concentration of each species is uniform throughout the gas phase. The concentration of each species in the liquid at the interface is at equilibrium with the bulk gas partial pressure as predicted by Henry’s law. The liquid at the interface is part of a stagnant film of fluid through which dissolved gas must transfer by diffusion to the bulk liquid, and since diffusion is driven by the concentration difference, the transfer rate is dependent on the gas diffusivity through water and the thickness of the stagnant film. Outside of the stagnant film, the liquid is assumed to be mobile and turbulent [79], and dissolved gas transfer within the bulk liquid is by bulk flow at rates far exceeding diffusion. The bulk liquid is assumed to be well mixed and homogeneous.
Gas is transferred into the cell by a diffusion process through the cell membrane, which is 6 to 9 nm thick [80]. C. ragsdalei cells are rod shaped with typical dimension of 0.5 μm by 3 μm, and even at low cell density (0.02 g cells/L), there are more than 101° cells/L of bulk liquid. The surface area of these cells will exceed the area of the gas-liquid interface by up to three orders of magnitude in a typical fermentation, and resistance to gas transfer across the membrane will be negligible. The gas to liquid mass transfer rate is controlled by diffusion through the film of stagnant liquid at the gas-liquid interface, and the rate of molar gas transfer is proportional to the difference in concentration from the surface of the liquid to the bulk liquid.
The partial pressure of each component in the gas phase is the product of its mole fraction and the total pressure. The partial pressure for CO is calculated by Equation (20).
𝑝𝑝𝐶𝐶𝐶𝐶= 𝑦𝑦𝐶𝐶𝐶𝐶𝑃𝑃𝑇𝑇 (20)
The liquid film mass transfer of CO is represented by Equation (21).
−𝑉𝑉1
𝐿𝐿
𝑑𝑑𝑛𝑛𝐶𝐶𝐶𝐶
𝑑𝑑𝑑𝑑 = 𝑘𝑘𝐿𝐿,CO𝑎𝑎
𝑉𝑉𝐿𝐿 �𝑐𝑐𝐶𝐶𝐶𝐶 ∗ − 𝑐𝑐
𝐶𝐶𝐶𝐶,𝐿𝐿�=
�𝑘𝑘𝐿𝐿𝑉𝑉,CO𝑎𝑎
𝐿𝐿 �
𝑝𝑝𝐶𝐶𝐶𝐶 (𝑝𝑝𝐶𝐶𝐶𝐶− 𝑝𝑝𝐶𝐶𝐶𝐶
∗ ) (21)
where c*CO is the concentration of CO at the gas-liquid interface in equilibrium by Henry’s law; cCO,L is the concentration of CO in the bulk liquid; pCO* is the CO partial pressure (kPa) in equilibrium by Henry’s law with the concentration of CO dissolved in the bulk liquid; pCO is partial pressure in the gas bubble; HCOis the Henry’s law constant for CO (kPa L/mol); and VL is the volume (L) of liquid
into which gas is transferred. The molar rate of CO transfer is –dnCO/dt (mol CO/h), where the negative sign denotes consumption from nCO moles of CO in the bulk gas. The constant of
proportionality is kL,CO a/VL, which is the overall liquid film mass transfer coefficient (often denoted simply as kLa in the literature) for CO with units of reciprocal time (h−1). The area of the gas/liquid interfaceis a (m2). The term kL,CO is the liquid film mass transfer coefficient for CO (L/m2 h), which includes the effects of turbulence in the liquid, hydrodynamic conditions like viscosity that affect
Figure 4.Schematic of gas to liquid mass transfer in the fermentation broth. Partial pressure in the gas phase,pCO,pH2,pCO2and in the equilibrium bulk liquid phase pressure,pCO*,pH2*,pCO2*. The bubble boundary is indicated by the solid line and the liquid film by the dashed line; a single cell is indicated inside the small circle; the scale of the bubble is 1 mm in diameter; the size of the cell is 0.5µm in diameter by 3µm long; there are more than 1010cells per liter of fermentation broth.
Diffusion of gas components within the bulk gas is very fast relative to the consumption rate, and the concentration of each species is uniform throughout the gas phase. The concentration of each species in the liquid at the interface is at equilibrium with the bulk gas partial pressure as predicted by Henry’s law. The liquid at the interface is part of a stagnant film of fluid through which dissolved gas must transfer by diffusion to the bulk liquid, and since diffusion is driven by the concentration difference, the transfer rate is dependent on the gas diffusivity through water and the thickness of the stagnant film. Outside of the stagnant film, the liquid is assumed to be mobile and turbulent [79], and dissolved gas transfer within the bulk liquid is by bulk flow at rates far exceeding diffusion. The bulk liquid is assumed to be well mixed and homogeneous.
Gas is transferred into the cell by a diffusion process through the cell membrane, which is 6 to 9 nm thick [80].C. ragsdaleicells are rod shaped with typical dimension of 0.5µm by 3µm, and even at low cell density (0.02 g cells/L), there are more than 1010cells/L of bulk liquid. The surface area of these cells will exceed the area of the gas-liquid interface by up to three orders of magnitude in a typical fermentation, and resistance to gas transfer across the membrane will be negligible. The gas to liquid mass transfer rate is controlled by diffusion through the film of stagnant liquid at the gas-liquid interface, and the rate of molar gas transfer is proportional to the difference in concentration from the surface of the liquid to the bulk liquid.
The partial pressure of each component in the gas phase is the product of its mole fraction and the total pressure. The partial pressure for CO is calculated by Equation (20).
pCO=yCOPT (20)
The liquid film mass transfer of CO is represented by Equation (21).
− 1
VL dnCO
dt = kL,COa
VL
(c∗CO−cCO,L) = k
L,COa VL
HCO
(pCO−p∗CO) (21)
Fermentation2017,3, 28 13 of 26
kL,COa/VL, which is the overall liquid film mass transfer coefficient (often denoted simply askLain the literature) for CO with units of reciprocal time (h−1). The area of the gas/liquid interface isa(m2). The termkL,COis the liquid film mass transfer coefficient for CO (L/m2h), which includes the effects of turbulence in the liquid, hydrodynamic conditions like viscosity that affect film thickness and gas diffusivity in the aqueous phase. When CO is mass transfer limited,pCO*is arithmetically zero, and kL,COa/VLcan be calculated fromdnCO/dtandpCOusing Equation (21).
The volumetric mass transfer coefficients for H2(kL,H2a/VL) and CO2(kL,CO2a/VL) differ from kL,COa/VL, but are proportional. The area of the gas/liquid interface and the liquid volume are the same for all gases, as is the intensity of turbulence in the liquid. The coefficients for these gases will differ due to their diffusivity in the fermentation broth (Di,W) through the liquid film, and the measured kL,COa/VL from Equation (21) is used to predict values ofkL,H2a/VL andkL,CO2a/VL based on the surface renewal theory for film transfer [81].
kL,COa VL
= s
DCO,W DH2,W
kL,H2a VL
=
s
DCO,W DCO2,W
kL,CO2a VL
(22)
The actual capacity of the fermenter to transfer H2and CO2is represented inkL,H2a/VL and kL,CO2a/VLdetermined from Equation (22). This capacity can remain unused, in which case H2or CO2 will accumulate in the bulk liquid and in the cell up to saturation of the dissolved gas. The fermentation broth was assumed to be like water, which is 98% of the medium.
The attainment of higher mass transfer represented in the volumetric mass transfer coefficients, kL,COa/VLandkL,H2a/VL, is of primary concern in most discussion of syngas fermentation [82–84]. A model of syngas fermentation in the continuously-stirred tank reactor (CSTR) was developed to assess the potential for the production of acetate [85], and mass transfer has been studied in various configurations of fermenters [82,83,86,87]. Klasson et al. [83], however, notes that the rate of mass transfer will not exceed the rate of reaction of the slightly soluble substrates and that the applied mass transfer should balance the supply and consumption of CO and H2.
3.3. Enzyme Catalyzed Reactions
Conversion of CO and H2to acetic acid, ethanol and cell mass is performed on a platform of enzymes contained in the cells (Figure3and Table1). The cell membrane separates the cytoplasm from the bulk liquid fermentation broth, and enzymes are either suspended in the cytoplasm or associated with or embedded in the membrane. Intracellular conditions of pH, oxidation reduction potential (ORP) and chemical composition are related to the bulk liquid by diffusion and membrane transport and can differ in significant ways that are essential to cell function [42,88]. The concentrations of dissolved CO, H2 and CO2 inside the cells are nearly the same (within 5%) as the bulk liquid, since the transfer of gas into the cells occurs along a short mass transfer path through a very thin membrane (6 to 9 nm) with a large total surface area. The observed rates of consumption of gas and the formation of products in the defined stoichiometry of the production pathway reveal the mass flux of carbon, protons and electrons through the pathway reactions. However, in analogy to the catalytic conversion of syngas to ethanol, production is, “impacted by kinetic and thermodynamic constraints.” as previously reported [15]. The dissolved gas concentrations set the thermodynamics of reactions, set the concentrations of intermediate metabolites and determine the kinetic rates. Fermentation occurs in this intracellular environment, and the mass flux through the biological pathways can be quantified and controlled to achieve targeted results on the macroscopic scale.
3.4. Thermodynamics
delayed uptake of H2in syngas fermentation. These thermodynamic calculations assumed bulk liquid concentration saturated from the gas phase partial pressures of H2, CO and CO2. While acetogenic fermentation of gas containing both CO and H2can exhibit periods of exclusive CO uptake, CO and H2are typically consumed together [41], and the concentrations of dissolved CO and H2are changed significantly to effect mass transfer.
The ordered chemical reactions in the acetyl-CoA pathway occur in sequence to produce acetyl-CoA, acetic acid and ethanol from CO2, CO and H2. Each reaction is mediated by an enzyme that catalyzes the reaction, and each reaction proceeds in the direction of favored thermodynamics, for which∆Gr< 0. The thermodynamics of biological reactions are addressed in biochemistry texts [88,90] and reviews [66,71]; these treatments discuss the criteria for a reaction to proceed,∆Gr< 0, and for thermodynamic equilibrium,∆Gr= 0, and the dependence of∆Gron concentration of reactants and products through the mass action ratio [88]. The effect of pH on∆Gis not discussed extensively, although Lehninger (1982) stated, “Biochemical reactions take place near pH 7.0 and often involve H+” to introduce the standard free energy at pH 7.0,∆Gr◦
0
. The dependence of∆Gron pH and the application in redox reactions in the cell are discussed in Cramer and Knaff [42]. Thermodynamic Cramer and Knaff data for reactions and compounds of interest in biological systems are available in the appendix of Thauer et al. [71], and these data can be used to define the thermodynamic position of the reactions of the acetyl-CoA pathway. Cramer and Knaff [42] emphasized the division of the intracellular space, where the enzymes reside, from the bulk liquid in fermentation. The production reactions occur inside the cell, while measurements like pH and ORP are taken in the bulk liquid. Fermentation thermodynamics are characterized by parameters that cannot be measured directly, and such parameters must then be inferred by calculation from available measurements. These calculations require assumptions informed by the biochemical mechanisms to build the equations for data analysis and a predictive model of fermentation.
3.5. Electrochemistry
Many reactions in the acetyl-CoA pathway are oxidation-reduction reactions, in which electrons are transferred from one molecule to another. Electron donors are oxidized, and the electron acceptors are reduced. In the water-gas shift reaction in Equation (17), CO is oxidized to CO2, and H+is reduced to H2. The two half-reactions are shown in Equations (23) and (24).
CO+H2O↔CO2+2 H++2 e− (23)
2 H++2 e− ↔H2 (24)
CO donates 2 e− that are used to produce H2. The water-gas shift reaction is reversible, and H2can be oxidized to produce CO from CO2. Reaction proceeds in the direction for which∆Gr< 0. The reaction is in equilibrium when∆Gr= 0.
The oxidized and reduced forms of a chemical comprise a redox couple, for example H2/H+and CO/CO2. The oxidized form accepts electrons (and sometimes H+) and becomes reduced. When the half-reaction is set at the standard conditions of 1.0 mol/L reactants and products, the redox couple exhibits a characteristic tendency or potential to donate electrons. This potential, measured in volts, with equal concentrations of the oxidized and reduced forms, is the midpoint potential. This is referred to as E◦at pH 0. E◦for a half-cell reaction can be calculated from∆Gr◦as in Equation (25) [71,88].
E◦=−∆Gro/neF (25)
Fermentation2017,3, 28 15 of 26
the electrochemical potential of the half-cell changes, as well. The potential (E) is given by the Nernst equation [80,88].
E=−∆Gr
neF
=Eo− RT
neF
ln
∏
C(Products)/∏
C(Reactants)+2.302RT neF∆mHpH (26)
The notation (ΠCProducts/ΠCReactants) represents the mass action ratio for the reaction [88], and
∆mHis the number of protons produced in the reaction.Eis the potential of the redox couple to donate electrons under the actual conditions, and each redox couple exhibits its characteristic potential under those conditions. A redox couple at lower potential (more negative) donates electrons (is oxidized) to couples at higher potential. Two half-cell reactions like Equations (23) and (24) are combined, an oxidation with a reduction, in a balanced reaction, as shown in the water-gas shift reaction in Equation (17). When the reaction reaches equilibrium,∆Gr= 0, and both redox couples are at the same potentialE. The degree of reduction of each couple is reflected in the mass action ratio that givesEfor the half-cell in Equation (26).
3.6. Electron Carriers
Bar-Even [91] asks, “Does acetogenesis require especially low reduction potential?” and applies similar thermodynamic analysis under the bifurcation concept. Bar-Even acknowledges lower concentrations of reactants in syngas fermentation reactions, but does not recognize the very low dissolved gas concentrations (particularly for CO) that produce mass transfer driving force in syngas fermentation. When mass transfer is rate limiting, the transfer of gas to the cell is the slowest process in the fermentation, and all reaction steps in the production pathway are fast relative to the rate of gas supply. Under mass transfer limitation, the reactions of the production pathway approach thermodynamic equilibrium, and all electrochemical half-cell reactions inside the cell approach the same potential, ECell. The assumption of thermodynamic equilibrium at one intracellular potential sets a boundary condition that defines the thermodynamic state of the pathway reactions. The approach to this assumed thermodynamic reaction state provides a convenient method to describe the reaction set for study and modeling of syngas fermentation.
The potential of the oxidation-reduction reactions of the pathway can be estimated by Equation (26) usingE◦calculated from Equation (25). Then, Equation (26) can be rearranged to calculate the mass action ratio as in Equation (27).
∏
C(Products)/∏
C(Reactants)=exp−∆G
o r RT −
neFE
RT + 2.302∆mHpH
(27)
Mass action ratios for selected half-cell reactions from the Wood–Ljungdahl pathway are presented in Table3. Note that the ratios of products to reactants are the ratios of concentrations or partial pressures, except for the partial pressure of H2. The half-cells are typically two electron reductions, ne= 2, and that most reductions consume two protons,∆mH=−2, except NADH/NAD+and Fdr/Fdo consume one proton and no protons, respectively. The values of∆G◦0and E◦0given in Table3are calculated at pH 7.0 and match values given by Thauer et al. [71].
3.7. Kinetics
Thermodynamics control the direction and possible extent of the reactions in the production pathway, while kinetics describes the rates of reactions and the overall rates of CO and H2consumption, acetic acid and ethanol accumulation, as well as cell growth. The overall rates are expected to be proportional to cell mass (XVL) in the fermenter, with the coefficient of proportionality being the specific growth rate (µ) for growth and the specific uptake rate (qCOfor CO andqH2for H2). Individual reaction rates are related to the concentrations of the reactants and products using a kinetic model, such as Michaelis–Menten for enzyme-mediated reactions [92]. The specific growth and specific uptake rates are likewise correlated to the concentration of substrates, like CO and H2inside the cell, in a kinetic model, such as the Monod equation [92,93]. The concentrations of substrates and products that are important in syngas fermentation are the CO, H2, CO2, acetic acid and ethanol dissolved in the bulk liquid. These concentrations are likewise thermodynamic quantities that can be measured or predicted. The dissolved CO, H2and CO2are represented by the dissolved partial pressures,pCO*,pH2*andpCO2*, and these can be calculated from mass transfer analysis of the experimentally-observed uptake.
Description of fermentation kinetics incorporates time differentials of measured parameters that describe the cell culture. The specific growth rate is the production of cell mass per unit of cell mass per time, gx/gxh or in h−1, and calculated as:
µ= 1
X dX
dt (28)
whereXis the cell mass concentration, in g/L. The specific uptake of CO (qCO) or H2(qH2) is the consumption of the gas per unit cell mass per time, mol/gx·h, which is estimated as:
qCO= 1 XVL
dnCO
dt (29)
qH2= 1 XVL
dnH2
dt (30)
qCO+H2= 1 XVL
dnCO+H2
dt (31)
Syngas fermentation by autotrophic acetogens produces complex chemicals including proteins, sugars, nucleic acids and lipids from CO and H2. This progression from small to complex must occur through a reversal of reactions typical in sugar fermentation; acetyl-CoA to pyruvate to retrace the glycolytic pathways and branches that produce amino acids [94]. Most reactions of the autotrophic pathway operate near thermodynamic equilibrium. Reaction rates depend on the dissolved concentrations of CO, H2and CO2, and prominent redox reactions used in the pathway dispose syngas fermentation to inhibitions and competition of substrates for enzyme binding sites. Moreover, the production reactions are reversible, and the production rate depends on product concentrations. An effective model of syngas fermentation should include the prediction of reaction rates using the same intracellular potential, pH and concentrations of CO, H2and CO2that define the thermodynamics.
3.8. Conceptual Model of Fermentation
Fermentation2017,3, 28 17 of 26
shift have been extensively investigated, especially in acetone–butanol–ethanol (ABE) fermenting clostridia.” However, “little is known about the regulatory circuits and molecular mechanisms for the transition to the solventogenesis”. It is appropriate that the study of syngas fermentation might lend knowledge to better understand the ABE fermentation.
Syngas fermentation has been modeled by correlating cell growth and productivity with the partial pressure of CO in the gas phase [58,98]. However, the isolated focus on the CO concentration in the supply gas ignores both the presence of H2and CO2 in the fermentation reactions and the difference in concentration imposed by the transfer of each gas into the liquid phase. Growth of C. ljungdahliion H2/CO2shows H2to be a competent source of energy for growth and production in syngas fermentation [55]. The requirement for CO2as carbon entering the methyl branch of the acetyl-CoA pathway in Figure2shows the importance of the CO2concentration in the production of acetyl-CoA and subsequent synthesis of acetic acid, ethanol and cell mass. Further, CO and H2are used together in syngas fermentation, and both provide electrons to the fermentation reactions [41]. A single parameter model of syngas fermentation using CO partial pressure in the bulk gas is not adequate. Chen et al. [93] prepared an ambitious model to describe syngas fermentation through the space of a bubble column fermenter. However, appropriate data to populate the model constants were lacking. The model does not apply the chemical engineering unit operations with appropriate assumptions to derive rigorous thermodynamic and kinetic parameters for the equations. The model utility can be improved by applying these engineering techniques.
We propose a new conceptual model of syngas fermentation that includes the growth of acetogens with concurrent ethanol production and high conversion of CO and H2, reduced dissolved concentration of sparingly soluble CO and H2resulting from high rate of gas transfer to the intracellular enzymes, less inhibition of the hydrogenase enzyme at very low dissolved concentration of CO and de facto mass transfer limitation for CO in active syngas fermentation. Further, concurrent uptake of CO and H2with electron flow from both species to reduce ferredoxin establishes the thermodynamic equilibrium of the water-gas shift within the cell, and the reduction of acetic acid to ethanol in redox reactions, coupled to oxidation of CO and H2via cellular electron carriers, suggests a single intracellular redox potential (ECell) and pH (pHic). The redox reactions of the acetyl-CoA pathway shown in Figure2 operate near thermodynamic equilibrium atECellandpHic. A mathematical model constructed with equations conforming to this novel conceptual model describes observed fermentation behaviors and has proven useful in fermentation analysis and control [99].
3.9. Reactor Design
Fermenter equipment can be designed using computer simulation models to meet the requirements for commercial fermentation. Syngas fermentation should be performed with continuous feed of syngas and liquid medium and removal of product for uninterrupted production. Continuous operation must provide high conservation of energy from the syngas into ethanol, a high concentration of ethanol and stable operation without shutdown over long periods. High energy conservation is only achieved through high conversion of both CO and H2, as well as high specificity for ethanol as the exclusive product. High concentrations of CO and H2promote a high ethanol concentration relative to acetic acid. Stable operation that maintains a steady state marked by high activity of the bacterial culture for CO and H2uptake is promoted by tight process control and equipment designed for mechanical reliability, redundancy and ease of maintenance.
The typical laboratory CSTR operates with plug flow characteristic for gas conversion, but achieves a single aggregate state of the fermentation parameters in the well-mixed liquid. Since the liquid parameters define the thermodynamics and kinetics of the fermentation, all goals of syngas fermentation cannot be achieved in a single CSTR stage. The laboratory CSTR fermenter is essential in defining the parameters of successful syngas fermentation, but efficient and economical commercial syngas fermentation for biofuel production can be realized in carefully-designed packed column fermenters that provide multistage gas contact during fermentation. Rich syngas contact with high liquid volume at the column bottom will promote reduction of acid to alcohol; partially converted syngas will promote culture growth with low inhibition in the middle; and high mass transfer could convert residual CO and H2before the spent gas exits the column at the top. These characteristics ensure product specificity, productivity and efficient energy conservation, which are all essential to process economy.
4. Potential Products
Growth of acetogens in syngas fermentation using a mineral-defined medium shows production of complex cell components from single carbon substrates, CO and CO2, with energy derived from CO and H2[30]. This implies a reversal of glycolytic pathways to form pyruvate and then sugars that compose the membranes from the syngas components. Energy from ATP and reduced electron carriers sufficient to supply fermentation reactions that branch from the glycolytic pathway to form amino acids, nucleic acids and lipids is available in syngas fermentation through the chemiosmotic mechanisms that drive the membrane-bound ATPase and electron transfers. The accumulation of butyric acid, hexanoic acid, butanol and hexanol has been demonstrated forC. carboxidivorans[30], and a broad range of potential products awaits techniques developed to enhance accumulation.
Ethanol and acetic acid are products derived directly from acetyl-CoA without the expense of ATP. Ethanol that can be recovered by distillation is the most prominent product. Acetic acid requires more elaborate recovery, such as extraction, but is a high volume chemical and potentially could be produced by oxidation of ethanol. Ethylene, globally one of the highest selling chemicals, could be formed by dehydration of ethanol [104].
An additional ATP is expended by the cells to condense two acetyl-CoA to butyryl-CoA, which is converted to butyric acid and then to butanol in steps similar to ethanol production. Butanol is sought as a “drop-in” biofuel for use in existing petroleum infrastructure, as a solvent and as precursor for subsequent synthesis. Propionic acid, propanol, hexanoic acid, hexanol, acetone, isobutanol, butanediol, amino and fatty acids are other potential products proposed from syngas fermentation [34,35,105–107]. A biological water-gas shift is proposed to produce H2[108], and syngas can be biologically converted to methane [109] so that syngas energy and subsequent products might be obtained from biological conversion of natural gas.
5. Techno-Economic Analysis
Fermentation2017,3, 28 19 of 26
in 2007 to 101 billion liters in 2016 [111]. These statistics show huge demand for ethanol worldwide. Ethanol produced globally is mostly made from grains and sugar cane. Corn ethanol and gasoline prices in the United States in April 2017 are about $0.43 per liter and $0.44 per liter, respectively [112]. Current corn ethanol prices are similar to prices reported in 1982 (Figure5). However, current gasoline price is about 60% higher than in 1982. For lignocellulosic ethanol to compete in the fuel market, its selling price should be comparable to corn ethanol prices on an energy basis.Fermentation 2017, 3, 28 19 of 26
Figure 5. Historical prices of corn ethanol and gasoline in the United States [113].
Lignocellulosic biofuel producers experience delayed plans for commercialization due to difficulty in technology scale-up and securing financing with low petroleum and natural gas costs. Technological and economic challenges in commercialization of lignocellulosic biofuels must be solved to address increased world energy demand, concerns of climate change and to build a sustainable biofuel industry.
Techno-economic analysis (TEA) provides assessments of cost-competitiveness and market penetration potential of alternative biofuel production technologies to researchers, engineers, investors and policy makers [114]. TEA can also facilitate sensitivity analyses of key process parameters to improve feasibility and provide future directions for biofuels research. TEAs are typically based on process and plant design assumptions including experimentally-derived or assumed parameters to estimate process performance, biofuel cost and yield and capital and operating costs. The results obtained from TEA are strongly dependent on the models used and the assumptions made.
Several studies report TEA for the conversion of lignocellulosic biomass to ethanol using the enzymatic hydrolysis fermentation (EHF) process [115–118] and the gasification-mixed alcohol catalytic conversion (GMA) platform [5,119]. However, few studies were found on TEA for ethanol production through the hybrid gasification-syngas fermentation (GF) process [117,120]. TEAs of various thermochemical technologies for cellulosic biofuels have been recently reviewed [121].
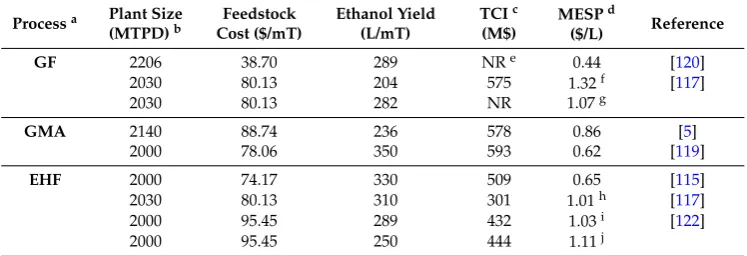
Spath and Dayton [120] reported a minimum ethanol selling price (MESP) of $0.44/L for the GF process of 2206 metric tonnes per day (MTPD) with a feedstock cost of $38.70 per metric tonnes (mT), as shown in Table 5. Piccolo and Bezzo [117] estimated that the cost of ethanol production via GF was about 30% higher than for EHF with an assumption of ethanol concentration in the fermentation beer three-fold higher in EHF. The higher ethanol cost using the GF process was due to additional cost for energy required in the distillation of beer containing 24 g/L ethanol compared to 70 g/L ethanol in EHF. The MESP for EHF was 5% lower than for GF when ethanol concentration in the beer in the GF was assumed to be 50 g/L due to higher ethanol yield with the EHF process [117]. However, MESP for EHF with ammonia fiber explosion pretreatment [122] was 4% higher than for GF with 50 g/L ethanol [117]. For the GF process, the cost of biomass feedstock, ethanol concentration and ethanol yield were identified as the main contributors to the MESP.
Typically, total capital investment (TCI) of the GF process is higher than the EHF process due to the additional cost of the gasification system (Table 5). However, the GF process has the potential to achieve high ethanol yields (440 L/Mg) compared to 340 L/Mg for the EHF process [123]. This is due to utilization of all components of the biomass, including lignin during gasification to produce
0.00 0.20 0.40 0.60 0.80 1.00
US
do
llar
s per
lit
er
Ethanol US$ / L
Gasoline US$ / L
Figure 5.Historical prices of corn ethanol and gasoline in the United States [113].
Lignocellulosic biofuel producers experience delayed plans for commercialization due to difficulty in technology scale-up and securing financing with low petroleum and natural gas costs. Technological and economic challenges in commercialization of lignocellulosic biofuels must be solved to address increased world energy demand, concerns of climate change and to build a sustainable biofuel industry.
Techno-economic analysis (TEA) provides assessments of cost-competitiveness and market penetration potential of alternative biofuel production technologies to researchers, engineers, investors and policy makers [114]. TEA can also facilitate sensitivity analyses of key process parameters to improve feasibility and provide future directions for biofuels research. TEAs are typically based on process and plant design assumptions including experimentally-derived or assumed parameters to estimate process performance, biofuel cost and yield and capital and operating costs. The results obtained from TEA are strongly dependent on the models used and the assumptions made.
Several studies report TEA for the conversion of lignocellulosic biomass to ethanol using the enzymatic hydrolysis fermentation (EHF) process [115–118] and the gasification-mixed alcohol catalytic conversion (GMA) platform [5,119]. However, few studies were found on TEA for ethanol production through the hybrid gasification-syngas fermentation (GF) process [117,120]. TEAs of various thermochemical technologies for cellulosic biofuels have been recently reviewed [121].
for EHF with ammonia fiber explosion pretreatment [122] was 4% higher than for GF with 50 g/L ethanol [117]. For the GF process, the cost of biomass feedstock, ethanol concentration and ethanol yield were identified as the main contributors to the MESP.
Typically, total capital investment (TCI) of the GF process is higher than the EHF process due to the additional cost of the gasification system (Table5). However, the GF process has the potential to achieve high ethanol yields (440 L/Mg) compared to 340 L/Mg for the EHF process [123]. This is due to utilization of all components of the biomass, including lignin during gasification to produce syngas converted into ethanol. The type of gasifier used in thermochemical conversion technologies and pretreatment methods in the biochemical conversion platform greatly affect the production cost of biofuel [118,122].
Table 5.Techno-economic analysis (TEA) of GF, GMA and EHF processes; all values in 2015 dollars.
Processa Plant Size
(MTPD)b Cost ($/mT)Feedstock Ethanol Yield(L/mT) TCI c
(M$)
MESPd
($/L) Reference
GF 2206 38.70 289 NRe 0.44 [120]
2030 80.13 204 575 1.32f [117]
2030 80.13 282 NR 1.07g
GMA 2140 88.74 236 578 0.86 [5]
2000 78.06 350 593 0.62 [119]
EHF 2000 74.17 330 509 0.65 [115]
2030 80.13 310 301 1.01h [117]
2000 95.45 289 432 1.03i [122]
2000 95.45 250 444 1.11j
aGF: gasification-syngas fermentation; EHF: enzymatic hydrolysis fermentation; GMA: gasification-mixed alcohol
catalytic conversion;bMTPD: metric tonnes per day;cTCI: total capital investment;dMESP: minimum ethanol
selling price;eNR: not reported;fethanol concentration in the beer is 24 g/L;gethanol concentration in the beer is
50 g/L;hethanol concentration in the beer is 70 g/L;idiluted acid pretreatment;jAFEX: ammonia fiber explosion.
Current TEA studies are based on technical data and assumptions for first generation biorefineries. Further technology advancements will provide stable, controlled and efficient biofuel conversion processes, which are expected to make future biorefineries feasible.
6. Conclusions


![Figure 5.Figure 5. Historical prices of corn ethanol and gasoline in the United States [ Historical prices of corn ethanol and gasoline in the United States [113].113].](https://thumb-us.123doks.com/thumbv2/123dok_us/9722313.1499406/19.595.126.472.183.398/figure-historical-gasoline-historical-ethanol-gasoline-united-states.webp)