© Universiti Tun Hussein Onn Malaysia Publisher’s Office
IJIE
Journal homepage: http://penerbit.uthm.edu.my/ojs/index.php/ijie
The International
Journal of
Integrated
Engineering
Characterization of Wideband Semiconductor Optical
Amplifiers
B
ased on OptiSystem and MATLAB
Y. S. Ong
1, O. M. Kharraz
2, A. H. Sulaiman
3, F. Abdullah
3, N. Md. Yusoff
1,*1Razak Faculty of Technology and Informatics,
Universiti Teknologi Malaysia Kuala Lumpur, Jalan Sultan Yahya Petra, 54100 Kuala Lumpur, Malaysia.
2Faculty of Electrical Engineering,
Universiti Teknologi Malaysia, 81310 Skudai, Johor, Malaysia.
3Institute of Power Engineering,
Universiti Tenaga National, Jalan IKRAM-UNITEN, 43000 Kajang, Selangor, Malaysia.
*Corresponding Author
DOI: https://doi.org/10.30880/ijie.2018.10.07.024
Received 5 July 2018; Accepted 22 November 2018; Available online 30 November 2018
1. Introduction
Semiconductor optical amplifier (SOA) device has been utilized extensively as a potential gain medium in various domains, especially for the dense wavelength division multiplexing (WDM) system, WDM passive optical network, optical sensors, and others [1-13]. In the broad field of MWFL, the generation of multiple laser lines can be yielded through different gain media such as rare-earth doped Erbium, Thulium or Ytterbium amplifier and Raman, Brillouin or Rayleigh scattering effects.
Among the gain media used by different configurations, the SOA is more competitive as compared to erbium-doped fiber amplifier (EDFA). This is not because of SOA characteristics such as gain, noise figure (NF), saturated output power but more importantly its inhomogeneous characteristic that can put the SOA device at a greater advantage.
Abstract: A study about different types of semiconductor optical amplifiers (SOA)s - linear, nonlinear and in-line SOAs modelling is carried out. The SOA key performance characteristics covered in this paper include optical gain, power, and amplified spontaneous emission (ASE) noise figure. These characteristics definition are included in this work together with the tabulation of each SOA specification parameter operating in the operational conventional (C-) band. The first modelling of SOA wideband travelling wave (TW) component is done through a simple configuration using OptiSystem software. Next, the second modelling method is simulated through numerical steady-state model using MATLAB software. Each graphical result is explained and discussed according to the operational characteristic theories of SOA along with the evaluation for the best performance among the types of SOAs. The contrasted result among them had shown that linear SOA has the most ideal and competitive characteristics, as compared to the nonlinear and in-line SOAs, especially a better choice as gain medium in the multiwavelength fiber laser (MWFL) application.
In the realization of practical usage of SOA, the SOA is more attractive to be chosen than the scattering effects because of its physical appearance. The small and compact size of SOA chip can be handled without much hassle in contrast to Raman amplification which requires high pump power.
This paper reported on the study of wideband SOA characterization because from most of the previous works, they had employed the wideband SOAs in their experiments. These can be categorized according to their different configurations in wavelength filtering Lyot comb [4, 5], Fabry-Perot (FP) [11] and Mach-Zehnder interferometer (MZI) [1], [10].
Furthermore, the SOA can be divided into linear [1-8, 11, 13] and nonlinear SOAs [9, 10, 12] types. However, their characteristics are not clearly compared and evaluated for MWFL applications in the literature. In this paper, we investigate the characterization of different types of SOAs, namely linear, nonlinear and in-line SOAs through OptiSystem and numerical steady-state models.
1.1 SOA Characteristics Definition
Optical gain is the ratio of optical output power to the input power in definition (1) while the equations for large
signal amplifier gain and unsaturated gain
G
0 are (2) and (3) respectively [14].in out
P
P
G
(1)
s out
P
P
G
G
G
G
0exp
1
(2))
exp(
00
g
L
G
(3)where
P
s is the saturated power andL
is the active region length. Apart from the general gain definition, the SOA hasanother type of gain which is the fiber-to-fiber gain, in which it has encountered the input and output coupling losses. Generally, a practically-performed amplifier in experimental work should have a minimum value of NF, which is defined as the ratio of optical signal-to-noise degradation as (4).
o i
OSNR
OSNR
NF
(4)2. Experimental Setup
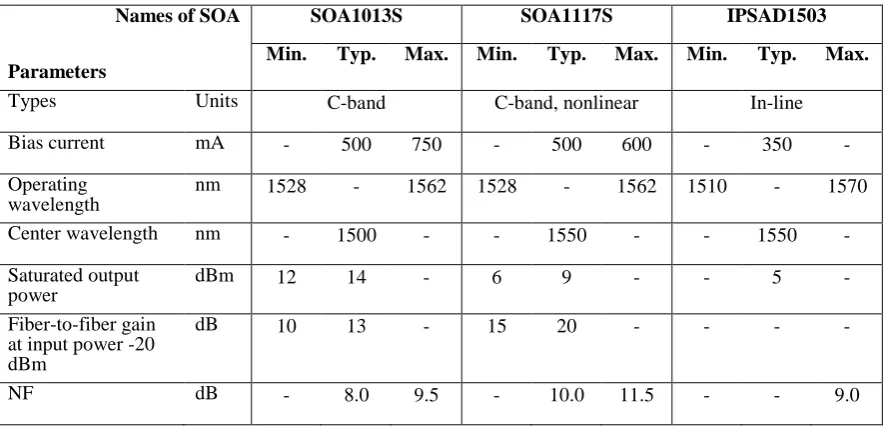
Fig. 1 shows a simple configuration built in the OptiSystem to investigate the wideband TW-SOA characteristics such as total gain, total ASE output power, and noise bins spectrum. The SOA input parameters are customized manually according to the types of SOA: linear SOA1013S (manufactured by Thorlabs), nonlinear SOA1117S (manufactured by Thorlabs) and in-line IPSAD1503 (manufactured by Inphenix) with their specification sheet as shown in Table 1. The laser is a source for continuous wave pumping and it is connected to the SOA by optical fiber, then the detector components are connected from the output channel. The dual port WDM analyser component calculates the optical input power, noise, wavelength and other WDM output channel; the optical power meter component visualizes the average of optical power; and the optical spectrum analyser displays the optical signal in frequency domain.
Dual Port WDM Analyzer
Wideband TW-SOA Continuous
Wave Laser
Optical Spectrum Analyzer Optical Power
Meter
Fig. 1 - Modelling setup in OptiSystem.
Table 1 - Specification sheet for linear, nonlinear and in-line SOAs.
3. Principle of Operation
The steady-state model is a set of differential equations in which it functions to describe and understand the behaviors of carrier density and photon rates. This model is developed by M. J. Connelly [15] to design and optimize the main characteristics of 1.55 μm InP/InGaAsP homogeneous buried ridge stripe type SOA. Various internal variables are related to external variables that are measurable i.e. saturation output power, output signal power and ASE noise. The TW equation of signal field is
( , )
( )2 1 )
(
z Es n
v g j
dz z dEs
k k
m k
k
(5)where
Es
k(
z
)
is the complex TW in the positive and negative
z
direction by assuming that there are negligible transverse variations in the photon rates and carrier density. The model hasN
s injected signals and optical frequencyv
kbefore coupling loss. The
k is the signal propagation coefficient, is the optical confinement factor,g
m is the materialgain coefficient, and
is the material loss coefficient.The TW equation of spontaneous emission is represented by
(6)
( , ) ( )
( ) ( , )) (
n v R z N n n v g dz
z dN
j sp j
s j m
j
Names of SOAParameters
SOA1013S SOA1117S IPSAD1503 Min. Typ. Max. Min. Typ. Max. Min. Typ. Max.
Types Units C-band C-band, nonlinear In-line
Bias current mA - 500 750 - 500 600 - 350 -
Operating wavelength
nm 1528 - 1562 1528 - 1562 1510 - 1570
Center wavelength nm - 1500 - - 1550 - - 1550 -
Saturated output power
dBm 12 14 - 6 9 - - 5 -
Fiber-to-fiber gain at input power -20 dBm
dB 10 13 - 15 20 - - - -
-10 0 10 20 30 40 50
-50 -45 -39 -34 -29 -23 -18 -13 -8 -2 3 8 14
T o tal g ain ( d B )
Input power (dBm)
Linear SOA with typical bias current at 500 mA
Nonlinear SOA with typical bias current at 500 mA
In-line SOA with typical bias current at 350 mA
where
N
j(
z
)
is the spontaneous emission photon rate TW in positive and negative z direction andR
sp is the emission noise coupled into the spontaneous emission.The carrier density rate equation within the active layer is given by
)
(
)
(
)
,
(
2
)
(
)
(
)
,
(
)
(
)
(
1 0 1z
N
z
N
K
n
v
g
dW
z
Ns
z
Ns
n
v
g
dW
n
R
edLW
I
dt
z
dn
j j N j j j m k k N k k m m s (7)where
n
is the refractive index of electromagnetic radiation,I
is the bias current,e
is the electron charge,d
is the thickness,W
is the width of the active region andK
is the bandgap shrinkage coefficient. Algorithms from (5) to (7) are solved numerically through MATLAB.4. Results and Discussion
4.1 OptiSystem Modelling
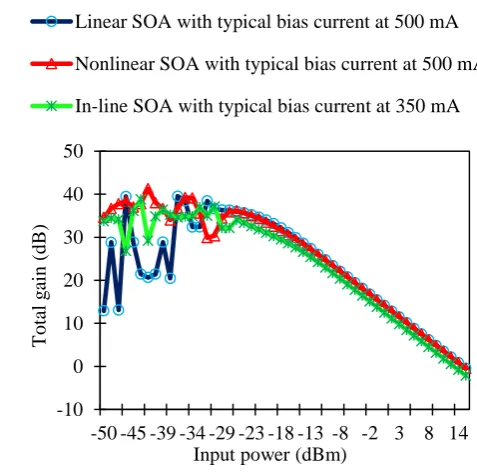
4.1.1 Total Gain
Fig. 2 shows the total gain obtained from a laser with wavelength at 1550nm by the input laser power ranges from -30 dBm and above. All types of SOA have a similar graph saturation curvature in blue-, red- and green-coloured line with a little bit offset. Fluctuated gain values start from -50 to -25 dBm for linear SOA with typical bias current at 500 mA in the range between 13 and 40 dB, whereas the nonlinear SOA with typical bias current at 500 mA fluctuates between 29 and 42 dB and the in-line SOA with typical bias current fluctuates between 26 and 40 dB. All SOAs continue by stable gain values from -25 to 15 dBm.
The graphical gain curvature presents a decrement of 3 dB or by an amplifying gain factor of two, which is the notation of SOA gain saturation. Similar to electrical amplifiers, the SOA also has saturated output power when applying too much input power. In this case, the slow decrement is observed until a gain saturation point, which is a gain-depleted state after overcoming the saturation power, is measurable at approximately 14 dBm at 0 dBm input power [16, 17].
0 5 10 15 20 25 30 35 40 45
1,500 1,520 1,540 1,560 1,580 1,600
T
o
tal
g
ain
(
d
B
)
Wavelength (nm)
0 5 10 15 20 25 30 35 40 45
50 150 250 350 450
T
o
tal
g
ain
(
d
B
)
Bias current (mA)
Linear Nonlinear In-line 0
2 4 6 8 10 12 14 16
1,500 1,520 1,540 1,560 1,580 1,600
T
o
tal
g
ain
(
d
B
)
Wavelength (nm)
Linear Nonlinear In-line
Fig. 3(a) shows the total gain based on the input signal of 0 dBm with centered wavelength 1500 nm. All types of SOAs are operating according to their specific wavelength range, that is in the category of C-band and above, where the achieved gain is between the range of 1500 to 1600 nm. Both the linear and non-linear SOAs are having saturated gain value around 14 dB across the C-band, as illustrated by the red- and blue-coloured flat spectrum.
Fig. 3(b) illustrates the graph when the input laser signal is constant at -30 dBm. With a slightly higher than the average practical gain of 14 dB, the total gain shown by the simulation result records values greater than 20 dB. Highest total gain achieved by linear SOA is in average value 36 dB. However, the nonlinear and in-line SOAs are having fluctuating gain values and undeterminable average gain in red- and green-coloured markers.
Depletion of carrier density process in SOA is slower at lower input power [17] when compared between 0 and -30 dBm. Thus, gain peak values shift from 20 to 40 dB with more gain fluctuations occurring within a shorter wavelength. (a) (b)
Fig. 3 – Gain pattern for input power setting at (a) 0 dBm; (b) -30 dBm.
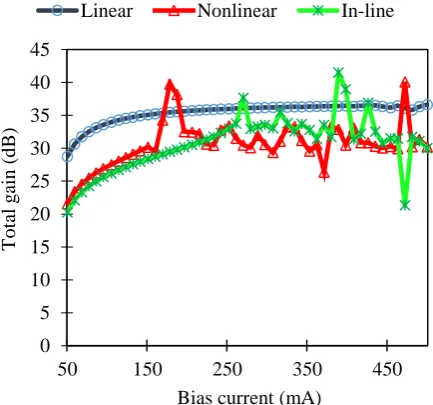
Fig. 4 depicts the result when the laser is set constant at -30 dBm input power and 1550 nm input wavelength. In the increasing varied bias current, the most stable quasi-linear region is seen by linear SOA. In the beginning of bias current from 50 to 150 mA, the SOAs are setting up with slow raise of total gain value. From 100 mA up to 500 mA with the blue-coloured marker, gain region has stabilized value at around 36 dB [16].
-40 -30 -20 -10 0 10 20 30 40 50
-50 -30 -10 10
T
o
tal
A
SE
o
u
tp
u
t
p
o
w
er
(
d
B
m
)
Input power (dBm)
4.1.2 Noise Figure
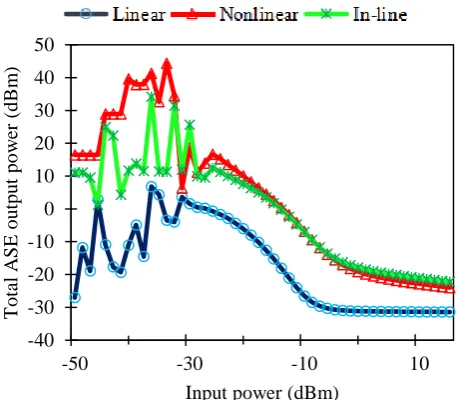
The NF is measured by both optical power meter and optical spectrum analyzer in which results in total ASE output power and noise bin spectrum respectively. Fig. 5 depicts the graph by configuring the laser at wavelength 1550 nm. The total ASE output power follows a parabolic shape curvature as observed from beyond -30 dBm input power.
The linear SOA saturates at 0 dBm input power by noticing the parabolic curvature ended at that point. In contrast, nonlinear and in-line SOAs with red and green-coloured marker have no apparent saturation point with smoother curve line fitting compared with a parabolic curve. They also have higher ASE output power values from approximately -25 to 15 dBm.
Interestingly, the linear SOA has better stabilization ability by observing the perfect parabolic curvature compared with other types of SOAs. It is because according to the basic SOA operating theory, the absorption and emission reactions occurred are working in a simultaneous manner within the active region.
Fig. 5 - Total ASE output power against input power.
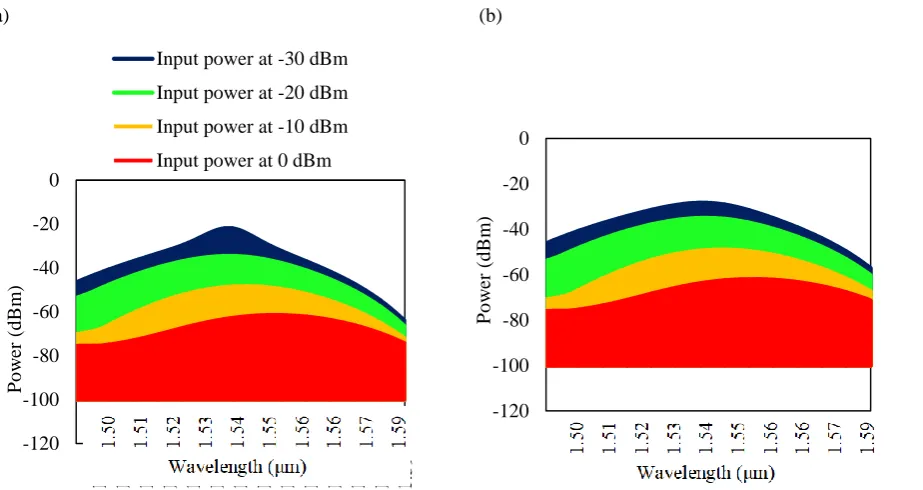
Next, the SOA exhibits ASE noise property with a central wavelength at 1550 nm and operates at C-band from 1500 to 1600 nm. The noise bins spectrum for linear SOA is shown in Fig. 6(a) while the spectrum for nonlinear and in-line SOAs are shown in Fig. 6(b). Both spectrums are similar except for linear SOA at -30 dBm input power had achieved the highest -20 dBm peak power, as observed by the blue-coloured area under the curve.
The spectrum is iterated four times from -30 to 0 dBm input power as shown by blue-, green-, orange- and red-coloured area under the curve. As input power increases, the noise peak power decreases towards -40, -50 and -70 dBm.
ASE noise phenomenon can be elaborated further by the outcome from the spontaneous emission during lasing mechanism. The active region of SOA was injected by the external current, in common by a continuous wave laser source. The SOA is biased by this external current to produce a population inversion. Theoretically, this will energize electrons into two distinct energy levels. Stimulated electrons reproduce stimulation while the spontaneous electrons will combine into a hole at the lower energy level.
-120 -100 -80 -60 -40 -20 0
1
.5
9
1
.5
8
1
.5
7
1
.5
6
1
.5
6
1
.5
5
1
.5
4
1
.5
4
1
.5
3
1
.5
3
1
.5
2
1
.5
1
1
.5
1
1
.5
0
P
o
w
er
(
d
B
m
)
Input power at -30 dBm
Input power at -20 dBm
Input power at -10 dBm
Input power at 0 dBm
-120 -100 -80 -60 -40 -20 0
P
o
w
er
(
d
B
m
)
(a) (b)
Fig. 6 - Noise bins spectrum with different input power for (a) linear; (b) nonlinear and in-line SOAs.
4.2 MATLAB Steady-state Modelling
The steady-state model can be resolved into fiber-to-fiber gain and output power results. Furthermore, the gain and NF are plotted into varied bias current for all types of SOAs.
4.2.1 Fiber-to-fiber Gain
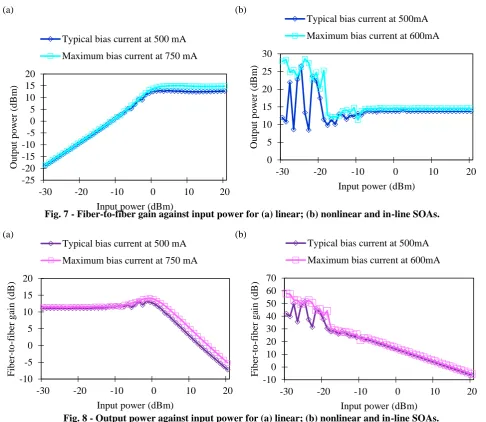
Fig. 7(a) shows the result of fiber gain against input power for linear SOA. Typically, SOA has fiber-to-fiber gain value commonly ranges between 15 to 25 dB. From the graph, linear SOA with bias current at 500 mA can reach up to 13 dB and also with maximum 750 mA can achieve up to 14 dB, additionally both values are above the minimum 10 dB value. It is similar to the specification in Table 1 at input power of -20 dBm [17]. Beyond 0 dBm input power, the purple- and pink-coloured lines decrease in proportion with the increment of input power.
The same type of graph is illustrated for other types of SOA as Fig. 7(b). For both nonlinear and in-line SOAs, the graph does not illustrate for a stable gain condition in the range of -30 to -18 dBm input power but with fluctuating values. Fiber-to-fiber gain is approximately at 30 dB at input power of -18 dBm for both typical and maximum bias currents at 500 and 600mA.
After the gain fluctuation, the fiber-to-fiber gain has decreased proportionally with the increase of input power from -18 to 20 dBm for both bias currents. Then, the gain drops at zero gain value at around 15 dBm for a typical bias current of 500 mA and 20 dBm for maximum bias current of 600 mA.
4.2.2 Output Power
Fig. 8(a) shows the output power against input power for linear SOA. A linear relation is observed in between -20 to 15 dBm output power range against input power ranges of -30 to 0 dBm. The subsequent output power after 0 dBm input power is maintained at a constant value of 14 dBm [18]. Both the typical 500mA and maximum 750mA bias currents are showing similar output power values with a small difference of one or two dBm.
-25 -20 -15 -10 -5 0 5 10 15 20
-30 -20 -10 0 10 20
Ou
tp
u
t
p
o
w
er
(
d
B
m
)
Input power (dBm) Typical bias current at 500 mA
Maximum bias current at 750 mA
0 5 10 15 20 25 30
-30 -20 -10 0 10 20
Ou
tp
u
t
p
o
w
er
(
d
B
m
)
Input power (dBm) Typical bias current at 500mA
Maximum bias current at 600mA
-10 -5 0 5 10 15 20
-30 -20 -10 0 10 20
Fib
er
-to
-f
ib
er
g
ain
(
d
B
)
Input power (dBm) Typical bias current at 500 mA
Maximum bias current at 750 mA
-10 0 10 20 30 40 50 60 70
-30 -20 -10 0 10 20
Fib
er
-to
-f
ib
er
g
ain
(
d
B
)
Input power (dBm) Typical bias current at 500mA
Maximum bias current at 600mA (a) (b)
Fig. 7 - Fiber-to-fiber gain against input power for (a) linear; (b) nonlinear and in-line SOAs. (a) (b)
Fig. 8 - Output power against input power for (a) linear; (b) nonlinear and in-line SOAs.
4.2.3 Gain and NF
Fig. 9(a) shows the fiber-to-fiber gain and NF against bias current for linear SOA for both input powers at -30 and 0 dBm. In this varied bias current graph, the concept of threshold current can be easily noted. An abrupt gain value adjustment from -3 to 7 dB has happened at 230 mA as optical gain increases linearly with bias current as the blue- and green-coloured marker.
Threshold current is the critical transition at where population inversion is achieved within the SOA confinement. This is also the state at which excited electrons have overcome unexcited electrons.
In Fig. 9(a), the blue-colour marker overlaps with the green-coloured marker for both the gains plotting. The highest gain peak at 13.5 dB has shown that at 0 dBm input power, the active region has achieved a stable gain in similarly with the result presented as Fig. 7(a).
Comparing between the -30 and 0 dBm input power, the fiber-to-fiber gain (blue-coloured marker) is higher than NF (red-coloured marker) in a few dBs at 0 dBm input power. Meanwhile at -30 dBm, the NF is in rather high value than the gain which conveys the unpractical use of SOA.
Fig. 9(b) illustrates for the performance of nonlinear SOA in terms of fiber-to-fiber gain and NF against bias current for both input powers at -30 and 0 dBm. At -30 dBm input power, nonlinear and in-line SOAs experienced obvious threshold current at beyond 270 mA due to the optical gain (green-coloured marker) and NF (purple-coloured marker) fluctuations.
-20 -10 0 10 20 30 40 50 60
50 100 150 200 250 300 350 400 450 500
Gain
/NF
(d
B
)
Bias current (mA) Gain at 0 dBm input power
NF at 0 dBm input power
Gain at -30 dBm input power
NF at -30 dBm input power
-30 -20 -10 0 10 20 30 40
50 100 150 200 250 300 350 400 450 500
Gain
/NF
(d
B
)
Bias current (mA) Gain at 0 dBm input power
NF at 0 dBm input power
Gain at -30 dBm input power
NF at -30 dBm input power
At 0 dBm input power, the NF (red-coloured marker) is below 10 dB whereas the fiber-to-fiber gain (blue-coloured marker) is above 10 dB. As different from linear SOA as Fig. 9(a), the nonlinear SOA has useful and practical gain value as similar as linear SOA at 0 dBm.
(a) (b)
Fig. 9 - Fiber-to-fiber gain and NF against bias current for (a) linear; (b) nonlinear and in-line SOAs.
5. Conclusion
We have shown that the linear SOA has the optimum total gain characteristic of 14 dB at 0 dBm, produced the best parabola-shaped total ASE output power in OptiSystem, fiber-to-fiber gain of 13 dB at -20 dBm in MATLAB, compared to the other types of SOA with the bias total ASE output power curve, fluctuated fiber-to-fiber gain and output power at -30 dBm . It is to note that linear and nonlinear SOAs are classified in the pre-amplifier family in contrast to in-line SOA categorized as a booster amplifier. Throughout this paper, the linear SOA stands far better performance than other SOAs.
With this great comparison between the linear SOA and the other SOAs, the OptiSystem simulation and MATLAB results are elaborated further. The total gain characteristic was explained by gain pattern using operational theories in contrast between linear and nonlinear SOA. Linear SOA also exhibits the most stable quasi-linear gain region over bias current.
Besides, another important SOA characteristic which is the ASE noise phenomenon was discussed. From the noise bins spectrum, low input power at -30 dBm had produced the highest noise bins peak power which will perform the best result for SOA.
Apart from that, the solution from MATLAB numerical steady-state model had also highlighted the linear SOA characteristics. Its distinct and optimal characteristics especially in gain performance, have realized the requirement for a stable gain condition for MWFL application. From the model, the nonlinear and in-line SOA used are found to have identical performances.
Acknowledgement
References
[1] H. Y. Hsu, Y. L. Yu, C. C. Tsai, S. K. Liaw, N. K. Chen and W. F. Wu, "Semiconductor optical amplifier based multi-wavelength lasers in 0.4 nm channel spacing," Laser Phys., vol. 23, pp. 095104, Aug. 2013.
[2] P.-C. Peng, W.-Y. Lee, S.-S. Wu and H.-L. Hu, "Multiwavelength fiber laser for the fiber link monitoring system," Optics & Laser Technol., vol. 51, pp. 62-66, Apr. 2013.
[3] Z. V. Rizou, K. E. Zoiros, A. Hatziefremidis and M. J. Connelly, "Design analysis and performance optimization of a Lyot filter for semiconductor optical amplifier pattern effect suppression," IEEE J. Selected Topics in Quantum Electron., vol. 19, pp. 3100109, September/October 2013.
[4] A. H. Sulaiman, M. H. Abu Bakar, A. K. Zamzuri, S. Hitam, A. F. Abas and M. A. Mahdi, "Investigation of multiwavelength performance utilizing an advanced mechanism of bidirectional Lyot filter," IEEE Photon. J., vol. 5, pp. 7101008, December 2013.
[5] A. H. Sulaiman, A. K. Zamzuri, S. Hitam, A. F. Abas and M. A. Mahdi, "Flatness investigation of multiwavelength SOA fiber laser based on intensity-dependent transmission mechanism," Opt. Commun., vol. 291, pp. 264-268, 2013. [6] C. Qin and D. Yang, "Numerical simulation of ring cavity wavelength-swept laser based on semiconductor optical
amplifier," IEEE J. Quantum Electron., vol. 50, pp. 831-839, October 2014.
[7] L. Huo, H. Li, Z. Zhao, X. Chen, Y. Wu and C. Lou, "100-GHz wavelength-tunable all-optical clock recovery with Fabry-Perot filter and semiconductor optical amplifier," Opt. Commun., vol. 359, pp. 285-289, September 2015. [8] Y. Sun, R. Zhang, Q. Li and Z. Wang, "Tunable multiwavelength fiber laser source for continuous true-time-delay
beamforming," IEEE Photon. Technol. Lett., vol. 28, no. 11, pp. 1261-1263, June 2016.
[9] L. Wang, Y. Cao, M. Wan, X. Wang, X. Feng, B. Guan and J. Yao, "Tunable single-frequency fiber laser based on the spectral narrowing effect in a nonlinear semiconductor optical amplifier," Opt. Express, vol. 24, no. 26, pp. 29705, December 2016.
[10] O. M. Kharraz, A. B. B. Mohammad, H. Ahmad and A. A. Jasim, "Performance enhancement of multi-wavelength generations based on SOAs with a microfiber Mach-Zehnder interferometer," Laser Phys., vol. 27, pp. 075101, May 2017.
[11] X. Mao, S. Zhao, S. Yuan, X. Wang and P. Zheng, "Continuously tunable wideband semiconductor fiber-ring laser," Laser Phys., vol. 27, pp. 085102, July 2017.
[12] Z. Shen, L. Wang, X. Wang, Y. Cao, X. Feng and B. Guan, "Tunable dual-wavelength single-longitudinal-mode fiber laser based on spectral narrowing effect in a nonlinear semiconductor optical amplifier," Opt. and Laser Technol., vol. 94, pp. 72-76, March 2017.
[13] Y. Xu, L. Zhang, L. Chen and X. Bao, "Single-mode SOA-based 1kHz-linewidth dual-wavelength random fiber laser," Opt. Express, vol. 25, pp. 15828, July 2017.
[14] N. K. Dutta and Q. Wang, Semiconductor Optial Amplifiers, USA: Word Scientific Publishing Co. Pte. Ltd., 2006. [15] Connelly, M.J., “Wideband semiconductor optical amplifier steady-state numerical model,” IEEE J. Quantum
Electron.,vol. 37, pp. 439-447, 2001.
[16] O. M. Kharraz, D. I. Forsyth, A. B. B. Mohammad, Y. K. Yeow and A. M. Mataria, "Quantifying system performance improvements in a high-density spectrum-sliced channel running at 10Gb/s using semiconductor optical amplifier gain compression nonlinearities," Opt. Eng.,vol. 52, pp. 106106, 2013.
[17] R. A. Johni, D. I. Forsyth and K. R. Tariq, "Effects on SOA gain quality for applications in advanced all-optical communication systems," Research J. Applied Sciences, Eng. & Technol.,vol. 7, pp. 3414-3418, 2014.