Comparative Study of Heuristic Optimization
Techniques (HOTs) for Energy Efficient Induction
Motor Design
V.P. Sakthivel
Assistant Professor
Department of Electrical and Electronics Engineering Government College of Engineering, Dharmapuri – 636704, India.
Abstract: Three-phase induction motors are widely used in domestic, commercial and industrial applications. On an average, the energy consumed by an induction motor during its life cycle is 60–100 times the initial cost of the motor. Even a small percentage of efficiency increase will result in a significant energy conservation and economic impact. A comparative study of heuristic optimization techniques (HOTs) has been carried out for energy efficient induction motor design (EEIMD) problem considering the active power loss effect to ensure the minimum manufacturing and annual power loss costs. The objective of this paper is to minimize the total manufacturing and annual power loss costs. In this paper, various HOTs such as genetic algorithm (GA), particle swarm optimization (PSO), and exchange market algorithm (EMA) have been applied to obtain EEIMD solutions. The proposed algorithms have been applied on designing the two sample motors. In comparison with the solution quality and execution time obtained by the HOTs, the EMA seems to be a promising technique to solve EEIMD problems.
Index Terms - Energy efficient motor, evolutionary algorithm, genetic algorithm, heuristic optimization techniques.
NOMENCLATURE
Misc, Mist core and tooth iron masses in stator (Kg)
Mirc, Mirtb, Mirtt core, tooth bodies and tooth tips iron masses in rotor (Kg) Mb, Mer, Msc bars, end rings and stator conductor copper masses (Kg) pisc, pist specific iron loss of stator core and tooth (W/Kg) Pisc, Pist core and teeth iron power loss in stator (W)
Pb, Per, Psc bars, end rings and stator conductors copper power losses (W) Pf, Ps friction and stray power losses (W)
Ksr, Kss rotor and stator slot copper insulating factors
δr rotor current densities (A/mm2)
p number of poles
T motor running time per year (hr)
α annual rate of interest and depreciation
η full-load efficiency
W rated power (W)
Ker end ring non-uniformity current distribution factor Wc, Wi copper and iron specific masses (Kg/m3)
ρs, ρr stator and rotor copper resistivities (Ω.m)
Ki iron insulation factor
Kj end ring to bar current density ratio
f supply frequency (Hz)
Nr, Ns rotor and stator number of slots
cc, ci specific copper and iron material costs (Rs/Kg)
ce specific energy loss cost (Rs/Wh)
cp specific power loss cost (Rs/W)
drc rotor core depth (m)
drs rotor slot opening depth (m)
wrs rotor slot opening width (m)
Di rotor inner diameter (m)
Do stator outer diameter (m)
Dr rotor diameter (m)
L gross iron length (m)
Li active iron length (m)
m number of particles in the swarm
N number of dimensions in a particle
K pointer of iterations (generations) Vi, n k velocity of particle i at iteration k
W weighting factor
C 1, C2 acceleration factor
X i, n k current position of particle i at iteration k pbest i personal best of particle i
gbest global best of the group
W max final weight factor W min initial weight factor Iter current iteration number Iter max maximum iteration number ni nth person of the first group nj nth person of the second group
r random number within [0, 1]
jth member of the second group
members of the first group
members of the second group r1 and r2 random numbers
nk nth member of the third group
kth member of the third group and
Sk share variation of the kth member of the third group
share value added randomly to some shares
total shares of member t
shares of the tth member
information of exchange market
risk level for each member of the second group
number of the tth member in exchange market
number of the last member in exchange market, l is a constant coefficient for each member
g1 common market risk amount
, maximum and minimum values of risk in market respectively
share value added randomly to some shares
random number between -0.5 and 0.5
market variable risk in third group
I.INTRODUCTION
Improving the efficiency of three-phase squirrel cage induction motors, which are the most energy consuming electric machines in the world, saves much energy. The efficiency can be raised by optimizing the induction motor design. The following two different, partially conflicting approaches are considered for the optimal design of three-phase induction motor (IM) as follows:
From the manufacture’s viewpoint, an optimal design has minimum production cost including the active and construction materials and the manufacturing cost [1-5].
From the consumer’s viewpoint, an optimal designed motor has the lowest annual cost, including the initial capital cost, interest rate, energy losses cost, yearly operation time, etc [4-6].
The optimal design of a three-phase cage IM for minimum annual cost, using evolutionary optimization techniques, is an appropriate approach to the motor design. With this approach, any desired requirements may be easily expressed in the optimization problem formulation. The optimal design parameters of the motor can be obtained by solving a constrained nonlinear optimization problem. The problem consists of an objective function which is optimized (minimized or maximized) with a set of constraints.
Stochastic searching algorithms such as GA [7], evolutionary algorithm [8], neural networks [9], fuzzy logic [10], PSO [11, 12], Adaptive PSO [13], bacterial foraging algorithm (BFA) and Adaptive BFA [14] have been used to solve the IM design problems. Though heuristic algorithms such as GA have been employed to solve IM design problems, recent research has indentified some deficiencies in GA performance [15]. The premature convergence of GA degrades its performance and reduces its search capability that leads to a higher probability toward obtaining local minimum.
A new evolutionary algorithm called exchange market algorithm (EMA) was proposed by Naser Ghorbani and Ebrahim Babaei in 2014 [16]. The EMA is inspired by intelligent dealings of shareholders. The exchange market changes between normal and oscillatory market conditions. These characteristics are introduced in EMA. The two searcher and absorbent operators are used in normal and oscillatory market conditions respectively. As each iteration uses double exploitation and exploration property, EMA is one of the most efficient heuristic search algorithms. Currently, EMA is applied successfully in various areas of power system problems such as economic dispatch and reactive power dispatch [17].
) 2 ( group j
pop
) 1 ( group
,i 1
pop
) 1 ( group
,i 2
pop
) 3 ( group k
pop
1 t
n
1 t
n
y t
S
1
pop
t
pop
n
max , 1
g
g
2,max3 t
n
s
r
This paper presents the application of GA, PSO and EMA to solve the EEIMD problems. The effectiveness and robustness of the HOTs have been verified by the simulations conducted on two sample induction motors design. The results confirm the
effectiveness and robustness of the EMA algorithm through a comprehensive statistical analysis. The main contributions of this paper can be summarized as follows:
The EMA algorithm is proposed as a new optimization tool for the EEIMD problems. Experiments are carried out to compare EMA with the other HOTs.
This paper is structured as follows. The EEIMD problem is introduced in Section 2. Section 3 presents the overview of HOTs in brief. The implementation of the HOTs to EEIMD is described in Section 4. The computational results are analyzed in Section 5, and the conclusion is provided in Section 6.
II.PROBLEM FORMULATION
A. Definition
If ‘F’ is the objective function, which depends on the design variables vector X= (X1, X2, ..., XN), the corresponding constrained IM design optimization problem can be written as:
Min F(X)
Subject to G(X) ≤ 0 (1)
B. Design variables
The nine design variables are used in formulating the objective and constraint functions of the IM design problem.
C. Constraints
The six important motor performance indices are chosen as design constraints.
D. Objective function
In this study, the annual cost of IM is considered as the objective function. The annual cost of the motor is the summation of annual cost of the motor manufactured iron and copper materials, the annual cost of a fictitious active power source required to cover the total active power loss of the motor and the annual cost of energy needed by that fictitious source. The expression of different cost functions, in terms of the design variables are summarized as follows:
(i) Annual active material cost Annual iron material cost,
Ci αci(Misc MistMirc Mirtt Mirtb) (2)
Annual copper material cost, ) er M b M sc M ( c αc c
C
(3)
Annual active material cost is given by
c C i C m
C (4)
(ii) Annual active power loss cost Annual iron loss cost,
) ist P isc (P p αc ip
C
(5)
Annual copper loss cost
) er P b P sc (P p αc cp
C
(6)
Annual friction and windage loss cost,
f P p αc fp C (7)
The stray loss is assumed to reduce the efficiency by 0.5%, so that
s P p αc sp C (8)
The total annual active power loss cost is thus
sp C fp C cp C ip C p
C
(9)
(iii) Annual energy loss cost
p αc p TC e c e C (10)
The objective function is given by
e C p C m C
F(X)
III.OVERVIEW OF HOTS
A. GA
Genetic algorithm (GA) is a search algorithm based on the behavior of natural selection and genetics. GA’s operate on a population of potential solutions applying the principle of survival of the fittest to produce better solution. At each generation, a new set is created by the process of selecting individuals according to their fitness in the problem domain and breeding them by crossover and mutation operators. This process leads to the evolution of populations of individuals that are better than the individuals [6]. It consists of a population of bit strings transformed by three genetic operators: selection, crossover and mutation. Each string (called chromosome) represents a possible solution to the problem being optimized and each bit (or group of bits) represents a value for some variable of the problem (gene). These solutions are classified by an evaluation function to better solutions. Each solution is evaluated by the fitness function to produce a value. The pair of chromosome and fitness represents an individual. The selection operator creates a new population (or generation) by selecting individuals from the previous population. Crossover is the main genetic operator and consists of swapping the chromosome between individuals. Crossover is being controlled by a crossover probability [7]. This probability should have a larger value. The last operator is mutation and consists of changing a random part of the string representing the individual.
B. PSO
Particle swarm optimization (PSO), first introduced by Kennedy and Eberhart, is one of the heuristic optimization algorithms. A simple PSO maintains a swarm of particles that represent the potential solutions to the problem on hand. The simple PSO consists of a swarm of particles moving in the D-dimensional space of possible problem solutions. Each particle embeds the relevant information regarding the D decision variables and is associated with a fitness that provides an indication of its performance in the objective space. Each particle i has a position X i = [X i, 1, X i, 2 ….X i, D] and a flight velocity V i = [V i, 1, V i, 2……V i, D] . Moreover, a swarm contains each particle i own best position pbest i = (pbest i, 1, pbest i,2, ……., pbest i, D) found so far and a global best particle position gbest = (gbest i, gbest i, ……., gbest D) found among all the particles in the swarm so far.
In essence, the trajectory of each particle is updated according to its own flying experience as well as to that of the best particle in the swarm. The standard PSO algorithm can be described as
V i, d k+1 = W V i, d k + C1 rand1 (pbest i, dk – X i, dk) + C2rand2 (gbest dk – X i, d k)
X i, dk+1 = X i,dk + Vi, dk+1
i= 1, 2………, n; d= 1, 2………., D
The time varying weighting function is given by
W= W max - (W max – W min) × Iter / Iter max
C. EMA
EMA is a new population-based meta-heuristic algorithm proposed by Ghorbani and Babaei [16]. The algorithm imitates the human behavior of stock market in which shareholders trade shares under balanced and oscillated market situations. This algorithm uses two searcher and absorbent operators in normal and oscillation modes respectively. In EMA, optimum solution is regarded as one that is searched out by a shareholder population. Each individual of this population is called a shareholder. The individuals of searcher group and absorbent group are responsible for improving the exploration and exploitation abilities of the algorithm.
1) Exchange Market in Normal Mode
In normal condition of the exchange market, the shareholders try to maximize their profit using elite shareholders experience. In the population, each shareholder is ranked according to the fitness function.
i) Shareholders with High Ranks
These shareholders do not change their shares without performing any risk and trade to maintain their ranks. This group of shareholders composes 10 – 30% of the population.
ii) Shareholders with Average Ranks
This group of shareholders composes 20–50% of the population. The members of this group use the experiences of elite stockbrokers and take the least possible risk in changing their shares.
and
iii) Shareholders with Weak Ranks
This group of shareholders composes 20–50% of the population. The members of this group utilize the differences of share values of elite and medium shareholders with their share values. The population of this group is given in the following equation.
) 1 ( group
,i 2 )
1 ( group
,i 1 )
2 ( group
j
r
pop
(
1
r)
pop
pop
i
n
...
,
3
,
2
,
1
i
j
1
,
2
,
3
,
....
n
j
group(3)k ) 1 ( group
1 , i 1
k
2
r
pop
pop
2) Exchange Market in Oscillation Mode
In this mode, the shareholders perform intelligent risks according to their own rank among other members to gain the maximum possible profit. The shareholders can be divided into three different groups based on their performances.
i) Shareholders with High Ranks
This group allocates 10-30% of the market population known as elite members, which do not participate in the market exchange.
ii) Shareholders with Medium Ranks
The market share of the second group is changed in such a way that the whole share values of the group is constant. The share values of the individuals can be updated as
1
1 t 1
t
n
2
r
n
pop popn
t
n 1 y y t 1t
(
S
)
n
n
...,
,
3
,
2
,
1
y
1 1 t 1
g
k
Iter
g
g
g
g
max min , 1 max , 1 max , 1 k 1
In order to maintain the shares remain constant, each shareholder randomly sells some of the shares equal to the shares purchased. Hence, each shareholder reduces the share value which is given as follows.
where
n
t2is the total share value of tth member after employing share variations.IV.IMPLEMENT OF HOTS TO EEIMDPROBLEM
The different steps of HOTs for solving EEIMD problem are described in the Fig. 1.
V.SIMULATIONS AND COMPARISONS
To evaluate the performance of the proposed EMA in solving the EEIMD problem, computational simulations are conducted on designing two sample motors. Moreover, to further verify the effectiveness of the proposed algorithm, the other HOTs (GA and PSO) are employed for comparisons. For rational comparison, same values are chosen for similar parameters as used in the compared HOTs. Specifically, for the two sample motors, the population size is set to 20 and the maximum number of iterations is set to 100. The HOTs are implemented using MATLAB 7.1 on a core i3 processor with 2.40 GHz and 4 GB RAM, and is replicated for 20 independent runs. The specifications of the sample motors are given in Appendix. The annual active material cost, and annual active material, annual power loss and annual energy loss costs are considered in Case 1 and 2 respectively.
group(3)
k ) 1 ( group 1 , i
2
pop
pop
r
2
k ) 3 ( group k new ) 3 ( group
k
r
pop
0
.
8
S
pop
k
n
...
,
3
,
2
,
1
k
No
Yes
Fig. 1. Flowchart of HOTs based EEIMD problem
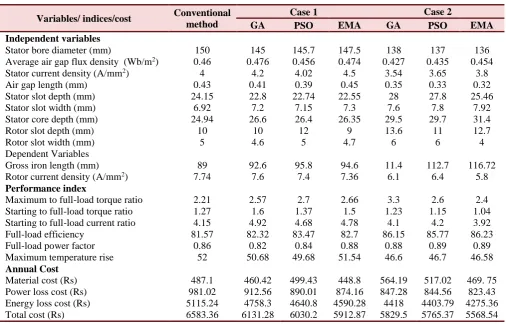
Table 1. Comparison of results of HOTS for 5 HP motor
Variables/ indices/cost Conventional method
Case 1 Case 2
GA PSO EMA GA PSO EMA
Independent variables
Stator bore diameter (mm) 150 145 145.7 147.5 138 137 136
Average air gap flux density (Wb/m2) 0.46 0.476 0.456 0.474 0.427 0.435 0.454
Stator current density (A/mm2) 4 4.2 4.02 4.5 3.54 3.65 3.8
Air gap length (mm) 0.43 0.41 0.39 0.45 0.35 0.33 0.32
Stator slot depth (mm) 24.15 22.8 22.74 22.55 28 27.8 25.46
Stator slot width (mm) 6.92 7.2 7.15 7.3 7.6 7.8 7.92
Stator core depth (mm) 24.94 26.6 26.4 26.35 29.5 29.7 31.4
Rotor slot depth (mm) 10 10 12 9 13.6 11 12.7
Rotor slot width (mm) 5 4.6 5 4.7 6 6 4
Dependent Variables
Gross iron length (mm) 89 92.6 95.8 94.6 11.4 112.7 116.72
Rotor current density (A/mm2) 7.74 7.6 7.4 7.36 6.1 6.4 5.8
Performance index
Maximum to full-load torque ratio 2.21 2.57 2.7 2.66 3.3 2.6 2.4
Starting to full-load torque ratio 1.27 1.6 1.37 1.5 1.23 1.15 1.04
Starting to full-load current ratio 4.15 4.92 4.68 4.78 4.1 4.2 3.92
Full-load efficiency 81.57 82.32 83.47 82.7 86.15 85.77 86.23
Full-load power factor 0.86 0.82 0.84 0.88 0.88 0.89 0.89
Maximum temperature rise 52 50.68 49.68 51.54 46.6 46.7 46.58
Annual Cost
Material cost (Rs) 487.1 460.42 499.43 448.8 564.19 517.02 469. 75
Power loss cost (Rs) 981.02 912.56 890.01 874.16 847.28 844.56 823.43
Energy loss cost (Rs) 5115.24 4758.3 4640.8 4590.28 4418 4403.79 4275.36
Total cost (Rs) 6583.36 6131.28 6030.2 5912.87 5829.5 5765.37 5568.54
Start
Read the specifications, and the lower and upper bounds of design variables of the motor
Initialize HOTs parameters
Generate a random population of design variables of the motor
Evaluate the objective function using Eq. (11)
Determine the optimal design variables
Is stopping criteria reached?
Output the Optimal design variables and their corresponding annual costs of the motor
End
Update the design variables of the motor using HOTs
Table 2. Performances of HOTs for 5 HP motor in the 20 trials
Compared item Case 1 Case 2
GA PSO EMA GA PSO EMA
Maximum cost (Rs) 6423.63 6217.36 6000.56 6116.2 5940.29 5770.64
Minimum cost (Rs) 6131.28 6030.2 5912.87 5829.5 5765.37 5568.54
Mean cost (Rs) 6293.2 6134.8 5970.38 5949.8 5803.1 5569.32
Standard deviation of cost (Rs) 81.2 61.61 40.52 86.8 65.45 39.7
CPU time (sec) 3.2 2.72 2.64 3.3 2.88 2.73
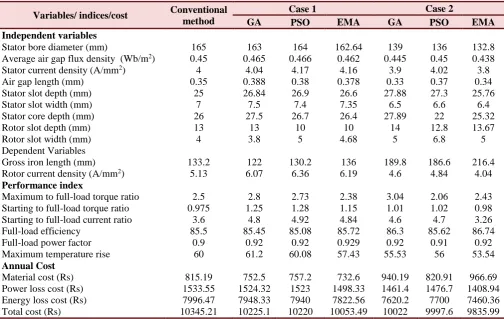
Table 3. Comparison of results of HOTS for 10 HP motor
Variables/ indices/cost Conventional method
Case 1 Case 2
GA PSO EMA GA PSO EMA
Independent variables
Stator bore diameter (mm) 165 163 164 162.64 139 136 132.8
Average air gap flux density (Wb/m2) 0.45 0.465 0.466 0.462 0.445 0.45 0.438
Stator current density (A/mm2) 4 4.04 4.17 4.16 3.9 4.02 3.8
Air gap length (mm) 0.35 0.388 0.38 0.378 0.33 0.37 0.34
Stator slot depth (mm) 25 26.84 26.9 26.6 27.88 27.3 25.76
Stator slot width (mm) 7 7.5 7.4 7.35 6.5 6.6 6.4
Stator core depth (mm) 26 27.5 26.7 26.4 27.89 22 25.32
Rotor slot depth (mm) 13 13 10 10 14 12.8 13.67
Rotor slot width (mm) 4 3.8 5 4.68 5 6.8 5
Dependent Variables
Gross iron length (mm) 133.2 122 130.2 136 189.8 186.6 216.4
Rotor current density (A/mm2) 5.13 6.07 6.36 6.19 4.6 4.84 4.04
Performance index
Maximum to full-load torque ratio 2.5 2.8 2.73 2.38 3.04 2.06 2.43
Starting to full-load torque ratio 0.975 1.25 1.28 1.15 1.01 1.02 0.98
Starting to full-load current ratio 3.6 4.8 4.92 4.84 4.6 4.7 3.26
Full-load efficiency 85.5 85.45 85.08 85.72 86.3 85.62 86.74
Full-load power factor 0.9 0.92 0.92 0.929 0.92 0.91 0.92
Maximum temperature rise 60 61.2 60.08 57.43 55.53 56 53.54
Annual Cost
Material cost (Rs) 815.19 752.5 757.2 732.6 940.19 820.91 966.69
Power loss cost (Rs) 1533.55 1524.32 1523 1498.33 1461.4 1476.7 1408.94
Energy loss cost (Rs) 7996.47 7948.33 7940 7822.56 7620.2 7700 7460.36
Total cost (Rs) 10345.21 10225.1 10220 10053.49 10022 9997.6 9835.99
Table 4. Performances of HOTs for 10 HP motor in the 20 trials
Compared item Case 1 Case 2
GA PSO EMA GA PSO EMA
Maximum cost (Rs) 10499.46 10413.23 10236.79 10299.65 10161.12 10023.67
Minimum cost (Rs) 10225 10220 10053.5 10022 9997.6 9835.99
Mean cost (Rs) 10338 10319 10148.37 10154 10060 9928.46
Standard deviation of cost (Rs) 87.67 55.76 38.6 84.23 50.6 40.67
CPU time (sec) 3.42 2.68 2.46 3.5 2.87 2.57
Fig 2. Convergence chracteristics of the compared HOTs for case 1(Motor 2)
Tables 2and 4 summarize the performances of the GA and PSO approaches are obtained in 20 runs. The results show that the proposed EMA algorithm gives less annual cost and takes less CPU time than the other HOTs.
VI.CONCLUSIONS
This paper compares three different heuristic optimization techniques (HOTs) viz., genetic algorithm, particle swarm optimization and exchange market algorithm to solve energy efficient induction motor design problems considering the annual power loss cost. A comparative analysis has been done for different HOTs with respect to the total minimum cost, solution quality and convergence criteria. The effectiveness of these techniques have been demonstrated and validated on two sample motors design viz., 5 HP and 10 HP motors. The results achieved are quite encouraging and indicate viability of the proposed technique to deal with other machine design and power system optimization problems. On comparison of all the three HOTs, the operation of EMA is found to be easier and its application is more flexible with respect to its solution quality and convergence criteria.
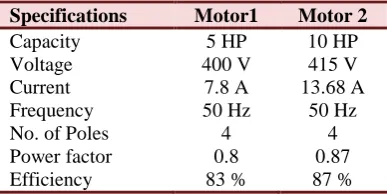
APPENDIX
Specification of Test Motors
Specifications Motor1 Motor 2
Capacity 5 HP 10 HP
Voltage 400 V 415 V
Current 7.8 A 13.68 A
Frequency 50 Hz 50 Hz
No. of Poles 4 4
Power factor 0.8 0.87
Efficiency 83 % 87 %
REFERENCES
[1] R. Ramarathnam, and B.G. Desai, “Optimization of poly-phase induction motor design – a nonlinear programming approach,” IEEE Trans. Power Apparatus and Systems, vol. 90, pp. 570-578, 1971.
[2] B.G. Bharadwal, K. Venkatesen, and R. B. Saxena, “Experience with direct and indirect search methods applied to cage induction motor design optimization,” Electric Machines and Electromechanics, vol.4, no. 1, pp. 85-93, 1979.
[3] C. Li, and A. Rahman, “Three-phase induction motor design optimization using the modified Hooke-Jeeves method,” Electrical Machines and Power Systems, vol. 18, 1990, pp. 1-12
[4] J. Appelbaum, E.F. Fuchs, and J. C. White, “Optimization of three-phase induction motor, part I: Formation of the optimization technique,” IEEE Trans. Energy Convers., vol.2, no. 3, pp. 407-415, 1987.
[5] J. Appelbaum, I.A. Khan, E. F. Fuchs, and J.C. White, “Optimization of three-phase induction motor, part II: the efficiency and cost of an optimum design,” IEEE Trans. Energy Convers., Vol. 2, No. 3, pp. 415-422, 1987.
[6] N.H. Feith, and H.M. EI-Shewy, “Induction motor optimum design including active power loss effect,” IEEE Trans. Energy Convers., vol. 1, no. 3, pp. 155-160, 1986.
[7] G. Fuat Uler, Osama A. Mohammed, and Chang-Seop Koh, “Design optimization of electrical machines using genetic algorithms,” IEEE. Trans. Magnetics, vol. 31, no. 3, pp. 2008-2011, 1995.
[8] Jan Pawel Wieczorek, Ozdemir Gol, and Zbigniew Michalewiez, “An evolutionary algorithm for the optimal design of induction motors,” IEEE Trans. Magnetics, vol. 34, no. 6, pp. 3882-3887, 1998.
[9] G.T. Bellarmine, R. Bhuvaneswari, and S. Subramanian, “Radial basis function network based design optimization of induction motor,” Proceedings of IEEE SOUTHEASTCON 2006, Memphis, Tennessee, USA, 2006, pp. 75-80.
Number of Iterations
A
nn
ua
l
C
ost (
R
s)
0 20 40 60 80 100
9500 9700 9900 10100 10300 10500
[10] R. Bhuvaneswari, and S. Subramanian, “Fuzzy logic approach to three-phase induction motor design,” Proceedings of the International Conference on Computer Applications in Electrical Engineering Recent Advances - CERA-05, IIT, Roorkee, India, 2005, Sept 28-Oct 1, pp. 505-509.
[11] R. Eberhart, and J. Kennedy, “A new optimizer using particle swarm optimization,” Proceedings of the 1995 Sixth International Symposium on Micro Machine and Human Science, pp. 39-43.
[12] Vadugapalayam Ponnuvel Sakthivel, Ramachandran Bhuvaneswari, Srikrishna Subramanian, “Economic design of three-phase induction motor by particle swarm optimization,” Journal of Electromagnetic Analysis and Applications, Vol. 2, No. 5, pp. 301-310, 2010.
[13] V.P. Sakthivel, R. Bhuvaneswari, and S. Subramanian, “Adaptive particle swarm optimization for the design of three-phase induction motor considering the active power loss effect,” International Journal of Computer and Electrical Engineering, Vol. 2, No. 4, pp. 627-636, 2010.
[14] V.P. Sakthivel, R. Bhuvaneswari, and S. Subramanian, “Design optimization of three-phase energy efficient induction motor using adaptive bacterial foraging algorithm,” COMPEL: The International Journal for Computation and Mathematics in Electrical and Electronic Engineering, Vol. 29, No. 3, pp. 699-726, 2010.
[15] D. B. Fogel, ‘Evolutionary computation: toward a new philosophy of machine intelligence,’ 2nd edition, Piscataway, NJ: IEEE Press., 2000.
[16] Naser Ghorbani and Ebrahim Babaei, “Exchange market algorithm,” Applied Soft Computing, Vol.19, pp.177-187, 2014. [17] Naser Ghorbani and Ebrahim Babaei, “Exchange market algorithm for economic load dispatch,” Electrical power and