ABSTRACT
MARSHALL, STEVEN. A Case Study of Fuel Use and Emissions of Non-Road
Construction Equipment. (Under the direction of Dr. William Rasdorf).
Construction of commercial buildings has a significant environmental impact and a large part
of this impact is due to emissions from nonroad equipment. Construction produces 7 percent
of the US greenhouse gas emissions and 76 percent of that is from engines. Therefore,
determining where and when construction produces emissions is an important next step.
Continual improvements in other industry sectors mean construction too needs to continue to
improve its emissions reduction efforts. Thus, emissions inventories (i.e. databases of project
emissions by type, cost, etc.) need to be developed to quantify these emissions for further
study. The emissions addressed in this paper include CO
2, NO
x, THC, CO, PM, and SO
2.
This thesis outlines one process for determining emissions from nonroad construction
equipment engines performing typical construction activities. The thesis presents a
methodology that provides a direct link between construction activities and emissions. It also
demonstrates the use of this methodology on a building case study, thereby providing
quantified emissions predictions for various levels of detail of the project (i.e. activity,
division, project) work breakdown. Using this methodology both fuel use and emissions can
be determined at any stage of the planning-design-build process with increasing levels of
precision being obtained as the project progresses. Key findings include the presence of
To identify the relevance this research has on the construction industry a connection is made
between the methodology and construction equipment fuel use. As an extension of this
connection emissions and fuel use data were developed in a time based format to parallel
with construction scheduling and resource allocation which both are common techniques
used in the construction industry. These industry connections serve to make the products of
A Case Study of Fuel Use and Emissions of Non-Road Construction Equipment
by
Steven Kelly Marshall
A thesis submitted to the Graduate Faculty of
North Carolina State University
in partial fulfillment of the
requirements for the degree of
Master of Science
Civil Engineering
Raleigh, North Carolina
11/29/10
APPROVED BY:
_______________________________ ______________________________
William
Rasdorf
Michael
Leming
Dedication
This work is dedicated to my family and specifically my parents. Without their support and
encouragement through school and college I would not be where I am today. My family has
been my foundation throughout life and I express my sincere thanks to them.
Biography
Steven Kelly Marshall was born and raised on the eastern shore of Maryland near the town of
Cambridge. He graduated from Cambridge South Dorchester High School in Dorchester
County, Maryland. Kelly went on to graduate Cum Laude with his Bachelors of Civil
Engineering from University of Delaware in the spring of 2008. He continued his studies at
North Carolina State University in the fall of 2008, seeking his Master’s of Science in
Construction Engineering and Management.
Kelly has worked each summer since his sophomore year of college seeking valuable
experience as an engineering intern. He began his internship experiences with the Delaware
Department of Transportation working in road and highway design. From there he
proceeded into construction inspection and began working with an engineering consultant,
Rummel, Klepper and Kahl (RK&K). When he moved to Raleigh, North Carolina he
continued working for RK&K in the Raleigh design division.
Kelly is a member of numerous academic organizations including Tau Beta Pi, National
Engineering Honor Society as well as Chi Epsilon the National Civil Engineering Honor
Acknowledgements
I would like to thank my advisor, William Rasdorf, for his guidance and expertise in helping
me develop this research. I would also like to thank Phil Lewis for his support and for
providing the groundwork which led to the ideas for this research.
I would like to acknowledge my committee members, Dr. Leming and Dr. Frey for providing
their time and expertise during the presentation and review of this research.
I would also like to acknowledge Reed Construction Data for providing their cost data (RS
Means) free in the form of RS Means CostWorks. This software and associated cost data
were integral to this research.
Table of Contents
LIST OF TABLES ... vii
LIST OF FIGURES ... viii
1.0
INTRODUCTION...1
1.1
Problem ...3
1.2
Research Objective ...4
2.0
SCOPE ...5
2.1
Included and Excluded Vehicles and Equipment ...6
3.0
BACKGROUND AND LITERATURE REVIEW ...7
3.1
EPA Sector Strategies Report ...9
3.2
Colorado State University Study - CEDST ...13
3.3
EPA/MRI Studies ...17
3.3.1
Particulate Emissions from Construction Activities ...17
3.3.2
Mud/Dirt Carryout as Particulate Emissions ...20
3.3.3
Study Comparisions ...22
3.4
Carnegie Mellon Study ...23
3.5
University of Illinois Urbana-Champaign Research ...28
3.6
North Carolina State University Research ...31
4.0
MODELS USED IN RESEARCH ...35
4.1
NONROAD Model ...35
4.2
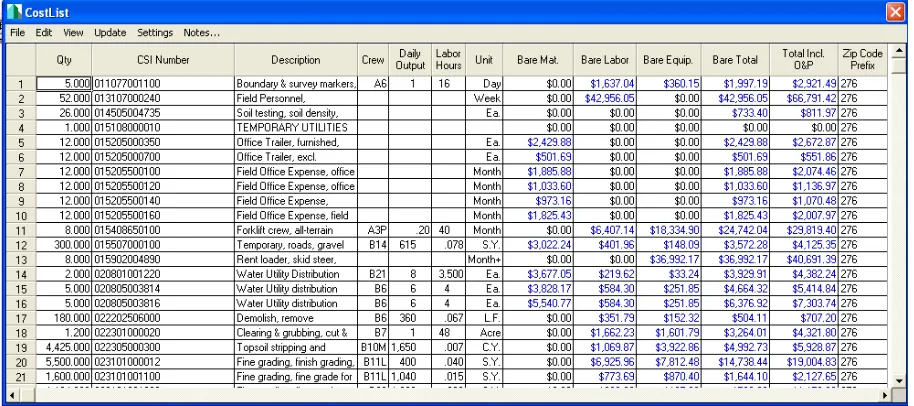
RS Means Cost Data ...36
4.2.1
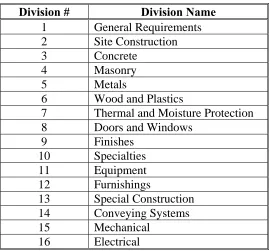
CSI Divisions ...39
5.0
METHODOLOGY ...40
5.1
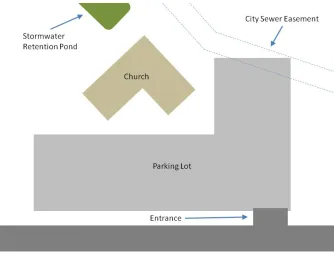
Selecting the Case Study ...40
5.1.1
Case Study Description ...41
5.2
Quantity Take Off and Cost Estimate ...43
5.3
Emissions Factors...46
5.4
Activity Level Emissions Analysis ...49
5.4.1
Selecting Equipment ...51
5.5
Time Based Emissions Analysis ...53
5.6
Fuel Usage ...55
6.0
RESULTS ...56
6.1
Cost Estimate ...56
6.1.1
Comparison of Costs ...60
6.1.2
Reconciliation of RS Means Estimate ...61
6.1.3
Validation and Use of Estimate ...65
6.2
Emissions Data ...66
6.2.1
Activity Level Emissions ...66
6.2.2
Division Level Emissions ...69
6.2.4
Time Based Emissions ...72
6.3
Fuel Usage Analysis ...77
7.0
CONCLUSIONS ...79
7.1
Activity Emissions ...79
7.2
Division Emissions ...80
7.3
Time Based Emissions ...81
7.4
Fuel Consumption ...84
8.0
RECOMMENDATIONS ...85
8.1
Activity Emissions ...85
8.2
Division Emissions ...86
8.3
Time Based Emissions ...87
8.4
Fuel Consumption ...90
9.0
REFERENCES ...91
List of Tables
Table 1-1 Example EPA Engine Tier Classification [EPA, 2004] ... 2
Table 2-1 Vehicle/Equipment List ... 7
Table 3-1 On Highway Truck Usage ... 25
Table 3-2 Activity Modes for Construction Equipment ... 33
Table 4-1 CSI Division Identification Table ... 39
Table 5-1 NONROAD Emission Factors for Crawler/Dozers ... 48
Table 5-2 Equipment Requiring Horsepower Information ... 52
Table 5-3 Example Analysis Table Layout ... 52
Table 6-1 Division Cost Comparison ... 58
Table 6-2 Sample Calculation of Total CO
2Emissions Estimates for the Concrete Division
... 67
Table 6-3 Emissions per Division (in Pounds) ... 70
Table 6-4 Emissions per Division (Percent) ... 71
Table 6-5 Total Project Emissions by Pollutant ... 71
List of Figures
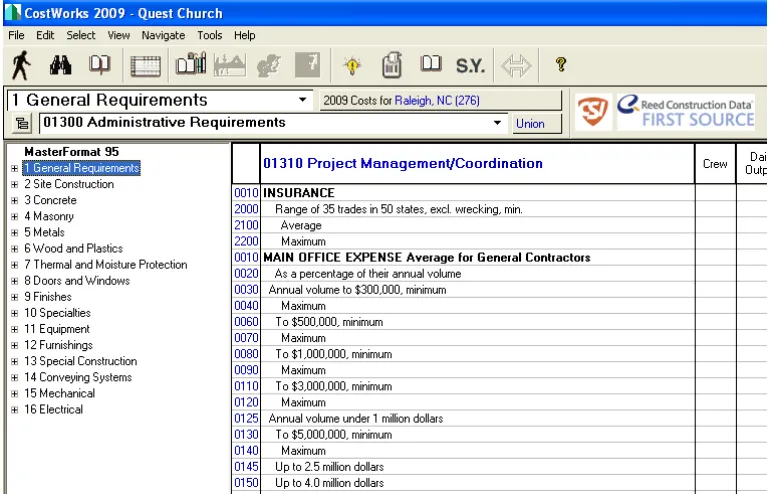
Figure 4-1 CostWorks Item Selection Window ... 37
Figure 4-2 CostWorks Quantity Input Field ... 38
Figure 4-3 Costworks Item List ... 38
Figure 5-1 Case Study Diagram ... 43
Figure 6-1 Means vs. SDI Correlation Graph ... 59
Figure 6-2 Week 7 Scheduled Activities with Associated CO
2Emissions ... 73
Figure 6-3 Cumulative Frequency Diagram for Emissions over Project Duration ... 75
Figure 6-4 Weekly CO
2Emissions over Project Duration ... 76
1.0
INTRODUCTION
Commercial building projects are a significant source of energy use and waste. Existing
research has studied the various aspects of construction’s environmental impact including life
cycle analysis, sector wide emissions, experimental emissions measurement, management
methods and techniques, cap and trade policies, and regulations. Emissions from diesel
engines are a key air-related contributor to the environmental impact associated with
construction. Construction of all types depends heavily on the use of diesel powered
vehicles. Onroad diesel emissions have been studied and regulated and for many years;
concern is now growing over nonroad, diesel powered engines [Millstein, 2009], especially
in light of their greenhouse gas production rate.
Engine emissions are a significant source of CO
2and other pollutants (NO
x, THC, CO, PM,
and SO
2) and merit significant study [EPA, 2009a]. Nonroad engines are of particular
interest because until recently, regulations for them were not as strict as for onroad vehicles.
Nonroad engines are now regulated using a tier 1 to tier 4 classification system. Table 1-1
depicts an example engine tier classification for engines between 50 and 75 horsepower,
similar standards exists for all other horsepower ranges. Currently, manufactured engines
must meet tier 4 requirements which, when fully implemented, will bring their emissions in
line with onroad vehicles [EPA, 2009b]. However there still exists a large fleet of older
equipment which produces more emissions than do newer models. Since fuel use and
use as one means to reduce emissions, especially for older equipment. It is also important to
know what emissions a construction project will produce and what construction processes are
significant emissions contributors in order to develop emissions management strategies for
the long term. This paper addresses these topics.
Table 1-1 Example EPA Engine Tier Classification [EPA, 2004]
Engine Horsepower
(HP)
Model
Years Regulation
Emission Standards (g/hp-hr)
HCa NMHC
+ NOx CO NOx PM
50 ≤ HP < 75
1998 – 2003 Tier 1 NS NS NS 6.9 NS
2004 – 2007 Tier 2 NS 5.6 3.7 NS 0.30
2008 – 2012 Tier 3 NS 3.5 3.7 NS 0.22
2008 – 2012 Tier 4 Transitional b NS 3.5 3.7 NS 0.22
2013 + Tier 4 Final b NS 3.5 3.7 NS 0.02
NS = No Standard a
Tier 4 standards are in the form of non-methane hydrocarbons (NMHC). b
The Tier 3 NOx standard of 3.5 g/hp-hr was implemented beginning in 2008. The Tier 4 Transitional standard also begins in 2008, leaving the Tier 3 NOx standard unchanged but adding a 0.22 g/hp-hr PM standard.
A study by Colorado State University sought to create a tool to assess the impact of the
construction phase [Guggemos and Horvath, 2006] but the result was a set of tables that was
separate and different from any standard industry accepted practice. This tool required a
great deal of knowledge regarding the means and methods of construction which meant that
the average designer would find it difficult to use without consulting the contractor. Other
studies focused on specific aspects of the environmental impacts such as dust and dirt as
use and specifically fuel use which directly effects engine emissions but did not suggest a
process to estimate emissions.
1.1
Problem
The results of a study to develop a tool to determine construction project emissions which
refers to the six primary Environmental Protection Agency (EPA) recognized air pollutants,
CO, CO
2, NO
x, SO
2, THC and PM, that can be easily integrated into conventional
construction management tools, are discussed in this report. Other environmental impacts
associated with construction projects such as waste and any impact from fabrication are not
included in this analysis. This study makes use of an industry standard estimating tool, RS
Means [Means, 2009], to develop an activity by activity cost estimate and with that assign
emissions to each activity.
This study intends to solve one of the current problems in quantitatively and practically
assessing the emissions impact of construction projects. Much of the environmental focus
regarding construction remains on building’s life cycle impacts, which is typically addressed
by the United States Green Building Council’s (USGBC) Leadership in Energy and
Environmental Design (LEED) certifications. This program emphasizes reducing the life
cycle impact of the building from electrical and water usage to ergonomics, with little to no
attention to means of construction. Thus far there have only been a few unsuccessful
non-road engine emissions. Furthermore only one other attempt at estimating project impact was
found using only data available prior to construction.
Another challenge with estimating emissions is that, unlike estimating project cost,
knowledge of the construction means and methods are needed. For this reason it is important
to use a cost estimating tool that links construction activities to construction means and
methods. The challenge with this requirement is the most likely entity to perform these
estimates is the design engineer or architect however the Designer of Record (DOR) typically
avoids specifying or providing any stipulations on construction means and methods. This is
mainly due to the liability presented by outlining a process or dictating means or methods.
Designers are generally not familiar enough with construction, and contractors may have
several different approaches from which to choose. The use of RS Means provides a tool
that can provide a link between cost and process.
1.2
Research Objective
The objective is to provide a method to quantify emissions from construction projects during
the design phase. The focus will be on nonroad construction equipment. Although fuel
usage is one method currently used to quantify emissions and is relatively accurate [EPA,
2009a], it is a post project completion method. The goal of this research is to develop a tool
faceted tool can be used to produce emissions estimates at various stages of the design, from
conceptual through final design.
The results of the research presented here describe a method to estimate pollutant emissions
of a construction project at various points in the design phase, including concept, preliminary
and final design. Based on that assessment, key emissions related project activities and
phases can then be identified.
2.0
SCOPE
This thesis is an extension of the studies conducted by Lewis, Frey, and Rasdorf [2009a] and
describes a method to quantify construction project pollutant emissions at activity, division,
and project levels. The work does not extend to a life cycle analysis of a project but involves
on construction activities performed on site necessary to complete construction of the project.
The research does not address emissions from fabrication, materials production, equipment
production, electricity use on site, or any task performed outside the confines of the
construction site. Additionally it addresses only the six primary pollutants (CO
2, NOx, THC,
CO, PM, and SO
2) and does not account for other environmental impacts such as waste,
heavy metals, runoff, or sediment.
Emissions reported herein are based on equipment identified in the RS Means crew lists.
vehicles because of the difficulty in quantifying their use allocation on a project by project
basis. Thus, this study specifically disregards any transport of materials or supplies that
occurs via onroad vehicles such as flat bed trucks or dump trucks. Although other research
suggests this is a valid assumption, some onroad vehicles used on a site will clearly be
emissions contributors [Guggemos and Horvath, 2006]. The method developed and
described in this thesis seeks to be straightforward and simple to allow maximum use within
the construction industry in both practice and additional research.
This thesis refers to emissions as being derived from an internal combustion engine. As
discussed, later there are other sources of pollutant emissions. These sources are important
but they are separate from engine-based pollutants and they are not addressed herein. The
case study used in this study is a church, a commercial construction project. The case study
includes all activities normally associated with this type of construction and utilizes typical
activity durations, costs, and crew compositions.
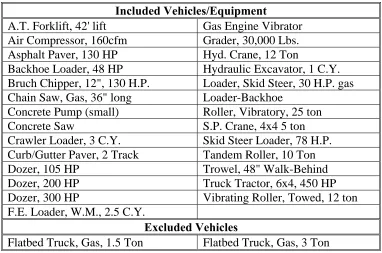
2.1
Included and Excluded Vehicles and Equipment
Labor, vehicles and other equipment where selected from the RS Means established crews.
Emissions were estimated for these crews and used to estimate emissions for each
construction activity. Due to the scope limitations outlined above, certain vehicles were
equipment with engines such as a concrete pumps, and heavy lifting equipment such as
cranes were all included in the emissions inventory. The only two vehicles or equipment
identified by RS Means that were excluded from the emission inventory were two flatbed
trucks (one 1.5 and one 3 ton). These vehicles are designed for and used primarily on the
road and thus are bound by different emissions standards and regulations. The focus of this
study was on equipment used entirely on the construction site. A complete list of all of the
included and excluded equipment for the case study is presented in Table 2-1.
Table 2-1 Vehicle/Equipment List
Included Vehicles/Equipment
A.T. Forklift, 42' lift
Gas Engine Vibrator
Air Compressor, 160cfm
Grader, 30,000 Lbs.
Asphalt Paver, 130 HP
Hyd. Crane, 12 Ton
Backhoe Loader, 48 HP
Hydraulic Excavator, 1 C.Y.
Bruch Chipper, 12", 130 H.P.
Loader, Skid Steer, 30 H.P. gas
Chain Saw, Gas, 36" long
Loader-Backhoe
Concrete Pump (small)
Roller, Vibratory, 25 ton
Concrete Saw
S.P. Crane, 4x4 5 ton
Crawler Loader, 3 C.Y.
Skid Steer Loader, 78 H.P.
Curb/Gutter Paver, 2 Track
Tandem Roller, 10 Ton
Dozer, 105 HP
Trowel, 48" Walk-Behind
Dozer, 200 HP
Truck Tractor, 6x4, 450 HP
Dozer, 300 HP
Vibrating Roller, Towed, 12 ton
F.E. Loader, W.M., 2.5 C.Y.
Excluded Vehicles
Flatbed Truck, Gas, 1.5 Ton
Flatbed Truck, Gas, 3 Ton
3.0
BACKGROUND AND LITERATURE REVIEW
Air pollution is a serious concern and vehicle emissions are a significant source of air
source of Greenhouse Gases (GHG) and seeks to reduce them using various methods [EPA,
2009a]. Greenhouse gases, when discussing construction, refers only to CO
2from fossil fuel
combustion [EPA, 2009a]. Carbon dioxide as well as the other pollutants mentioned above
are the main focus of the research in this paper because they are the main pollutants from
engine emissions. Diesel engines also emit particulate matter which is attributable to health
concerns [EPA, 2009b]. The other four pollutants studied in this research, CO, NO
x, THC,
and SO
2, are also important contributors to pollutant as identified by the EPA [EPA, 2005].
Currently there is only limited research directed at quantifying emissions from construction
equipment on a project level. Most research is directed at sector wide emissions and
environmental impact which is important, but construction is very diverse and emissions can
vary significantly from one sub-sector to another. An example of this would be drywall
installation versus highway and road construction where highway and road construction is on
the order of 19 times more emissions intensive than drywall installation [EPA, 2009).
Although these are two extremes within the construction sector, they serve to illustrate the
potentially large variations that can occur. Therefore, a sector wide emissions and impact
analysis does not provide the insight to allow for reductions at the micro level.
Although nonroad vehicles and equipment are not solely diesel powered, diesel engines “are
relative to onroad vehicles, new rules that provide for the reduction in emissions have been
put in place by the EPA. While the CO
2(a GHG) from these engines contributes to global
warming two other pollutants pose a serious health risk, these are Particulate Matter (PM)
and Nitrous Oxides (NO
x). These are both linked to serious health problems especially in
children and the elderly where they can cause breathing problems and asthma [Lewis et al.,
2009]. The new emissions standard (which will be implemented in two phases, the first
beginning in 2010) will significantly reduce NO
xand all but eliminate PM. This standard is
referred to as Tier 4 which is part of the EPA’s engine tier regulation system which began in
1994 with Tier 1. Although engine regulations will not affect existing engines and
equipment, the fuel regulations that are also a part of the new standard will provide
immediate reductions in PM because the new fuel regulations require a 99% reduction in
sulfur content. [EPA, 2009b]
3.1
EPA Sector Strategies Report
The EPA Sector Strategies division has identified the construction sector as an area for
potential reduction of greenhouse gases. In the report by the EPA, there are two components
to the construction sectors GHG emissions, fossil fuel combustion and purchased electricity.
According to the EPA, the third component of GHG emissions, non-combustion sources, are
insignificant contributors within the construction sector, although significant in other sectors.
The combined total, although dramatically less than Oil and Gas and Chemical sectors, is
76% of the GHG emissions from the construction sector which also is the third highest of all
sectors. This component is significantly higher than those sectors below it on the list. [EPA,
2009a]
The EPA also compares these emissions using emissions intensity which is the emissions per
dollar of value added. The EPA determines the value added based on the gross domestic
product (GDP). Although construction is third in GHG emissions, it has the lowest
emissions intensity according to the data presented by the EPA which was based on 2002
GDP and emissions data. Although having the lowest emissions intensity is not necessarily
bad, it does not represent the entire picture completely. A lower emissions intensity may
mean that a sector has a larger economic output in relation to its emissions output. However,
it does not mean that its emissions output is small. Therefore according to the EPA it is
important to study both total pollutant emissions and emissions intensity because both
provide valuable input into the sources and distribution of emissions. [EPA, 2009a]
EPA projections for the construction sector indicate that GHG emissions will not return to
2005 levels by 2030, however they will continue to increase slightly from current levels. The
average annual increase for construction, although small, was predicted to be the highest
The EPA identified several areas in which contractors have significant control and are key to
reducing overall project emissions. When discussing the emissions due to fossil fuel
consumption, the key to reducing emissions is to reduce fuel consumption. In order to
reduce fuel consumption, the EPA identified 4 areas that contractors could address relating to
the use of off highway equipment. These were equipment idling, maintenance and fuel
selection. The motivation to reduce fuel consumption however is not very strong in most
cases due largely because the cost of fuel in comparison to total operating costs has
historically been relatively small although that ratio is changing with increased fuel costs in
recent years. [EPA, 2009a]
Engine idling is an important means to reduce fuel use and emissions and many states
already have adopted laws to restrict idling times. Idling not only wastes fuel and produces
emissions it can also reduce engine life because each hour of idling can reduce engine life by
up to 2 hours especially if the optimum combustion temperature is not reached. In some
cases it has been found that heavy duty diesel trucks idle an average of 29.4% of their service
life. Additionally it was found that a reduction in idling of 10 hours per month per firm
could save about 1.4 billion pounds of CO
2per year. This would also equate to a reduction
in fuel consumption as both emissions and fuel consumption are directly linked.
Operators of equipment can also produce significant reduction if skilled and knowledgeable
regarding the operation of their respective equipment. An example of this would be an
excavator operator attempting to lift more than the capacity of the equipment. If this practice
were eliminated for an hour each day the savings could amount to 225 gallons of fuel or
slightly over 5,000 pounds of CO
2. Additionally, planning the construction process more
efficiently can help reduce fuel consumption and thereby emissions as well. A relatively
simple example of this would be reducing the swing angle of an excavator from excavation
to dump from 90 to 30 degrees could save up to 3% of fuel use for that task. [EPA, 2009a]
Equipment maintenance has an effect on fuel use as well. Properly maintained equipment
according to the EPA [EPA, 2009a] will often result in fuel savings but the amount depends
largely on the type of equipment. A significant example of this would be maintaining
properly inflated tires, since underinflated tires increase rolling resistance and thereby fuel
consumption and emissions. Not only is maintenance of equipment important, the proper
size of equipment is also important. Equipment that is undersized will need to work much
harder and be less efficient then a properly sized piece of equipment. The opposite is also
true, oversized equipment will consume more fuel than needed for a given task. This savings
would be specific to individual firms and tasks, and is hard to quantify. Replacing or
repowering equipment is another method to reduce emissions by both reductions in fuel use
the current EPA emissions standards for specific tiers. Older equipment can be retrofitted to
improve efficiency and provide emissions reductions. [EPA, 2009a]
The EPA identified other areas where changes in current practices could lead to reductions in
GHG emissions. Some of these related to fuel use include using biofuels, finding alternatives
to diesel generators and finding ways to reduce employee commuting. Another area of
importance is conservation of electricity as well as reducing the impact of the materials used
on a construction site. [EPA, 2009a]
3.2
Colorado State University Study - CEDST
A study by Colorado State University focused on developing a tool to identify the effect of
the construction phase of a commercial building. The study recognized the lack of valuable
information concerning the environmental impact of construction. The construction phase
represents a small portion of the life cycle environmental impact, only up to 12%. However
the study points out that as buildings become more energy efficient the effect of the
construction phase becomes more and more pronounced. [Guggemos, 2006]
Other aspects of commercial buildings have been studied mostly due to the heavy focus on
Leadership in Energy and Environmental Design (LEED). The CEDST study sought to
preliminary design. The study identified equipment usage for the construction process based
on RS Means. The equipment and their properties were listed in tables and from that the
emissions were calculated. [Guggemos and Horvath, 2006]
The CEDST study also incorporated the impact of fabricated materials such as steel and
includes the estimated construction waste. The goal with this study was to enable designers
to modify their designs based on the environmental impacts of various designs. Researchers
developed the Construction Environmental Decision-Support Tool (CEDST) to estimate
construction project emissions. This tool requires a detailed analysis of the project as it will
be constructed. CEDST is for commercial building construction and is self-contained. The
tool requires the user to input such things as project location, temporary construction
materials and equipment use and waste factors. Since transport and fabrication are included
in this tool, information about both of these is also required as part of the estimating process.
For the case study used in this research, required inputs were derived from 90% complete
plans and estimate. Researchers used RS Means to provide insight on means and methods of
construction. [Guggemos and Horvath, 2005 and 2006]
This study has some key similarities to the current research, including the primary goals.
They both seek to develop a tool for assessing the environmental impacts of construction
commonly used commercial building equipment and utilizes a division (and subdivision)
break down to further identify equipment use; conversely in this study the emissions are
estimated by construction activity. Both studies make use of a single case study to
demonstrate the methodology. In the Colorado State University research the case study is
very narrow being only construction of the structure of a commercial building. However,
this research sought to use a case study that encompassed a wide variety of work.
Additionally both made use of the EPA’s NonRoad Model for assigning emissions to
construction equipment and vehicles.
One major difference is the CSU study encompasses the impacts from fabrication of
materials such as steel. The impact is minimal, confirming that any impact from fabrication
is insignificant compared to other aspects of the projects. Additionally the CSU study did not
consider any impact due to site/earth work, which is very equipment intensive. Even the
most urban construction projects have site and earth work as part of the process. This is a
key difference between the CSU study and the research present here.
The CSU study provides emissions data for just the construction of the building’s structural
frame. The study found that fabrication (use of equipment off site) of materials is essentially
insignificant to the overall project emissions. When converted to tons the CSU study found
that approximately 1.1, 1.9, 110.2, 0.33 and 0.11 of CO, NO
2, CO
2. SO
2, and PM
102006]. This study considers other environmental effects besides air pollutants but it is
unclear what impact these other pollutants have in relation to the air pollutants. The other
pollutants include VOC’s and various heavy metals. In the study equipment contributed
more the 50% of all the air pollutant emissions and as mentioned above the offsite equipment
use (ie. fabrication) was insignificant. When the differences between the CSU study and the
research present here are considered the emissions listed above are comparable to the
findings presented here. The significant contributor is CO
2with NO
2and CO being much
less then CO
2but still 2
ndand 3
rdrespectively. However the values of NO
2and CO are
slightly higher in proportion. The higher value for CO may be explained by a significant
contribution in the CSU study attributable to vibrators, 58% of the total. It is a little unclear
where the increased value of NO
2can be accounted for other then the different kinds of
equipment accounted for. [Guggemos and Horvath, 2006]
An interview with the Dr. Guggemos confirmed some of the above observations. Dr.
Guggemos intended the CEDST tool to be all inclusive for emissions estimates. From
fabrication and manufacturing of equipment and materials to the actual on job emissions
from construction, the goal was to include all emissions associated with a project.
Additionally the study only considered the structural frame of the building. The study found
that temporary materials had a large impact on project emissions, in some cases equaling that
3.3
EPA/MRI Studies
Two research projects conducted by the National Risk Management Research Laboratory
(USEPA) in collaboration with the Midwest Research Institute discuss the effect construction
has on particulate emissions. The first of which (discussed below) sought to determine if
current practices for estimating and controlling PM are accurate and sufficient. The second
of which discusses specifically the effect of mud and dirt (fugitive PM) carryout from
construction sites. It is important to note that in the papers referenced and reviewed below
the term emissions refers to Particulate Matter (PM) only.
3.3.1
Particulate Emissions from Construction Activities
Midwest Research Institute completed a study on the discharge of particulate matter (PM)
from construction activities. PM is one of the six widely recognized air pollutants and is
often overlooked. Tests were conducted on various construction sites to observe the PM
levels from both controlled an uncontrolled earthwork as well as loading and unloading. The
PM from mud and dirt carryout was also observed as part of the study. The study collected
field data and compared the data to the calculated amounts according to the standard practice.
Two important goals where to determine if the PM
10emission totals calculated were accurate
and additionally whether the PM
10:PM
2.5ratio given in published literature is accurate. This
particular study only sought to determine whether or not current practices were accurate and
As described by researchers, current practices are based on EPA emission factors from 1975.
These emission factors assume that construction project emissions are constant over the
entire project with no variations due to materials, vehicles, etc. or from different phases. The
EPA updated this practice in 1993 to allow for a “unit operation” approach, which allows the
work to be broken down into parts and those parts estimated separately. Researchers
performed tests on various different construction operations and during all phases of
construction including a test of mud/dirt carryout which indirectly produces particulate
matter. The tests were performed using EPA accepted test methods for “measurement of
mass and particle size distributions.” Tests were conducted at several locations depending on
the activity being tested. Although these tests are primarily focused on mud, dust, and dirt as
particulate matter it is important to note that the test methods do in fact detect all types of
particulate matter including that from diesel engines. Thus, the researchers in this study do
take into account of the contribution of diesel engine exhaust to particulate matter in their
results. [Muleski, Cowherd, and Kinsey, 2004]
The results of this study varied significantly. In uncontrolled earthmoving activities there
were wide variations from one site to another with one having as much as 430 pounds per
1000 cubic yards (lb/1000 yd
3) and another only having 1.7 lb/1000 yd
3. These results were
from scraper loading operations. Changes within the individual activities also caused
consistent with each other and showed that an empty scraper’s PM discharge were
approximately half that of a loaded scraper. The EPA equation used to predict PM discharge
from unpaved roads under predicted the results from the transit operations. Particulate matter
discharge is categorized as either PM
2.5or PM
10and the ratio of the two is also important to
researchers. In the scraper loading operations one site had consistent results for the ratio
whereas the other site’s results were highly variable. Transit operations had consistent
results across all sites and in general were significantly lower than the loading operations.
[Muleski, Cowherd, and Kinsey, 2004]
Researchers performed a carbon analysis on the collected particulate matter to determine how
significant diesel engines were to the particulate matter levels. It was determined that the
contribution by diesel engines was more significant in the loading operations due in part
because the equipment moves slower and typically has to rev up the engine to efficiently
complete the loading operation. The researchers conducted tests on controlled earthmoving
which is the use of water on construction travel roads to suppress dust. The results show that
this method is effective but the effect decays over time as the soil dries after watering. There
were two aspects to this test the first was the control efficiency of the watering operation and
the second was the decay rate of the dust control. The control efficiency was dependent upon
the surface moisture content and was bilinear in relation. Control efficiency is gained rapidly
dependent upon a range of factors such as ambient temperature, relative humidity, and cloud
cover. [Muleski, Cowherd, and Kinsey, 2004]
This study is related to the work presented in this thesis because it discussed the impact of
construction activities on emissions and particularly in this case particulate matter emissions.
However this study is very different in terms of its methodology and its scope.
3.3.2
Mud/Dirt Carryout as Particulate Emissions
In this EPA paper the researchers sought to measure the impact of mud and dirt carryout
from construction sites as a source of particulate matter emissions. Prior to the study
measurements of PM
2.5at monitoring stations did not match up with the existing inventories
of emissions from dust and dirt. Therefore the researchers’ purpose was to determine the
contribution from and methods of control for PM from mud and dirt carryout. Researchers
found a test site with the required features and correct orientation to make use of ambient
winds. Along the chosen road three sampling stations were set up to enable the appropriate
amount of sampling. Each station had four sampling apparatuses with the middle station
setup to also monitor the carbon content to determine the contribution from car exhaust.
Samples were collected on filter fabric and weighed on scale that was calibrated frequently to
ensure the highest possible accuracy. Additionally other related measurements were taken
data was used to construct a time integrated emissions analysis with further integration with
traffic data for time periods where it is available. Additionally for some of the instruments a
least squares fit was performed on the distributions using a mathematical program. [Kinsey
et al., 2004]
Researchers first determined that PM
10emissions were significantly higher downwind from
the source versus upwind with high variation in the height profile. However PM
2.5emissions
were not significantly different downwind versus upwind and much less significant
differences over the height profile. Researchers determined the PM
10emissions factor from
the study to be about 6 grams per vehicle with the PM
2.5factor being about 3 percent of
PM
10. The PM
10factor falls within the EPA’s suggested range but the PM
2.5factor is
significantly lower. PM
2.5rates varied over the course of each day but did trend upwards in
the afternoon along with traffic volume. A comparison between the two sampling methods
used, continuous exposure profiling and time integrated, shows variations between the two,
which this study could not firmly account for and for which future studies would be needed.
[Kinsey et al., 2004]
The particle size of the samples collected was fairly consistent and comparable to related
literature. Two samples collected on different days and at different locations were consistent
with only one previous study and thus proving or disproving the study’s results. The final
matter contributable to vehicles. This was conducted by analyzing the elemental content of
the samples. Sulfur and Iron were significant in the samples due to the presence in both the
source material and vehicle exhaust. Other elements present in the source material showed
significant depletion in the samples taken from the air. Additionally a carbon analysis was
performed to determine the elemental and organic carbon levels in the samples. This found
the majority of the carbon in the samples was organic which is consistent with the volume of
light duty vehicles compared to diesel powered vehicles. [Kinsey et al., 2004]
3.3.3
Study Comparisions
This study is related to the work presented in this thesis because it discussed the impact of
construction activities on emissions and particularly in this case particulate matter emissions.
However that is where the similarities end and the research becomes very different. These
studies both mainly test existing methods for estimating particulate matter emissions from
mud, dust and dirt associated with construction projects. Particulate matter, which is one of
the six does not just come from engine exhaust but rather encompasses any particles that are
less than a certain diameter. For this reason mud and dirt carryout and dust from
construction are important sources of particulate matter in addition to that from engines.
Only particulate matter from engine exhaust are considered in this research and does not seek
to determine the effect of other sources. Although this research and the EPA/MRI studies
These studies also do not discriminate between exhaust related to construction and other
exhausts. The EPA/MRI studies collect data adjacent to construction and not on the site
which would further degrade the accuracy of the particulate matter totals attributable to
exhaust. These two characteristics essentially invalidate the exhaust component of the results
of these studies as construction project impacts. This thesis focuses on using standard tools
to estimate emissions prior to a project completion. Whereas these two studies by the EPA
and MRI conducted experiments to test current practices and develop experimental data for
future changes to the estimating procedures. Both have significant contributions to the area
of construction project environmental impacts but are have different focuses. These studies
scope of work is more environmental health whereas this thesis is focused on pollution and
greenhouse gas contributions.
3.4
Carnegie Mellon Study
Researchers at Carnegie Mellon developed a study relating to the impact of “Construction
Site Energy Use” on the environment. This paper is a comprehensive evaluation of the
construction sectors energy usage. This study evaluated the construction industries fuel
(gasoline and diesel), natural gas and electricity usage and compared each contributor to
other industries and users of those resources. For each contributor researchers presented the
total energy required to produce that resource. For example for electricity it takes a
gained by onsite consumption, 10,360 Btu per kWh produced versus 3,412 Btu gained on site
from a kWh usage [Sharrard, Matthews, and Roth, 2007].
Each category of energy consumption was further broken down by researchers to describe
where that particular resource is used within the construction industry. The breakdown of
diesel and gasoline use was very detailed. Based on the researchers sources they estimated of
the $11 billion spent on fuel $8 billion was for on road vehicles will the remaining
approximately $2.9 billion was for nonroad equipment and vehicles [Sharrard, Matthews, and
Roth, 2007]. The nonroad portion is used to power everything for heavy equipment like
bulldozers and excavators to welding machines and generators and smaller items such as
chainsaws and concrete vibrators. Researchers, to enable further analysis of on versus off
road vehicles, made the assumption that the Department of Commerce’s category of
“off-highway” corresponds to the “nonroad engine and vehicles” category used by the EPA.
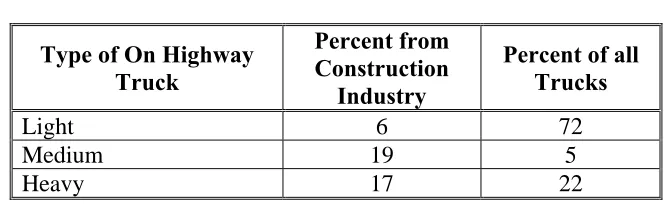
The researchers found that a vast amount of particulate matter from on highway vehicles is
attributable to diesel engine exhaust. From there they reasoned that the construction
industry’s contribution therefore is at least significant and should be accounted for.
Researchers believe that this area of study has been vastly overlooked and the majority of
focus is on quantifying off highway fuel use and emissions contributions. Based on their
that comes from the three classifications or types of trucks. These statistics are shown below
in Table 3-1. [Sharrard, Matthews, and Roth, 2007]
Table 3-1 On Highway Truck Usage
Type of On Highway
Truck
Percent from
Construction
Industry
Percent of all
Trucks
Light
6
72
Medium
19
5
Heavy
17
22
Note: Table derived from data presented in Sharrard, Matthews, and Roth, 2007.
The study by Carnegie Mellon also discussed the effect of the EPA’s nonroad diesel rules.
The researchers identified the lack of regulations or rather loose regulations in the past
referring to tier 1 to 3 regulations and the potential for construction sector emissions
reductions due to the new tier 4 regulations that phase in beginning in 2010. These
regulations are not sector specific but rather are generic for all nonroad engines. The new
regulations will drastically reduce the sulfur content of off road diesel fuel and reduce both
NO
xand PM emissions from the engines themselves. The study identifies particulate matter
from engines as a target of attention and significant regulation. In 1995 the EPA estimated,
for the first time, more particulate matter emissions from nonroad sources then from onroad
sources. Additionally, nonroad gasoline engines emit only a small fraction of the total
particulate matter emissions from nonroad sources and therefore diesel engines are have a
The use of generators on construction sites to provide electricity to satisfy remote and
immediate power needs was evaluated. A need was identified for case study related to
generator use since there are other means to providing the needed electricity. Due to the fact
that in many cases grid electricity produces fewer emissions than on site generation via a
generator and therefore presents a two fold opportunity to reduce emissions by both using
grid electricity whenever possible and through the increased regulation through EPA’s
engine tier requirements. The study points out that, based on an inventory of Canadian
generators, most generators used are less than 19kW and in Canada most are gasoline.
However the in the US there is a significant market for low powered diesel generators and an
attempt to reduce emissions by increasing regulation would simply cause a substitution of
gas powered generators for diesel due to the increased cost of the cleaner diesel generators.
This would bypass any emissions improvement from increased regulations. [Sharrard,
Matthews, and Roth, 2007]
Another discussion the researchers outlined was the implication and use of hybrid engines for
construction equipment. This idea borrows from the car industry and prevalent “hybrid
vehicles”, whereby an engine is used for two purposes. In this scenario a piece of
construction equipment would be slightly oversized and fitted with a generator to produce
generator when electricity is needed. This scenario’s success depends on the cost to oversize
a piece of construction equipment being less than the cost of a comparable generator to
provide the needed electricity. The researchers also briefly discussed the implications of
hybrid trucks that are now being produced by some of the major vehicle manufacturers.
[Sharrard, Matthews, and Roth, 2007]
This study by Carnegie Mellon provides a wealth of data regarding construction project
energy use both from electricity consumption and fossil fuel combustion. The researchers
found that construction accounts for approximately 3% of the US annual energy consumption
and government estimates only account for about half of what the industry actually uses.
Additionally they point out that the new EPA regulations (tier 4) will provide significant
reductions in both particulate matter and NO
xbut due to long equipment lifetimes and high
cost of replacement this benefit may not be realized for several years from now. [Sharrard,
Matthews, and Roth, 2007]
The research presented by Carnegie Mellon is a significant step towards quantifying the
construction sector emissions impact. This research has some key similarities with the work
presented here. Even though the researchers presented data and emissions from on and off
road vehicle and electricity use their purpose is to quantify the environmental impact of
construction project which is very similar to the purpose in this thesis. However the
whereas in the Carnegie Mellon study estimate energy use using fuel consumption, for
engines, and usage rates for electricity. Both also agree that the need for quantifying the
construction industry emissions and environmental impact is real becoming ever more
important.
Another source of agreement is the importance of nonroad vehicles in reducing the
construction sector’s impact. Even though onroad vehicles are identified by the researchers
as significant there is much more room for improvements in the nonroad vehicle and engine
component. However the researchers do not offer a methodology or tool to calculate
emissions or environmental impact but rather just seek to quantify the sector wide impact.
This thesis seeks to present a methodology or tool to calculate the emissions due to a single
project to help identify further any areas that can be reduced.
3.5
University of Illinois Urbana-Champaign Research
Researchers at the University of Illinois at Urbana Champaign (UIUC) have developed
studies on the greenhouse gas emissions due to construction. They first developed a
procedure for visualizing the emissions of a construction activity using geographic
information systems (GIS). GIS was chosen because of its ability to both display data and
perform spatial analysis on such data. With the addition of a CAD interface the visualization
GIS data is three dimensional and in this emissions analysis the construction site represented
the X-Y plane. (X, Y). Emission levels were represented using the third dimension. This
created a tin file with X, Y and Z coordinates that could then be plotted into a surface. This
showed the concentration of emissions in a three dimensional view. The result is a better
understanding of emissions and an improved ability to manage them. This information
provides a link between spatial and non spatial data related to construction and demonstrated
its use with a case study. [Ahn et al., 2009]
Managing of emissions on construction projects was subsequently evaluated due to the
importance of construction environmental impacts. UIUC researchers identified the
difficulty involved in controlling construction emissions since current regulations only
govern new equipment emission rates. Researchers found that “ISO 14001… suggests a
framework for managing the environmental impacts of activities… of an organization”
[Peña-Mora et al., 2009]. However they identify the difficulty associated with achieving the
goals establish by the ISO. Then researchers developed a method that would allow for better
managing of the emissions from a project. This method involved establishing the planned
activity/process and assigning emissions to that process to get the planned or estimated
activity emissions. Then using portable emission measuring devices the actual emissions are
monitored and compared to the plan and corrective actions are taken to mitigate overages that
occur. GPS technology also provide location information to allow for visualization based on
In the UCIC studies researchers found that GIS has a potential to improve construction but
the full potential has not been realized on construction projects as of yet. The integration of
spatial and non spatial data provides a more reliable picture of the construction process. This
integration and visualization can provide additional support in decision making on projects.
Successful integration of these technologies prove that construction can become more
technologically advanced and realize improvements from such advances. This type of
information and process can provide the ability to compare various aspects of a project and
help planners understand the overall impact. In addition, with this and other technologies, it
is possible to evaluate emissions prior to construction and monitor emissions during
construction and thereby provide the opportunity to mitigate the emissions effects of a
project. With this added methodology, evaluating the sustainability of construction
operations can become integrated into the construction operations. [Peña-Mora et al., 2009]
This research by UIUC is related to the work presented here. The two both seek to determine
the emissions of construction projects. While the research by UIUC provides a detailed
analysis of one activity this thesis strives to determine all the activities impact and thereby
the total projects impact. Both research projects use estimation tools to provide emissions
estimates of construction activity’s GHG emissions. This thesis examines six common
and estimated emissions for their research and focused on GHG emissions. The visualization
aspect of UI’s research was not duplicated in this research due to the lack of usability. The
ultimate goal of both projects is the development of data and methods for addressing the
environmental impact of construction and thus enabling the better management of that
impact.
3.6
North Carolina State University Research
The research conducted at North Carolina State University (NCSU) was the building block
for the research outlined in this paper. The researchers sought to develop datasets of diesel
engine emissions from nonroad construction equipment [Frey et al., 2007]. Fleets of various
construction equipment including backhoes, wheel loaders, motor graders as well as other
equipment were instrumented to record emissions during a range of different activities [Frey
et al., 2008b & Lewis, Frey and Rasdorf, 2010]. The study conducted by NCSU researchers
sought to build a dataset of actual emissions data where no previous data existed. Although
the EPA NONROAD model gives emissions based on engine size and type the model is
derived from engine dynamometer data adjusted with correction factors rather than on actual
measurement data. The NONROAD model cannot account for fluctuation in revolutions per
minute (RPM), engine tier or fuel consumption variations and provides engine horsepower
All these factors mean that the typical estimate from the NONROAD model should be higher
than the actual in most cases. Researchers at NCSU sought to develop comprehensive
datasets of experimental or actual emission rates of a variety of equipment to provide a
comparison to existing emissions models. The objective for the research was to obtain
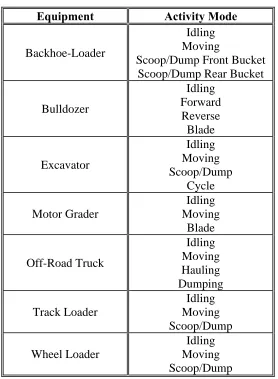
detailed data for a small group of equipment. Researchers choose eight different equipment
types and various activity modes depending on the equipment [Lewis, Frey and Rasdorf,
2009a]. See Table 3-2 for the activity modes utilized by NCSU researchers for tracking of
the emissions data. For each equipment type multiple pieces of equipment were
instrumented and tested. For the more popular and prevalent equipment up to eight were
tested but for each type a minimum of three were tested [Lewis, Frey and Rasdorf, 2009b].
Once researchers had the raw data it was compiled and separated by engine mode for each
Table 3-2 Activity Modes for Construction Equipment
Equipment Activity
Mode
Backhoe-Loader
Idling
Moving
Scoop/Dump Front Bucket
Scoop/Dump Rear Bucket
Bulldozer
Idling
Forward
Reverse
Blade
Excavator
Idling
Moving
Scoop/Dump
Cycle
Motor Grader
Idling
Moving
Blade
Off-Road Truck
Idling
Moving
Hauling
Dumping
Track Loader
Moving
Idling
Scoop/Dump
Wheel Loader
Idling
Moving
Scoop/Dump
Note: Table comes from Lewis, Frey and Rasdorf (2009b), table 3.2
![Table 1-1 Example EPA Engine Tier Classification [EPA, 2004]](https://thumb-us.123doks.com/thumbv2/123dok_us/1260534.1158629/12.612.96.531.240.351/table-example-epa-engine-tier-classification-epa.webp)
![Figure 5-2 Flow Chart Diagram of Methodology [Rasdorf, Lewis, and Frey, 2010]](https://thumb-us.123doks.com/thumbv2/123dok_us/1260534.1158629/54.612.96.541.86.303/figure-flow-chart-diagram-methodology-rasdorf-lewis-frey.webp)

