113
International Journal in Management and Social Science http://ijmr.net.in, Email: [email protected] A QUASI EXPERIMENTAL STUDY TO ASSESS THE EFFECTIVENESS OF HOT COMPRESSION VERSUS COLD COMPRESSION IN TERMS OF REDUCING PHLEBITISDUE TO INTRAVENOUS INFILTRATION AMONG PATIENTS, IN THE MEDICAL AND SURGICAL WARD OF SELECTED HOSPITAL GURUGRAM.
Ms. Sonika Chauhan , Prof.Sheuli Sen, Dr. Bhartendra Sharma
M.Sc.nursing 2nd year (Medical Surgical Nursing) Professor, Associate professor
Abstract
The purpose was to explore the effectiveness of hot compression versus cold compression and compare the effectiveness on phlebitis.A quasi-experimental equivalent time series design was used for the study .Conceptual framework of the study was Ladwig Von Bertanlanlaffy System Model. The population was 20-50 years of age of sick adults getting intravenous medicine at medical and surgical ward in Civil Hospital Gurugram .Non probability purposive sampling technique was used for selected subject. The sample comprised of 60 sick adults 20-50 years of age getting intravenous medication with phlebitis. The tool used were record analysis of selected variable and standardized phlebitis grading scale of Infusion nurses society standard practice 2011 .Data were collected through interview schedule and assessment method.
Major findings of the study:
114
International Journal in Management and Social Science http://ijmr.net.in, Email: [email protected]in that study group I, the post test mean score and SD of hot compression and cold compression (.8677±.628 ;.3000± .534).This was compared by independent t test which project t value is 1.672 which was statically significant at p>o.oo1 level. The computed t value shows that there was a significant decrease in level grade of phlebitis score after the application of cold compression
Conclusion: Hot compression and cold compression are both effective but cold compression is highly effective to reduce phlebitis. By practicing this technique routinely nurses can contribute to improve patients comfort level by reducing the intervention phlebitis.
Key words; Effectiveness, Hot compression, cold compression, phlebitis.
Background of the study:
Peripheral endovenous (I.V.) cannulisation is associate invasive procedure that predisposes the patient to associate accrued risk of native and general infection from micro-organisms introduced either at the time of insertion or when in situ. Peripheral I.V. cannula related infections are associated with increased morbidity, prolonged hospitalization and increased costs. Infections are most commonly caused by Staphylococci. The predominant source of these micro-organisms is likely to be from the patient’s endogenous flora colonizing the skin or from the hands of the health care practitioner.
PURPOSE OF THE STUDY:. The purpose was to explore the effectiveness of hot compression versus cold compression and compare the effectiveness on phlebitis
OBJECTIVES OF THE STUDY:
1) To determine the severity of phlebitis among the adult measured by phlebitis grading scale.
2) To determine the effect of hot compression on the phlebitis.
3) To assess the effect of cold compression on the phlebitis.
4) To compare the effectiveness of hot compression versus cold compression on phlebitis due
To intravenous infiltration among patients receiving intravenous infusion.
ASSUMPTIONS:
1) Patient’s receiving intravenous fluid infusion are at risk to develop intravenous infiltration.
2) Peripheral infusion may cause phlebitis due to mechanical as well as chemical interference
VARIABLES:
115
International Journal in Management and Social Science http://ijmr.net.in, Email: [email protected]Dependent Variable: Presumed effect is the dependable variable; in this study dependent variable is phlebitis in term of pain, edema, and erythema palpable venous cord and streak formation.
Extraneous Variables: Age of the patient ,Type of Intravenous fluid infusion ,Duration of intravenous cannulation, Type of intravenous fluid
HYPOTHESES:
All the Hypotheses were tested at 0.05 level of significance
H1: There will be significant difference in reduction of mean phlebitis assessment score in experimental group I after the application of hot compression.
H2: There is significant difference in reduction of mean phlebitis assessment score in experimental group II after the application of cold compression.
H3: There will be a significant difference in the effectiveness of hot compression versus cold compression in reducing the signs and symptoms of intravenous cannulation induced phlebitis among the patients.
CONCEPTUAL FRAMEWORK:
DELIMITATION OF THE STUDY:
Male and female in the age group of 25- 50 years of age having phlebitis
116
International Journal in Management and Social Science http://ijmr.net.in, Email: [email protected]Those who have phlebitis
RESEARCH METHODOLY
Fig 2: Flow chart of Research Methodology:
SYMBOLIC REPRESENTATION OF RESEARCH DESIGN
0 hour 12th hour 24th hour 36 the hour 48th hour 60th hour 72 the hour
EXP-I O1X1.1 O2x1.2 O3X1.4 O4X1.4 O5x1.5 O6X1.6 O7X1.7
EXP-II O1X2.1 O2x2.2 O3X2.4 O4X2.4 O5x2.5 O6X2.6 O7X2.7
Fig3: Schematic Representation of Research design
Interpretation of the symbol
O1,O2,O3,O4,O5,O6 Observation of phlebitis at 0 hour,12th hour,24th hours ,36th hours.48th hour,60th hour,72th hour respectively
XI-Treatment with hot compression at 0 hour,12th hour,24th hours ,36th hours.48th hour,60th hour,72th hour respectively
X2- Treatment with hot compression at 0 hour,12th hour,24th hours ,36th hours.48th hour,60th hour,72th hour respectively
Experimental X1-Hot compression
Experimental X2-Cold compression
Research APPROACH –Quasi Experimental
Research design –Time series Design
Setting of the study- Medical and surgical ward of Civil hospital Gurugram
Population of the study –adult from 20-50 years of age
Sampling Technique –Purposive sampling technique
117
International Journal in Management and Social Science http://ijmr.net.in, Email: [email protected]Tool Number Name of the tool Variables Techniques
Tool-I(A) Structured Interview
Schedule for obtaining demographic data
Demographic Variable
Questioning and analysis
Tool-I (B) Interview Schedule on
selected variable
Selected Variable Record Analysis
Tool-II Standardized Phlebitis
grading Scale
Status of the phlebitis
Observation and Assessment (Infusion Nurses Society)
Methods of data collection:
The necessary approval has been obtained .
Ethical permission from the respective Hospital.
Informed consent has been obtained from every subject based on the inclusion criteria who be included in the study after explaining the aim of the study and assuring them of the confidentiality of collected data .
A pilot study will be conducted on (10) each for experimental groups to test the tools for its clarity ,organization ,applicability and to determine the length of time needed to collected data.
FINDINGS OF THE STUDY:
Section 1: Description of the sample characteristics by frequency percentage
0 0.1 0.2 0.3 0.4 0.5 0.6
AGE 20-25 26-30 31-35 36-40 41-45 46-50
23% 28%
14% 17%
6% 12%
23%
33%
12% 17%
6% 12%
cold compression
118
International Journal in Management and Social Science http://ijmr.net.in, Email: [email protected]Fig 4: Pyramid diagram showing percentage distribution of age of the sick adults with phlebitis.
Section 1: Description of the sample characteristics by frequency percentage
Fig 5: Bar diagram showing percentage distribution of sex of the sick adults with phlebitis in group-I and group –II
Section 1: Description of the sample characteristics by frequency percentage
0% 20% 40% 60% 80%
hot compression cold compression
43%
0%
37%
57% 63%
male
Female
40%
27% 33%
0% 24%
13%
3%
27%
0 0.1 0.2 0.3 0.4 0.5
Duration of hospital
staying
1-3 days 4-6 days 7-9 days 10 above
hot compression
119
International Journal in Management and Social Science http://ijmr.net.in, Email: [email protected]Fig 6:Bar diagram showing percentage distribution of duration of hospital staying among sick adults with phlebitis in group-I and group –II
Section 1: Description of the sample characteristics by frequency percentage
Fig 7:Pyramid diagram showing percentage distribution cause of hospitalization among sick adults with phlebitis in group-I and group –II
Section 1: Description of the sample characteristics by frequency percentage
0 0.1 0.2 0.3 0.4 0.5 0.6 0.7
3% 37%
30%
30% 27%
16% 33% 23%
cold compression
hot compression
0 0.1 0.2 0.3 0.4
40%
23% 20% 17%
40% 40%
20% 0%
hot compression
120
International Journal in Management and Social Science http://ijmr.net.in, Email: [email protected]Fig 8:Cylindrical diagram showing percentage distribution type of fluid among sick adults with phlebitis in group-I and group –II
Section 1: Description of the sample characteristics by frequency percentage
Fig 9:Cylindrical diagram showing percentage distribution duration of fluid among sick adults with phlebitis in group-I and group –II
Section-2: Evaluation of severity of phlebitis as measured by phlebitis grading scale
0 0.1 0.2 0.3 0.4 0.5 0.6
Duration of IV fluid
1-4 hours 5-8 hours 9-12 hours Abve 12 hours 7%
23%
57%
13% 10%
57%
13% 20% Hot compression
cold compression
0% 5% 10% 15% 20% 25% 30% 35% 40% 45%
0%
30%
43%
23%
0% 0%
23%
43%
33%
0%
pre hot compression
121
International Journal in Management and Social Science http://ijmr.net.in, Email: [email protected]Figure 10: Bar diagram showing that before receiving hot compression 13(43%) adult had grade 2 phlebitis. Whereas before receiving the cold compression 13(43%) of adult have
grade 1 phlebitis
Figure 11 : This bar diagram showing that after receiving of hot compression 18(60%) of adult have grade 1 phlebitis ,whereas after receiving the cold compression 22(74%) of adult have grade 1 phlebitis
Section 3: Findings related to determine effect of hot compression on grade of phlebitis and pain score among adult patient before and after receiving of hot compression.
N=30
Group
Mean ± SD
Mean difference
Standard error mean
Paired ‘t’
df P value Table ’t’ value
Pre hot compression
2.1±.758
1.23 0.78 15.7 29 .00 1.69
Post Hot
compression
.8677±.628
**Significant at .001 level, ’t’ (29) =1.69 ,p≤.00 level
Table depicts that comparison of mean of post test of grade of phlebitis score is lower then the pretest score .This was compared by using paired t test which project t value is 1.69 .Which was statically significant at p<.001 level .The computed t value shows that there was a significant decrease in level of phlebitis score after the application of hot compression.
0 0.1 0.2 0.3 0.4 0.5 0.6 0.7 0.8
0 0%
13%
60%
26%
0% 0% 3%
23% 74%
Post Hot Compression
122
International Journal in Management and Social Science http://ijmr.net.in, Email: [email protected]Section 4: Findings related to determine effect of cold compression on grade of phlebitis and pain score among adult patient before and after receiving of cold compression
N=30
Group Mean±S D
Mean difference
Standard Error mean
Paired ‘t’
df P value Table ‘t’ value
Pre cold
Compression
1.9±.758 1.60 .189 8.44 29 .000 1.69
Post cold compression
.300±.53 4
**Significant at 0.0001 level ’t’ (29) =1.69 ,p≤.000 level
Table depicts that comparison of mean of post test of grade of phlebitis score is lower than the pretest score .This was compared by using paired t test which project t value is 1.69 .Which was statically significant at p≤ .00 levels. The computed t value shows that there was a significant decrease in level of phlebitis score after the application of hot compression.
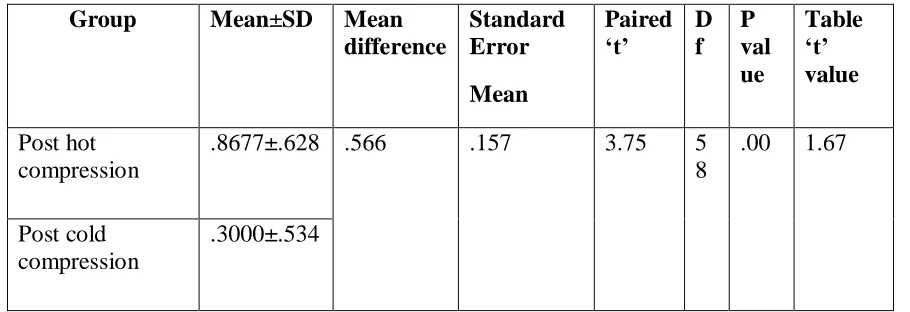
Section 5: Findings related to compare the effectiveness of hot and cold compression on grade of phlebitis and pain score among adult patient before and after receiving of hot compression.
N=60
Group Mean±SD Mean difference
Standard Error
Mean
Paired ‘t’
D f
P val ue
Table ‘t’ value
Post hot compression
.8677±.628 .566 .157 3.75 5
8
.00 1.67
Post cold compression
.3000±.534
123
International Journal in Management and Social Science http://ijmr.net.in, Email: [email protected]Table signifies that comparison of mean, SD, of post –test phlebitis score between both groups1 and II who received hot compression and cold compression. Data depicts in that study group I, the post test mean score and SD of hot compression and cold compression (.8677±.628 ;.3000± .534).This was compared by independent t test which project t value is 1.672 which was statically significant at p>o.oo1 level. The computed t value shows that there was a significant decrease in level grade of phlebitis score after the application of cold compression.
Conclusion: In study both hot compression and cold compression are both effective but cold compression is more effective in reduce phlebitis.
Limitation: 1)The study was confined to a specific geographical area which imposes limit for generalization.
2) Limit sample size.
Recommendation:
1) The same study can be conducted on a larger sample over a longer period of time to increase the generalizability.
2) The same study can be conducted in different settings such as nursing homes, community centers.
3) The same study can be conducted in pediatrics and old age people.
4) A study can be conducted to find out the long term effects of painful.
REFERENCES:
1. Chowdhary Roy SS. Textbook of Nursing Research Methods and Application 7th Edition
.JB Lippincott Company. 2004: 293-298.
2. Polit DF, Hungler B.P Essential of Nursing Research –Method and application.7th
edition. JB Lippincott Company; 2004:290-291.
3. Burns N, Groove SK.The practice of Nursing Research, 3rd Edition W.B Saunders
Company 1997: 34.
4. Indryan A. Basic Methods of Medical Research .3rd edition AITBAS Publishers, India;
2013: 370-390.
5. Polit DF, Beck TC. Nursing analysis generating and Assessing proof for nursing observe.
8th Edition. Wolter Kluwer (India) pvt .ltd. 2011:340.
6. Burns N, Groove SK. The practice of Nursing Research.3rd Edit W.B Company 1997: