Disk failures in the EOS setup at CERN
A first systematic look at 1 year of collected data
DirkDuellmann1,∗and AlfonsoPortabales1,∗∗ 1CERN, Geneva, Switzerland
Abstract. The EOS deployment at CERN is a core service used for both scien-tific data processing, analysis and as back-end for general end-user storage (eg home directories/CERNBOX). The collected disk failure metrics over a period
of 1 year from a deployment size of some 70k disks allows a first systematic analysis of the behaviour of different hard disk types for the large CERN
use-cases.
In this contribution we describe the data collection and analysis, summarise the measured rates and compare them with other large disk deployments. We further describe initial steps to use the collected failure and SMART metrics to develop a machine learning model predicting imminent failures and hence avoid service degradation and repair costs.
1 Introduction
After the initial run periods, all LHC experiments are now preparing for a phase with signif-icantly increased data volume and rates. In view of the large size of the storage deployment at CERN with almost 100k disk drives and the expected increase, the storage group at CERN conducted a systematic study of media failures in the current system as starting point for fur-ther optimisation of the storage deployment costs. The expected benefits are two-fold. We aim to
• reduce the human effort (service and client side) caused by recovery from media failures • take advantage of detailed statistics about media failures at CERN to choose the media type
best suited for use cases and deployment environment.
In order to achieve these goals we establish and successively improve a predictive model to inform device acquisition and to proactively relocate data in case of a imminent media failure.
2 SMART disk metrics and studies outside HEP
Self monitoring metrics like the so-called SMART metrics (Self Monitoring Analysis and Reporting Technology) are provided today by most SATA drives, but previous studies of SMART collections often did not reach applicable conclusions, due to multiple reasons.
• The metric semantics is usually vendor- or even model-dependent which impedes the anal-ysis of heterogeneous disk populations.
• Only few published deployments have reached a scale that supports a detailed analysis of individual disk models with higher statistics.
• Past studies have often been focused on a few selected metrics and used a simple, for example cut-based categorisation approach. Today more sophisticated machine learning methods are available and promise to improve the classification performance by taking into account many smart metrics without a large model development or computational burden. Among the promising work in the SMART area have been studies by Backblaze, Google and IBM, which could demonstrate good prediction performance[2, 3, 6]. In this initial study we have used part of the disk population in the EOS[1] deployments at CERN.
2.1 Challenges: data availability and data quality
At the time when our study started, CERN (as many other computer centres) did not per-form a systematic collection of detailed SMART metrics. The operational monitoring of the CERN storage group collected only a status summary (eg good vs bad) for each disk, which unfortunately is not suitable as input to a predictive model.
Our results can not yet profit from full statistics of the data collected today in the CERN computer centre. We plan to update our results for the full population of CERN storage devices over the next 12 months that is now collected. Our study presented is hence not a designed measurement but an attempt to opportunistically exploit the data that was available to us. In order to achieve comparability with existing result we contacted Backblaze and followed their methodology as as closely as our data availability allowed.
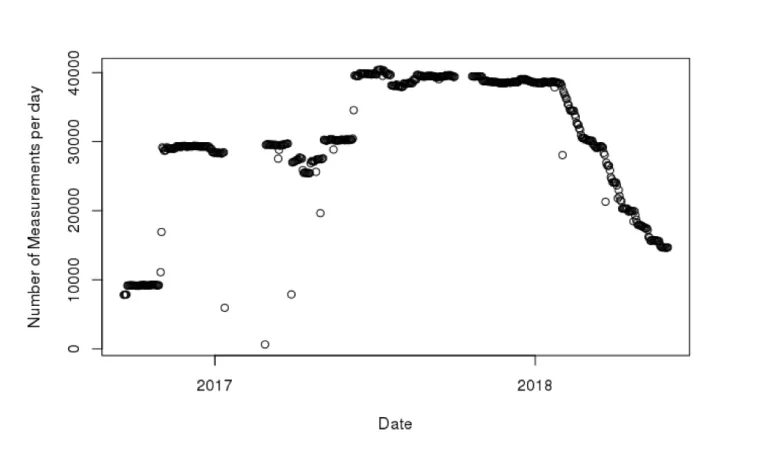
The basic data model we used for our study is quite simple: We found disk metrics for a period of 620 days, out of which, due to operational problems of the sensor, only 551 days contained useful measurements. Also the coverage of the EOS disk population due to disk sensor problems varied significantly over the measurement period between 635 and 40563 disks with an average of 31700 probed devices per day. Taking into account the influx of new devices and the retirement of older or broken devices a total of 45874 unique disks has participated. As figure 1 shows, the number of probed disks shows significant variations and from beginning of 2018 a continuous drop of recorded metrics due to an unobserved sensor configuration problem. To avoid a systematic bias, we choose to constrain our initial analysis to the stable plateau before the year 2018.
Since the disk drives are acquired and deployed successively to the EOS service in groups at various times throughout the year, the resulting distributions for drive age and measured deployment days show a non-trivial structure reflecting the service deployment history.
2.2 Defining drive failure
In order to get quantitative results that can be compared with other studies it is important to chose a metric that is well defined, correlated to true device failures and only minimally affected by systematic measurement errors. Similar as in the approach used by Backblaze we have chosen to use the rate of single disk replacements:
• we consider drives which after some point in time fail to report data as “candidate” for a disk failure.
• The metric semantics is usually vendor- or even model-dependent which impedes the anal-ysis of heterogeneous disk populations.
• Only few published deployments have reached a scale that supports a detailed analysis of individual disk models with higher statistics.
• Past studies have often been focused on a few selected metrics and used a simple, for example cut-based categorisation approach. Today more sophisticated machine learning methods are available and promise to improve the classification performance by taking into account many smart metrics without a large model development or computational burden. Among the promising work in the SMART area have been studies by Backblaze, Google and IBM, which could demonstrate good prediction performance[2, 3, 6]. In this initial study we have used part of the disk population in the EOS[1] deployments at CERN.
2.1 Challenges: data availability and data quality
At the time when our study started, CERN (as many other computer centres) did not per-form a systematic collection of detailed SMART metrics. The operational monitoring of the CERN storage group collected only a status summary (eg good vs bad) for each disk, which unfortunately is not suitable as input to a predictive model.
Our results can not yet profit from full statistics of the data collected today in the CERN computer centre. We plan to update our results for the full population of CERN storage devices over the next 12 months that is now collected. Our study presented is hence not a designed measurement but an attempt to opportunistically exploit the data that was available to us. In order to achieve comparability with existing result we contacted Backblaze and followed their methodology as as closely as our data availability allowed.
The basic data model we used for our study is quite simple: We found disk metrics for a period of 620 days, out of which, due to operational problems of the sensor, only 551 days contained useful measurements. Also the coverage of the EOS disk population due to disk sensor problems varied significantly over the measurement period between 635 and 40563 disks with an average of 31700 probed devices per day. Taking into account the influx of new devices and the retirement of older or broken devices a total of 45874 unique disks has participated. As figure 1 shows, the number of probed disks shows significant variations and from beginning of 2018 a continuous drop of recorded metrics due to an unobserved sensor configuration problem. To avoid a systematic bias, we choose to constrain our initial analysis to the stable plateau before the year 2018.
Since the disk drives are acquired and deployed successively to the EOS service in groups at various times throughout the year, the resulting distributions for drive age and measured deployment days show a non-trivial structure reflecting the service deployment history.
2.2 Defining drive failure
In order to get quantitative results that can be compared with other studies it is important to chose a metric that is well defined, correlated to true device failures and only minimally affected by systematic measurement errors. Similar as in the approach used by Backblaze we
have chosen to use the rate of single disk replacements:
• we consider drives which after some point in time fail to report data as “candidate” for a disk failure.
• we then further exclude candidates which have left the deployment population together with other drives from the same host. This addition requirement does exclude for example device loss due to disabled disk-server hosts or other correlated outages.
Figure 1.Variations in metric collection
• lastly, we exclude from the list of candidates drives which (potentially sometime later) report from a different disk server. This allows us to exclude disk replacements to repair
another machine, which take place at a low rate in the CERN computing centre.
2.3 First results
This above definition is easy to determine by comparing the unique serial number of each drive. As a side effect, this method allows us to track quantitatively the hardware flow through
the computer center.
The candidate rate defined in the last section – a good estimate for the true failure rate – we obtained was 0.89%±0.05%stat. for a population with an average drive age of 1095 days.
This corresponds for the observed EOS population to on average one drive replacement every 1.6 days. These values are significantly lower than the previous estimate based on operator
records in the CERN operations ticketing system[7].
2.4 Preliminary results by drive type
In this first study we can only give preliminary differential results – eg the failure rate by
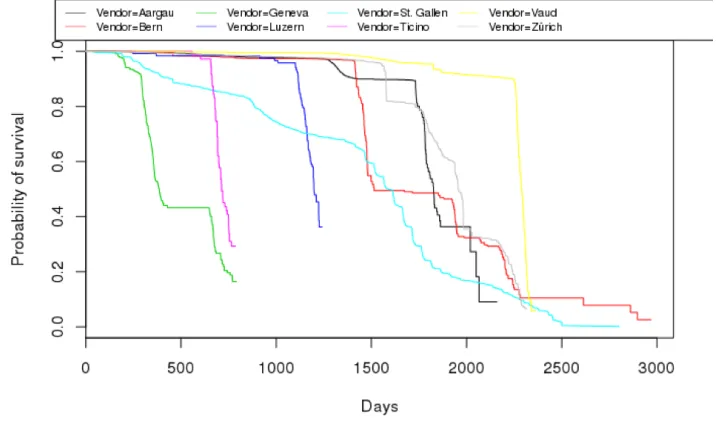
vendor and model. To evaluate and visualise the rate of failure vs survival from sometimes incomplete input metrics, we have used the estimator introduced by Kaplan and Meier[5], which is frequently used in clinical studies. As implementation we used the “survival” pack-age which is available at CRAN[4].
As can be seen in figure 2, we have very different measurement samples for the different
vendors/model combinations. The deployment duration and hence sample size is mainly
center1. We hence decided to replace the configuration names with Swiss Canton names as
placeholders .
Figure 2.Kaplan-Meier survival curve: days in service by vendor
With the above caveat concerning the limited statistics, we include here in table 1 the data for individual models together with the average drive age. Due to the above limitations, we can at this point not significantly confirm an increased failure rate with drive age.
Table 1.Replacements by “Vendor”
Vendor Replacement Rate MD complete Avg. Age SD Age
[%/yr] [%] [days] [days]
Vaud 1.84 17 2214 245
Luzern 0.00 1 1149 169
Aargau 0.32 14 1717 277
Geneva 0.40 2 412 157
Ticino 2.39 1 722 51
Bern 0.25 17 1481 256
Zürich 1.45 44 1888 330
St.Gallen 4.52 6 1424 633
2.5 Evaluation of failure correlation with temperature
Since our collected metrics also include the temperature measured by a sensor on the drive, we can directly probe for correlations between data center temperature and device failure. For 1These significant differences in deployment duration can with our data be quantitatively evaluated with respect to their impact on the total service TCO.
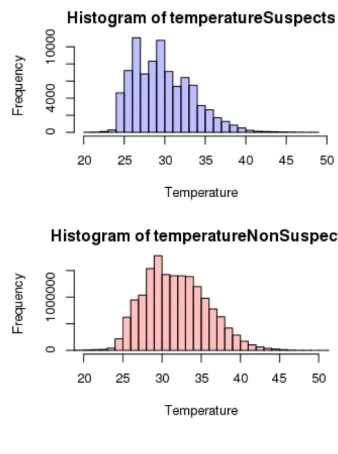
a first overall impression we compared in figure 3 the two device groups — the drives with suspected failures and the drives that are still operational — and compare their respective temperature distributions. As the histogram and box plot show, both distributions show a similar shape and width with tails towards high temperatures.
Based on the average temperature that shown as central line in the box plot, we obtain a slightly lower average operational temperature for replaced drives than for operational units, but this difference of about 2 degrees is not significant with respect to the total spread of
the measurements. This result does not support the suspicion of a failure correlation with increasing operational temperature.
Figure 3.Correlation with device temperature
3 Summary and next steps
The storage group at CERN has performed a first systematic long-term analysis of disk fail-ures across the CERN data centers. The study has been performed opportunistically, within the limits of available data sources, awaiting the deployment of a more suitable data center disk sensor in 2018.
The annualised failure rate for the EOS storage service has been obtained as 0.89%, which is significantly lower than expected from previous estimates. We further do not see a signif-icant correlation between failure rate and operating temperature of the drives in the EOS system.
During the last year, the CERN fabric team has developed an improved disk sensor, that moved into full deployment at CERN as of November 2018. After moving our analysis chain to the new input format, we are now covering a population of roughly twice the number of drive units. With the increased data quality, number of metrics and drive population, we expect to soon be able to give differential results by drive vendors and models and to
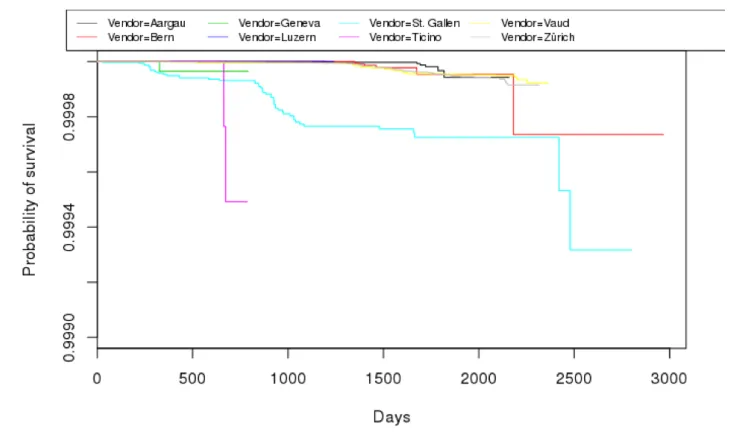
Figure 4.Disk survival rate by vendor corrected for data center operations
decisions). Further the new data set will now allow us to train a predictive model based on decision tree and LSTM classifiers.
References
[1] L. Janyst et al.: Exabyte scale storage at CERN, J. Physics: Conf. Vol. 331. No. 5. IOP Publishing (2011)
[2] E. Pinheiro et al., Failure Trends in a Large Disk Drive Population, Proceedings of 5th USENIX Conference on on File and Storage Technologies (FAST’07), (2007)
[3] A. Klein, Behind the Curtain of Backblaze Hard Drive Stats, 33rd International Confer-ence on Massive Storage Systems and Technology, MSST (2017)
[4] The Comprehensive R Archive Network, https://cran.r-project.org
[5] E.L. Kaplan and P. Meier, Nonparametric estimation from incomplete observations, J. Amer. Statist. Assoc. 53 (282), pp 457–481, (1958)
[6] M. Botezatu et al. , Predicting Disk Replacement towards Reliable Data Centers, Pro-ceedings of the ACM SIGKDD Conference, (2016)