J. WilliamGary1,∗
1Department of Physics and Astronomy, University of California, Riverside, CA 92521, USA
Abstract.Two recent studies from the BABAR experiment at SLAC on low-energy hadronic final states ine+e−
annihilations are presented. The first study provides the first-ever measurement of theγ∗γ∗→η0
transition factor, whereγ∗
denotes an off-shell photon. The second study provides the first-ever measure-ments of thee+e−→π+π−π0π0π0andπ+π−π0π0ηcross sections, including
stud-ies of the intermediate resonance states and the correspondingJ/ψandψ(2S) branching fractions.
1 Introduction
The BABAR experiment at SLAC operated at the PEP-II asymmetric-energy electron positron collider between 1999 and 2008. Despite having ceased operation 10 years ago, the data analysis is still very active. The BABAR data set is still rather unique and continues to provide important new information. There have been seven BABAR papers submitted to journals so far in 2018, with three or four more submissions expected before the end of the year. The BABAR detector provided precise measurements of momentum for charged tracks and had excellent particle identification capabilities. Although it was primarily designed for the study of CP violation inBmeson decays, its general purpose design made it suitable for a wide variety of other physics studies, such as those discussed here. The vast majority of the BABAR data was collected at the peak of theΥ(4S) resonance. The analyses presented here make use of 470 fb−1of data collected at or 40 MeV below theΥ(4S) peak, corresponding to ane+e−center-of-mass (c.m.) energy of about 10.6 GeV.
2 The
γ
∗γ
∗→
η
0transition form factor
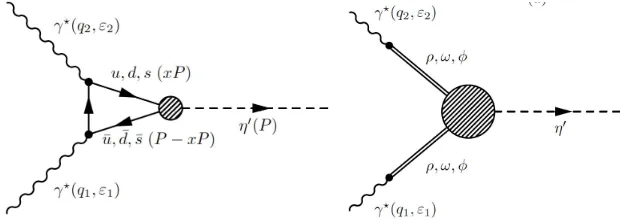
The first topic presented here is a measurement of theγ∗γ∗→η0transition form factor (TFF). This result was recently submitted to Physical Review D [1]. A Feynman diagram is shown in Fig. 1. This is a two photon process, in which both the initial electron and initial positron emit a highly virtual photon. The two virtual photons combine to produce theη0meson. The electron and positron are both scattered away from the beam direction and are observed in the detector. This, the two-photon events used in this analysis are double tagged.
The TFF is defined via the amplitudeT for theγ∗γ∗→η0transition:
T =−i4παµνβγ1µ2νqβ1qγ2Fη0(Q2
1,Q 2
2) (1)
Figure 1.Feynman diagram for the two-photon processe+e−→ e+e−η0
.
whereαis the fine structure constant,1,2andq1,2are the polarization vectors and 4-momenta, respectively, of the two virtual photon,µνβγis the Levi-Civita tensor, andFη0is the TFF. The
photons are space-like and so theq21,2are negative. It is thus convenient to defineQ12,2=−q21,2
so that the arguments of the TFF are positive.
Figure 2.Diagrams illustrating the (left) perturbative QCD and (right) vector meson dominance model descriptions of theγ∗γ∗→η0
process.
The TFF describes the effect of the strong interaction on theγ∗γ∗ → η0 reaction, and the measurement of theγ∗γ∗ → η0 TFF can be used to provide a novel test of QCD. Two models have been used to describe the TFF: perturbative QCD (pQCD) and the vector meson dominance (VMD) model. Diagrams illustrating theγ∗γ∗→η0transition in the two models are shown in Fig. 2. The hatched circles in the two diagrams indicate the QCD interactions that are described by the TFF.
Two previous measurements of the TFF of the η0 have been presented: one from the CLEO experiment [2] and a more recent and precise one from BABAR [3]. However, these two studies were based on the single-tag mode γ∗γ → η0, with only one off-shell photon. For only one off-shell photon, pQCD and the VMD model both predict the same asymptotic behavior for the TFF, namely Fη0(Q2) ∼ 1/Q2, and therefore the two models
cannot be distinguished. In contrast, for two off-shell photons, as in the present study, the pQCD and VMD asymptotic predictions differ and therefore the pQCD result can be tested:
Fη0(Q2
1,Q 2
2)∼1/(Q 2 1+Q
2
2) for pQCD and∼1/(Q 2 1Q
2
2) for VMD.
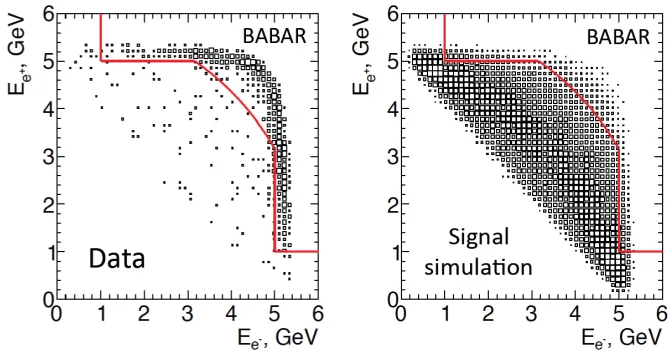
Figure 3.Scatter plots for (left) data and (right) signal event simulation of the final-state positron c.m. energy versus the final-state electron c.m. energy. Events below and to the left of the solid (red) line are retained.
Background is rejected with selection criteria applied in the plane of the final-statee+and
e−c.m. energiesEe+andEe−. The scatter plots for the data and for Monte Carlo (MC) signal
simulation are shown in Fig. 3. The data, dominated by background at this stage, demonstrate that, for background events, either the final statee+ore−usually has the full beam energy of the initiale+ore−. The signal simulation shows that, for signal events, both thee+ande− have usually lost much of their initial energy. Signal events are selected by retaining events below and to the left of the red solid line.
Figure 4 shows the distribution of the η versus theη0 candidate mass for the selected events. The distributions are shown both for the (left) data and (right) signal simulation. Within the signal box, shown by the rectangle at the center, there is a significant clustering of events in the data, consistent with the expectation from the signal simulation. Thus, a clear signal is seen. The background is small. Only events within the signal box are retained for further analysis.
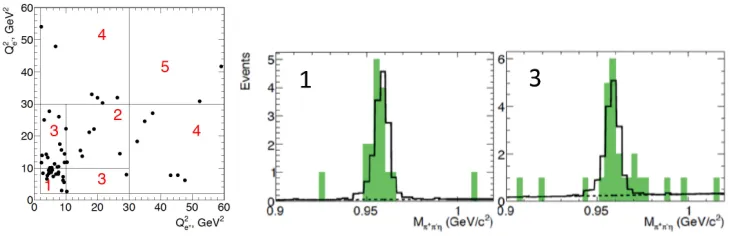
The selected events are binned in five intervals ofQ2e−versusQ
2
e+ as illustrated in Fig. 5
Figure 4.Scatter plots for (left) data and (right) signal event simulation of the candidateηmass versus the candidateη0
mass. The signal box is indicated in the figure.
Figure 5. (left) The intervals inQ2
e−versus Q2e+ used for theγ∗γ∗ → η0 TFF measurement. (right) Distribution of data (solid, green histograms) and fit results (solid curve) for the signal and background components in regions 1 and 3. The dashed curve shows the fitted prediction for the background.
The double-differential cross section
d2σ
dQ21dQ22 =
1
RLB
d2N
dQ21dQ22
is measured in each of the five intervals, whereis the detection efficiency,Ris a radiative correction accounting for initial-state photon radiation,Lis the integrated luminosity, andB is the product of theη0→π+π−ηandη→γγbranching fractions. The measuredγ∗γ∗→η0 TFF, denotedF2(Q21Q22), is given by
F2(Q21Q22)= [d
2σ/(dQ2 1dQ
2 2)]data
[d2σ/(dQ2 1dQ
2 2)]MC
F2η0(Q21Q22)
whereF2
η0(Q21Q22) is the predicted TFF from simulation. The nominal F2η0(Q21Q22) is based
on pQCD. Consistent results for F2(Q21Q22) are obtained using the VMD prediction for
F2η0(Q21Q22). The model uncertainty is evaluated by repeating the calculation assuming a
con-stant TFF.
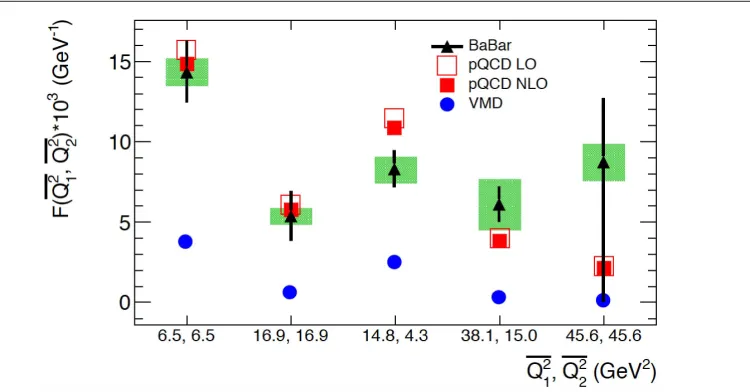
Figure 6. The measuredγ∗γ∗ → η0
transition form factor (triangles) in the five intervals of (Q2 1,Q
2 2)
in comparison with the predictions of pQCD at leading- (open squares) and next-to-leading- (filled squares) order and with the predictions of the vector meson dominance model. The error bars on the data points are statistical. The (green) rectangular shaded areas show the systematic uncertainties.
the open and filled (red) squares, respectively. The data are seen to generally agree with the predictions of pQCD. Higher order corrections have only a small impact on the pQCD predictions. The VMD predictions are shown by the filled (blue) circles and generally are in strong disagreement with the data.
3 The
e
+e
−→
π
+π
−π
0π
0π
0and
π
+π
−π
0π
0η
cross sections
The second topic presented here is a measurement of thee+e−→π+π−π0π0π0andπ+π−π0π0η cross sections. This result is still preliminary. It is to be submitted to Phys. Rev. D sometime soon. This study represents the latest chapter in the long-standing and extensive BABAR program to measure all possible exclusive low-energye+e− → hadrons final states. These measurements are needed as input in order to determine the standard model prediction for the muon anomalous magnetic moment g−2, a topic of great current interest because of the observed discrepancy of around 3.5 standard deviations between this prediction and the data [4]. The study of these cross sections is also interesting in its own right, providing precise new information on low-energy hadron spectroscopy and decay rates.
The study is based on the initial-state radiation (ISR) method to measure low-energy cross sections. A photon is radiated from either the incoming electron or positron in ane+e−
The study of intermediate states within the hadronic system is also interesting and im-portant. It sheds light on the hadron production process and can be used to test theoretical predictions. From a practical point of view, it is also important: knowledge of the interme-diate resonance structure can be incorporated into the MC simulations to reduce systematic uncertainties in the experimental acceptance and reconstruction efficiencies, which depend on the intermediate states since different intermediate resonances lead to different distribu-tions of energy and angles in the final-state particles, and thus to different acceptances and efficiencies.
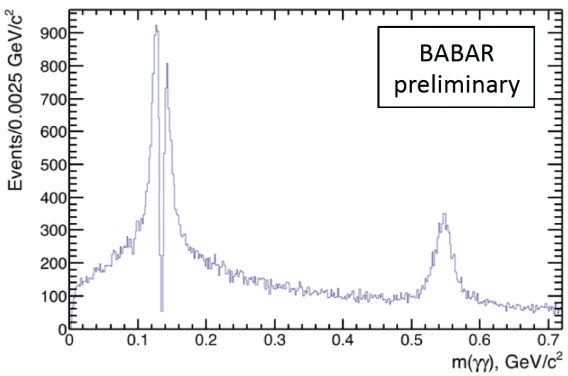
Figure 7.Invariant mass of the third photon pair in the selectede+e−→π+π−π0π0γγevents.
The selection of the e+e− → π+π−π0π0π0 andπ+π−π0π0η events begins by requiring that an event contain exactly two charged tracks of opposite sign that are inconsistent with being a kaon or muon and that extrapolate to near the interaction point. An ISR photon candidate and at least six other photon candidates must be present. The six non-ISR photon candidates are combined into three pairs (15 different possible combinations for each set of six examined photons). The diphoton invariant mass of two of the pairs must be consistent with theπ0mass. A kinematic fit is performed to thee+e−→π+π−π0π0γγsignal hypothesis, constraining two 2γcombinations to the π0 mass and treating the remaining two photons as being independent. That way, both theπ+π−π0π0π0 andπ+π−π0π0ηevents are selected. The combination of the six photons that yields the smallest χ2
2π2π02γγ
IS R is selected, with a requirement thatχ2
2π2π02γγ
IS R < 60. Background is rejected by performing the analogous fit to the chief background process,e+e−→π+π−π0π0γ
IS R, and requiring the correspondingχ2
to exceed 30. The invariant mass of the third photon pair in the selected events in shown in Fig. 7. Peaks at theπ0andηmasses are clearly visible. The double peak at theπ0mass is an artifact of theπ0mass constraint.
The background is subtracted using 1) a data sideband defined by 60 < χ2 2π2π02γγ
IS R < 120 to evaluate ISR backgrounds and 2) simulation normalized to data using data control regions to evaluate non-ISR backgrounds. The cross section fore+e−→π+π−π0π0π0is then calculated as
σ2π3π0(Ec.m.)=
dN2π3π0(Ec.m.)
dL(Ec.m.)(Ec.m.)(1+δR)
,
Figure 8. The measurede+e− →π+π−π0π0π0cross section. The right-hand plot shows an expanded
view around the charmonium region.
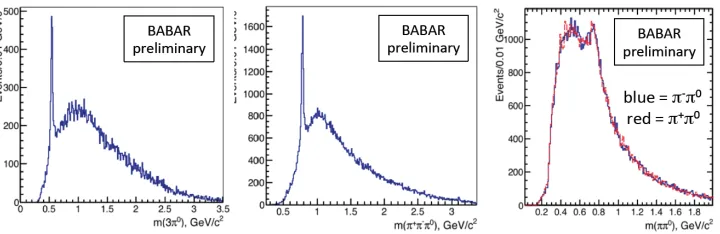
Figure 9. The dominant intermediate resonance structure observed ine+e− → π+π−π0π0π0 events:
peaks at the (left)η→3π0, (center)ω→π+π−π0, and (right)ρ±→π±π0masses.
wheredLis the effective integrated luminosity at hadronic system c.m. energyEc.m.,is the reconstruction efficiency, and the radiative correction 1+δR accounts for final-state photon
radiation.
The resulting e+e− → π+π−π0π0π0 cross section in shown in Fig. 8. The cross section below around 2 GeV is the data that is relevant for the muong−2 calculation. This is the first measurement of this cross section. ClearJ/ψandψ(2S) peaks are visible. The corresponding branching fractions, measured for the first time, areB(J/ψ→π+π−3π0)=(27.0±2.8)×10−3 andB(ψ(2S)→ π+π−3π0) =(5.2±0.9)×10−3. The intermediate state structure is studied and is found to be dominated by 1)e+e−→ηπ+π−(includinge+e−→ηρ), withη→π0π0π0 (Fig. 9 left), 2)e+e− → ωπ0π0withω→ π+π−π0 (Fig. 9 center), and 3)e+e−→ ρ±π∓π0π0 withρ±→π±π0(Fig. 9 right).
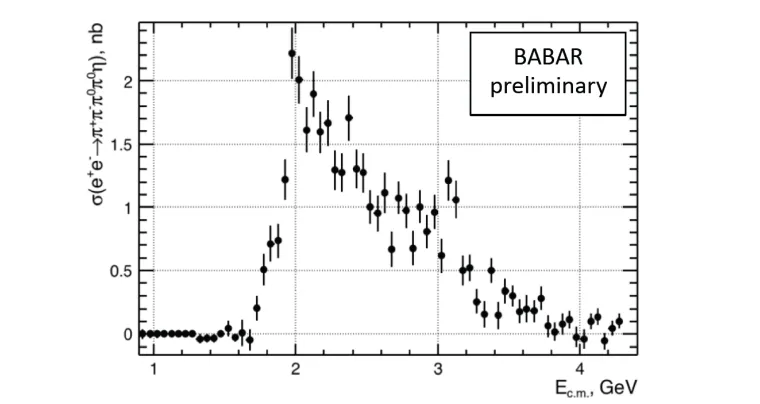
The analogous procedure is followed to measure thee+e− → π+π−π0π0ηcross section. The result is shown in Fig. 10. A clearJ/ψpeak is seen. The result for theJ/ψbranching fraction isB(J/ψ→π+π−π0π0η)=(2.3±0.5)×10−3. We do not observe a significantψ(2S) signal in this channel and set a limit at 90% confidence level B(ψ(2S) → π+π−π0π0η) < 0.35×10⁻³. These are the first measurements of this cross section and of the corresponding
Figure 10.The measurede+e−→π+π−π0π0ηcross section.
Figure 11. The dominant intermediate resonance structure observed ine+e− → π+π−π0π0ηevents:
peaks at the (left)ωandφ→π+π−π0and (right)ρ±→π±π0masses.
ωπ0ηande+e− → φπ0ηwithω,φ → π+π−π0 (Fig. 11 left) and 2)e+e− → ρ±π∓π0ηwith
ρ±→π±π0(Fig. 11 right).
4 Summary
[2] CLEO Collaboration, J. Gronberg et al. Phys. Rev. D57(1998) 33.