Article
1
Effect of Niobium and Yttrium modified Ti-based
2
bulk amorphous alloy on correlation of plastic
3
deformation energy and ductility
4
Shengfeng Shan1*, Bing Zhang2, Yuanzhi Jia2 and Mingzhen Ma2
5
1 Department of Physics, Jining University, Qufu, 273155, China; [email protected]
6
2 State Key Laboratory of Metastable Materials Science and Technology, Yanshan University, Qinhuangdao
7
066004, China; [email protected]
8
* Correspondence: [email protected]; Tel.: 086-0537-8074723
9
10
11
Abstract: A series of Ti40Zr25Cu9Ni8Be18)100-xTMx (x = 0, 1, 2, 3, 4 at.%, TM = Nb, Y) Bulk amorphous
12
alloys were designed and prepared using the copper mold casting method. The microstructures,
13
glass forming ability and mechanical properties of the alloys were investigated by means of X-ray
14
diffractometry (XRD), scanning electron microscopy (SEM), transmission electron microscopy
15
(TEM), differential scanning colorimetry (DSC), depth-sensitive nanoindentation and uniaxial
16
compressive test. The Bulk amorphous alloys with different ductility were investigated by
17
measuring their plastic deformation energy (PDE) of the first pop-in events during loading. The
18
relationships between the PDE value, shear band formation and ductility in Bulk amorphous alloys
19
have been investigated. The results show that the PDE value decreases by the Nb addition and
20
promotes the generation of multiple shear bands easily, which increase the fracture strength and
21
plasticity significantly. Substituting Nb with Y has exactly the reverse effect. A useful rule for
22
preparing of Bulk amorphous alloys with high plasticity is herein proposed, whereby the chemical
23
composition of the Bulk amorphous alloys can be tailored to possess a lower PDE value.
24
Keywords:
Plastic deformation energy; Nanoindentation; Bulk amorphous alloy; Shear band25
1. Introduction
26
Bulk amorphous alloys have excellent properties such as high strength, high hardness and low
27
modulus of elasticity, making them a very good application prospect as structural
28
materials[1-4].Researchers have developed multi-component bulk amorphous alloys such as
29
Pd-based, Zr-based, Fe-based, Co-based, Ni-based and Ti-based[5-7]. However, the plastic rheology
30
of amorphous alloys imited to the shear bands is achieved by localized shear deformation[8,9]. The
31
deformation characteristics of amorphous result in very low room temperature plasticity, which
32
limits its application as structural materials[4]. In recent years, many methods have been used to
33
avoid brittle fracture due to local shear failure and further improve the mechanical properties of
34
bulk amorphous alloys. For instance, the methods include changing the crystallization mode of
35
amorphous alloys by adding elements like Ag, Pd, Au, Pt or Y in the preparation of amorphous
36
composite materials[10,11], precipitating quasicrystal or nanocrystals in an amorphous matrix by
37
annealing process and generating ductile phase dendrites in situ from the amorphous matrix by
38
adding high melting-point elements like Ta, Nb, etc in amorphous alloys[12,13]. The second phase
39
interacts with the shear bands to limit the shear slip of the amorphous matrix on its maximum shear
40
stress surface and improves the plastic deformation ability of the bulk amorphous alloy[14]. The
41
unique atomic structure of amorphous alloy is different from the dislocation and grain boundary
42
defect of crystalline alloy. The generation and expansion of shear bands have a great influence on the
43
plasticity of amorphous alloys and play an important role in the deformation and fracture process of
44
amorphous alloys[15].
45
The nanoindentation of the depth-sensing technology has been applied to measure the
46
mechanical properties of materials[16]. The advantages of nanoindentation technology in testing
47
mechanical properties of materials are as follows: First, compared with traditional measurement
48
techniques, nanoindentation has accurate measurement results of displacement and stress in
49
microscale materials, such as microstructure changes by pressure-induced phase and shape
50
transformation that cannot be involved in traditional techniques[17,18]; The deformation area of
51
nanoindentation measurement is very small, which reduces the influence of material defects on the
52
measurement of mechanical properties[19,20]. It can be used to measure the properties of materials,
53
such as theoretical strength of materials. More importantly, the sawtooth flow (pop-in) during
54
nanoindentation testing is related to plastic deformation[21].The researchers performed
55
nanoindentation tests on Pt-based, Zr-based, Fe-based, Cu-based, and Ni-based amorphous alloys,
56
calculated the actual deformation volume and plastic deformation work caused by the indentation
57
depth during the shear bands generation during compression and obtained the plastic deformation
58
energy (PDE) during deformation[22].
59
In this paper, the nanoindentation test of Ti40Zr25Cu9Ni8Be18 amorphous alloy was carried out by
60
using spherical indenter. The relationship between the addition of Nb/Y and the PDE, shear bands
61
formation, and plastic deformation of amorphous alloy was also studied.
62
2. Materials and Methods
63
Zr, Ti, Cu, Ni, Be, Nb and Y pure metals were melted by electric arc under the protection of high
64
purity argon gas, and at least three times of smelting to ensure the uniformity of chemical
65
composition. Then, a plurality of alloy rods having a diameter of 3 mm and having a composition of
66
Ti40Zr25Cu9Ni8Be18)100-xTMx(x = 0, 1, 2, 3, 4 at. %, TM = Nb, Y) were prepared by copper mold cooling.
67
The D/max-2500/pc X-ray diffractometer of Japan Ricoh was used to conduct diffraction analysis on
68
the cross section of the sample; The microstructure of the sample was observed by JEM-2010
69
high-resolution transmission electron microscope. The sample was cut into a cylindrical sample of
70
ø=3 mm, L=6 mm. The room temperature quasi-static compression test was carried out at a strain
71
rate of 2×10⁻⁴ by MTS810 test machine, and the sample was deformed until fracture occurred. The
72
fracture morphology was observed by KYKY-2800 scanning electron microscope. The MTS
73
nanoindentation system instrument (Nano Indenter XP MTS Ltd., American) was equipped with a
74
spherical indenter with a nominal radius of 10.8 μm for nanoindentation testing. The loading rate is
75
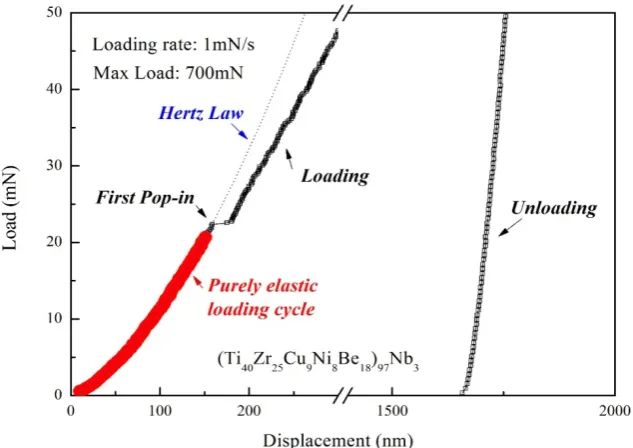
1 mN/s at room temperature. Before the test, the surface of the sample was carefully polished to
76
flawless. Each sample was tested at least 20 times with a spacing of approximately 20 microns
77
between adjacent indentations.
78
3. Results
79
3.1. Amorphous forming ability of alloy
80
Figure 1. is the X-ray analysis of Ti40Zr25Cu9Ni8Be18, (Ti40Zr25Cu9Ni8Be18)97Nb3,
81
(Ti40Zr25Cu9Ni8Be18) 99Y1 and (Ti40Zr25Cu9Ni8Be18)98Y2.The diffraction spectra of Ti40Zr25Cu9Ni8Be18,
82
(Ti40Zr25Cu9Ni8Be18)97Nb3, (Ti40Zr25Cu9Ni8Be18)99Y1 alloys only contain a wide diffuse scattering peak,
83
and there are no obvious sharp diffraction peaks of crystal phase, which are typical amorphous
84
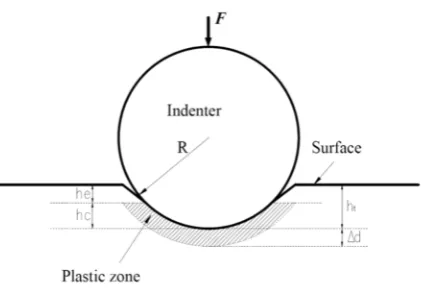
diffraction patterns. The diffraction patterns and HRTEM images of the three alloy samples were
85
further observed by transmission electron microscopy (TEM). It was found that the microstructure
86
was uniform and single-phase structure without precipitation of crystal phase and the diffraction of
87
selected region was a typical amorphous diffraction ring. However, the diffraction spectrum of the
88
(Ti40Zr25Cu9Ni8Be18)98Y2 alloy shows that the crystallization peak is superimposed on the broad
89
diffuse scattering peak, indicating that the crystallization occurs when the Y element content is 2%,
90
which is not completely amorphous. As the content of Y element increases, the crystallization peak
91
of the XRD pattern of the alloy sample becomes more and more obvious (the results are not shown in
92
the figure). The results show that the addition of Y element obviously induces the precipitation of
93
crystallization phase and reduces the amorphous forming ability of the alloy. Further DSC analysis
showed that the melting point, glass transition temperature and crystallization temperature of the
95
alloy were equal regardless of the amount of Nb added (results not shown), indicating that the
96
addition of Nb element did not significantly affect the amorphous forming ability of the alloy.
97
98
Figure. 1 XRD patterns of the as-cast (Ti40Zr25Cu9Ni8Be18)100-xTMx (x=0,1,2,3,4 at.%,TM=Nb,Y) Alloys.
99
3.2. Macro compression performance of amorphous alloys
100
Figure 2. is a compressive stress-strain curve of an as-cast alloy at room temperature after
101
addition of Nb or Y element to Ti40Zr25Cu9Ni8Be18. The room temperature compression mechanical
102
properties of several alloys are summarized in Table 1. The stress-strain curve shows that the
103
compressive fracture strength of Ti40Zr25Cu9Ni8Be18 amorphous alloy is 1896MPa and the plastic
104
deformation is 2.1%. After adding Nb element, the fracture ultimate strength of
105
(Ti40Zr25Cu9Ni8Be18)97Nb3 as-cast amorphous alloy reach 2177MPa, and the plastic deformation is up
106
to 13%. However, (Ti40Zr25Cu9Ni8Be18)99Y1 amorphous alloy has a breaking strength of 1990MPa and
107
plastic strain of only 1.1%. For (Ti40Zr25Cu9Ni8Be18)98Y2 crystal alloy, the compression rupture
108
strength is 1819MPa and plastic deformation is only 0.1%, almost no plasticity; (Ti40Zr25Cu9Ni8Be18)
109
96Nb4 amorphous alloy has a breaking strength of 1930MPa and a plastic strain of 8%. The results
110
show that the plastic strain of the alloy has a strong dependence on trace elements. It is well known
111
that the main mechanism of plasticity improvement of amorphous alloys is that tiny primary phase
112
precipitated during cooling and tiny second phase added are uniformly distributed in the
113
amorphous matrix. The Ti40Zr25Cu9Ni8Be18 alloy and its Nb element added alloy didn’t find
114
crystallization region or crystalline phase, and thus the increase in plasticity should not be attributed
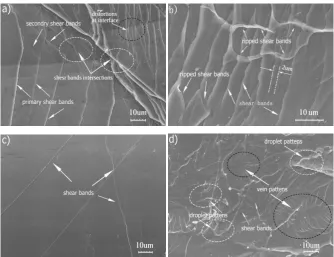
115
to the result of forming the second phase composite. Unlike crystalline alloys, amorphous alloys
116
have no defects such as dislocations and grain boundaries. The inherent instability of plastic
117
deformation of amorphous alloys is related to the shear bands formed by highly localized shear
118
deformation during plastic deformation. Shear bands are closely related to the zigzag rheology (or
119
first pop-in) in the plastic deformation of the nanoindentation test. In order to clarify the relationship
120
between plastic strain and element addition during compression of amorphous alloy, three
121
amorphous alloys Ti40Zr25Cu9Ni8Be18, (Ti40Zr25Cu9Ni8Be18)97Nb3 and (Ti40Zr25Cu9Ni8Be18)99Y1 were
122
studied to the first pop-in event by nanoindentation test. Combined with the macroscopic
123
compression characteristics, the plastic deformation mechanism of the amorphous alloy is analyzed
124
and calculated by the nanoindentation test.
127
128
Table 1. Compressive mechanical property parameters of the four samples
129
Alloy σy(MPa) σ(MPa) εp(%) ε(%)
Ti40Zr25Cu9Ni8Be18 1773 1896 2.1 5.1
(Ti40Zr25Cu9Ni8Be18)97Nb3 1769 2177 13 16
(Ti40Zr25Cu9Ni8Be18)97Nb4 1675 1934 8 11
(Ti40Zr25Cu9Ni8Be18)99Y1 1740 1870 1.1 4.0
(Ti40Zr25Cu9Ni8Be18)98Y2 1801 1819 0.1 3
130
Figure 2. Compressive stress-strain curves of the as-cast (Ti40Zr25Cu9Ni8Be18)100-xTMx(x=0,1,2,3,4
131
at.%,TM=Nb,Y) Alloys.
132
3.3 Plastic deformation energy of amorphous alloy
133
The basic method of nanoindentation testing technology is to continuously measure the
134
relationship between the force and the indentation depth during the nanoindentation testing and to
135
calculate mechanical performance indicators by the load-displacement curve.
136
According to the contact theory of the elastic material[23], the elastic modulus E of the material
137
follow formula:
138
139
(1)
140
Er is the theoretical elastic modulus of the material, Es is the measured elastic modulus of the
141
material, and the elastic modulus of the diamond indenter is Ei=1141GPa, Vi=0.07[24] and Vs are the
142
diamond indenter and the Poisson's ratio of the sample to be tested.The theoretical modulus Er[24]
143
of the material follows formula:
144
145
1
r
E
=
1
−
i 2v
i
E
+
1
−
s 2v
(2)
146
S is the contact stiffness, s=dp/dh is the slope of the nanoindentation unloading curve, and β is
147
the folding coefficient, which is related to the geometry of the indenter. For cone indenters, β =1.034,
148
cylindrical indenter β = 1. Figure 3. shows a typical nanoindentation load-displacement (p-h) curve
149
of (Ti40Zr25Cu9Ni8Be18)97Nb3, including loading and unloading (indicated by the arrows in the figure).
150
The starting point of plastic deformation occurring during loading can be determined by the
151
experimental data from the first point of the elastic theoretical curve (shown by the dashed curve in
152
Figure 3.) given by Hertz theory.
153
154
Figure 3. A load-displacement (P-h) curve of (Ti40Zr25Cu9Ni8Be18)97Nb3 bulk amorphous alloy at the
155
loading rate of 1mN/s. To better illustrate the initial deviation from elastic contact, the plot here is
156
magnified, as predicted using the Hertzian contact law shown as the dash line. The first ‘pop-in’
157
event corresponds to a discontinuity, denoted by the arrow.
158
Nanoindentation tests performed on lower subcritical loads typically exhibit desirable
159
reversibility and leave no trace on the surface of the sample. When the load reach approximately 22
160
mN, the clusters under the indenter suddenly collapse to relieve Strain, which causes the first pop-in
161
of displacement (indicated by the arrow) and marks the beginning of an irreversible shaping
162
rheology. In addition, the first pop-in of displacement also indicates the generation of shear
163
bands.The load-displacement curve of the spherical indenter nanoindentation before the first
164
"pop-in" appeared in accordance with the Kurz [19] elastic contact law:
165
(3)
166
R is the nominal radius of the indenter. Ht is the indentation displacement of first pop-in, hc is
167
the indenter contact displacement, and the relationship is shown in Figure 4:
168
r
E
=
π
2
β
×
s
A
F
=
4
169
Figure 4. spherical indentation geometry, where htis the indenter displacement at the beginning of
170
first pop-in, hc is contact depth, he issurface displacement, and Δd is the suddenly displacement of
171
indenter duringthe first pop-in[22].
172
(4)
173
F
maxis the maximum load, ε is the reduction factor of the geometry indenter, Fp is
174
the load of the first pop-in, and ∆d is the displacement of the first pop-in. The average
175
contact stress Pm of the first pop-in is[19]:
176
(5)
177
Figure 5 shows the load portion of a typical nanoindentation P-h curve of Ti40Zr25Cu9Ni8Be18,
178
(Ti40Zr25Cu9Ni8Be18)97Nb3 and (Ti40Zr25Cu9Ni8Be18)99Y1. It can be seen from Figure 5 that the load (Fp),
179
the indenter displacement (ht) and the displacement of first pop-in (∆d) are significantly different to
180
the first pop-in in the three alloys. The sawtooth phenomenon can be clearly observed in the three
181
P-h curves, indicating that the deformation process is interrupted by many pop-in during the
182
loading process. Figure 4. shows enlarged images corresponding to the P-h curve at the first pop-in
183
of a, b and c, respectively. When the sawtooth area was further enlarged, it was found that the few of
184
dots recorded in the sawtooth area, which means that the sawtooth flow rate was faster. In
185
compression deformation, each serration corresponds to the nucleation of the shear bands and
186
quickly adapts to plastic strain, causing drop in load [25]. Ti40Zr25Cu9Ni8Be18 bulk amorphous alloy
187
with no added element, which corresponds to the load (Fp), indenter displacement (ht) and
188
displacement (∆d) at the first pop-in, is 44mN, 270nm and 9.5nm, respectively. The bulk amorphous
189
alloy of adding Nb element reduced Fp to 22mN and ∆d increased to 22nm, indicating that the
190
displacement of first pop-in is easy to start. On the contrary, the BMG of adding the Y element
191
increased Fp to 49mN and the ∆d is almost unchanged, indicating that the addition of Y element for
192
bulk amorphous alloy requires a greater stress drive to cause the first pop-in. Table 2 is the measured
193
values of load and displacement for the first displacement of the sample (average over 10
194
experimental measurements).
195
(6)
196
The volume of the plastic deformation zone is shown in the shaded part of Figure 4 by[22]:
197
c
h
=
h
t−
ε
F
maxs
p
F
max
F
m
P
=
1 3
16
F
p
E
r
2
9
π
3
R
2
p
(7)
198
199
Table 2. The measured indenter displacement (ht), contact depth of ht (hc), suddenly displacement of
200
indenter (Δd), applied forces (Fp), contact pressure (Pm) and critical shear stresses (τcrit) at the first
201
pop-in events of the three samples.
202
Alloy ht hc Fp (mN) Δd (nm) Pm (GPa) τcrit (GPa)
Ti40Zr25Cu9Ni8Be18 270.41 153.93 43.73 7.56 6.54 2.91
(Ti40Zr25Cu9Ni8Be18)97Nb 146.43 69.88 19.34 17.12 4.98 2.22
(Ti40Zr25Cu9Ni8Be18)99Y1 340.72 210.52 55.48 6.36 7.08 3.10
203
Figure 5. Typical loading parts of the nanoindentation load-displacement curves of
204
(Ti40Zr25Cu9Ni8Be18)100-xTMx(x=0,1, 3 at.%,TM=Nb,Y) glassy rod samples at the loading rate of 1
205
mN/s.As the indentation depth increases, the deformation volume increases, and the total plastic
206
deformation work of the first "pop-in" occurs[22]:
207
Therefore, the first "pop-in" PDE can be calculated by[22]:
208
(8)
209
The PDE measured results of three amorphous alloy samples are shown in Table 3.
210
Table 3. The calculated plastic deformation energy of the three samples
211
Alloy Wp (J) Vp (m3) Wp/Vp (J/m3) ε(%)
Pt-based[22] 1.985E−11 1.57E−19 1.26E8 20
Cu50Zr50[22] 3.28E−11 1.92E−19 1.71E8 30
Zr-based[22] 7.25E−10 1.61E−18 4.52E8 0.2
p
V
=
hc+Δd
(
)
V
−
c
h
V
=
π
(
h
c+ Δ
d
)
6
3
R
2
+
h
c
+ Δ
d
(
)
−
π
h
c6
3
R
2
+
h
c2
(
)
U
=
W
pCu-based[22] 3.76E−10 9.05E−19 4.15E8 1.6
Ti40Zr25Cu9Ni8Be18 3.31E−10 1.38E−18 2.39E8 2.1
(Ti40Zr25Cu9Ni8Be18)97Nb3 3.29E−10 3.13E−18 1.05E8 13
(Ti40Zr25Cu9Ni8Be18)99Y1 3.53E−10 1.17E−18 3.03E8 1.1
Wp: the plastic strainwork done to operate the first pop-in; Vp: the shear deformation volume during
212
the first pop-in; U: the PDE calculated from nanoindentation, =Wp/Vp; ε: plastic strain
213
4. Discussion
214
The atoms of portion move larger displacement than the surrounding atoms by shear
215
deformation. These atoms of portion with the surrounding atoms are called the shear transition zone
216
(STZ). D. Pan[18] showed that the size of the STZ is fundamentally related to the plasticity of
217
amorphous alloys. When the amorphous alloy has low plastic deformation energy, its STZ is large in
218
size, and it is easy to produce shear bands (low energy threshold), showing a certain plastic
219
deformation ability. Plastic amorphous alloys have low plastic deformation energy because of their
220
large STZ. Therefore, it is easy to produce a shear band (low energy threshold). It is well known that
221
the cross-sectional morphology is related to the mechanical properties of the material. The section
222
morphology rich in shear bands is related to ductile fracture, while the section morphology of
223
cleavage fracture is brittle fracture, depending on the size of plastic deformation energy (PDE). In
224
order to clarify the deformation mechanism of the three-component amorphous alloy, the
225
morphology of the fracture surface and side of the (Ti40Zr25Cu9Ni8Be18) 97Nb3 sample is shown in
226
Figure 6a. A large number of shear bands in many directions are distributed on the side of the
227
sample as shown in Figure 6a. In the initial stage of deformation, the main shear bands are difficult
228
to spread on the amorphous matrix. Therefore, it is limited to a certain region, and the plastic strain
229
of the amorphous matrix cannot be continuously performed.
230
231
Figure 6. SEM images of the fractography for the compressive fracture samples of the
232
(Ti40Zr25Cu9Ni8Be18)97Nb3 bulk amorphous alloy: (a) lateral surface, (b) fracture surface;
233
(Ti40Zr25Cu9Ni8Be18)99Y1: (c) lateral surface, (d) fracture surface.
234
As further deformation progresses, in this case, a series of secondary shear bands that are
235
different from the direction of the initial main shear bands are created to eliminate excessive
deformation energy. When the secondary shear bands expand through the main shear bands, it will
237
be blocked and interact. From Figure 6b, the intensive interaction between the shear bands can be
238
seen. The spacing of the secondary shear band is only 1-2um, indicating that the amorphous sample
239
has intense plastic deformation. That is, the main shear bands effectively block the secondary shear
240
bands. The shear strain in the deformation process is accommodated by the generation and stable
241
extension of a plurality of shear bands, which ultimately leads to higher macroscopic compression
242
ductility.
243
The plasticity of amorphous alloy is reduced by Y instead of Nb. The SEM image of the cross
244
section and side of the (Ti40Zr25Cu9Ni8Be18)99Y1 is shown in Figure 6c and Figure 6d. A little of shear
245
bands are distributed on the side of the sample from Figure 6c of arrow. From the surface of the
246
fracture, three fracture morphologies can be observed: the droplet pattern (white ellipse), the vein
247
pattern (black ellipse) and the shear step (white arrow). The existence of more droplet patterns is due
248
to the elastic energy existing in the deformation process. When the sample breaks, the heat released
249
in a relatively narrow space and short time cause to re-melt part of the amorphous matrix[26]. A few
250
vein patterns are formed during the gradual sliding expansion of the main shear bands due to the
251
obstruction (and absorption) of the shear bands by the amorphous matrix. In addition, the
252
appearance of the shearing step on the fracture surface indicates that the amorphous matrix fail to
253
effectively hinder the expansion of the shear bands and the subsequent cracking. On the other hand,
254
due to the increase in the instantaneous temperature of the crack (adiabatic exotherm), micro-scale
255
vein pattern is produced. Since only a little of shear bands is generated, the plastic rheology is
256
confined within the main shear bands. As the addition of the Y element, (Ti40Zr25Cu9Ni8Be18)99Y1
257
amorphous alloy shows a lower plasticity than (Ti40Zr25Cu9Ni8Be18)97Nb3.
258
The plasticity in the crystalline material is related to dislocation defects, while the plastic
259
deformation of the amorphous alloy is confined to the narrow shear bands with gathering too many
260
disordered atoms. It is well known that bulk amorphous alloys are compressed to high stress at
261
room temperature, and the plastic strain is confined within the nano-sized shear bands region,
262
causing catastrophic fracture in a non-uniform strain manner. On the other hand, the atoms are
263
rearranged in a short range during the deformation process, and excess free volume is
264
accumulated[27], resulting in the formation of FVAZs (free volume accumulation zones). In the
265
process of deformation, the shear transition zone is easily generated in FVAZs with a very small
266
energy barrier and the nucleation zone of the shear bands. It is easy to reach the required shear stress
267
value during the deformation process of the relatively loosely dispersed atomic group, so that the
268
adjacent atoms are rearranged to reach the shear strain to form STZs. The generation and
269
development of STZs is strongly influenced by the local atomic arrangement, in which the relatively
270
loose position of deposited atomic is susceptible to shear strain under the shear stress. The shear
271
bands propagation is to be triggered by meeting of shear bands with each other, which increases the
272
fluidity of the bulk amorphous alloy plastic deformation and produces an overall ductility with
273
large plastic strain. Furthermore, it is well known that displacement of pop-in during
274
nanoindentation actually corresponds to the formation of shear bands by nanoindentation test[28].
275
Pack and Schuh’s result[29]revealed the formation of shear bands (or first pop-in) controlled by
276
higher stress along a feasible shear plane in nanoindentation test of spherical indenter. Shear bands
277
are formed when the stress reaches a critical threshold, rather than being controlled by the highest
278
stress near the principal stress. The ability of plastic deformation of metallic glass depends on the
279
nucleation and proliferation of shear bands during deformation. In the nanoindentation experiment,
280
Pop-in in the load-displacement curve indicates material strain and the generation and expansion of
281
the shear bands. In this study, the PDE values of Ti40Zr25Cu9Ni8Be18, (Ti40Zr25Cu9Ni8Be18)97Nb3 and
282
(Ti40Zr25Cu9Ni8Be18)99Y1 were 2.39E8 J/m3, 1.05E8 J/m3, 3.03E8 J/m3, respectively. If the PDE value of
283
the Ti40Zr25Cu9Ni8Be18 sample is assumed to be a1, the PDE values of the (Ti40Zr25Cu9Ni8Be18)97Nb3
284
and (Ti40Zr25Cu9Ni8Be18)99Y1 samples can be estimated to be 0.43a1 and 1.3a1, respectively. It is clear
285
that the PDE value is reduced by 57% after the addition of Nb. Conversely, the PDE value increases
286
by 30% after the addition of Y. Wang pointed out that the PDE value of bulk amorphous alloy s is
287
intrinsically related to the formation ability of shear bands and directly related to the plastic
deformation ability of bulk amorphous alloys. In summary, the shear bands will nucleate in these
289
STZs when the stress or deformation energy exceeds a threshold during plastic deformation.
290
(Ti40Zr25Cu9Ni8Be18) 97Nb3 amorphous alloy has a lower PDE, and the shear bands may be easy to
291
generate, proliferate and expand under low energy barrier, resulting in uniform plasticity. That the
292
multiple shear bands generated and crossed by room temperature compression show in Figure 6a
293
and Figure 6b In contrast to the (Ti40Zr25Cu9Ni8Be18)97Nb3 alloy, the PDE value of
294
(Ti40Zr25Cu9Ni8Be18)99Y1 is about 3 times that of the (Ti40Zr25Cu9Ni8Be18)97Nb3 alloy PDE. Thus, the
295
shear band can only be produced under high energy barriers with only a few shear bands
296
nucleating, generating and expanding, exhibiting minimal plasticity and subsequent fracture.
297
5. Conclusions
298
The effects of Nb or Y addition on mechanical properties of Ti40Zr25Cu9Ni8Be18 bulk amorphous
299
alloys were investigated at room temperature. The main results are listed as follows:
300
Under compressive loading, the Ti40Zr25Cu9Ni8Be18 bulk amorphous alloy exhibits a fracture
301
strength of 1896 MPa and a plasticity of about 2.1%. With addition of Nb, the
302
(Ti40Zr25Cu9Ni8Be18)97Nb3 bulk amorphous alloy possesses the largest plastic strain of 13% and
303
ultimate strength of 2177MPa. If Nb is substituted by Y, the (Ti40Zr25Cu9Ni8Be18)99Y1 bulk amorphous
304
alloy exhibits a fracture strength of 1990 MPa and a plastic strain of 1.1% under compressive loading.
305
The PDE of the first pop-in in three bulk amorphous alloys is measured via nanoindentation
306
test with a spherical indenter. The results show that the PDE value reduced by as much as 57 percent
307
with Nb addition and increased 30 percent with Y addition than the PDE value of Ti40Zr25Cu9Ni8Be18
308
bulk amorphous alloy. Smaller PDE values of the (Ti40Zr25Cu9Ni8Be18)97Nb3 bulk amorphous alloy
309
result in greater plasticity with the initiation and propagation of multiple shear bands. On the
310
contrary, the brittle (Ti40Zr25Cu9Ni8Be18)99Y1 bulk amorphous alloy has larger PDE values. Modifying
311
the bulk amorphous alloys with a lower PDE value represents a feasible means of improving the
312
plasticity of bulk amorphous alloys.
313
314
315
Author Contributions: Shengfeng Shan conceived and designed the experiments; Shengfeng Shan and
316
Bing Zhang performed the experiments; Shengfeng Shan, Yuanzhi Jia and Mingzhen Ma analyzed the
317
data; Mingzhen Ma and Mingzhen Ma contributed materials; Shengfeng Shan wrote the paper.
318
Acknowledgments: This work was supported by the NSFC (Grant Nos.51434008/51671166/51471143), and
319
RPCST of Hebei province (Grant No. QN2014156).
320
Conflicts of Interest: The authors declare no conflict of interest.
321
References
322
1. Inoue, A.; Takeuchi, A. Recent development and application products of bulk glassy alloys. Acta Mater.
323
2011, 59, 2243–2267.
324
2. Yang, W.; Sun, B.; Zhao, Y.; Li, Q.; Hou, L.; Luo, N.; Dun, C.; Zhao, C.; Ma, Z.; Liu, H. Non-repeatability of
325
large plasticity for Fe-based bulk metallic glasses. J. Alloy. Compd. 2016, 676, 209–214.
326
3. Li, J.; Wang, Y.W.; Yi, J.; Hussain, I.; Li, R.; Zhang, B.; Wang, G. Strain-energy transport during fracture of
327
metallic glasses. J. Alloy. Compd. 2016, 680, 43–53.
328
4. Schuh, C.A.; Hufnagel, T.C.; Ramamurty, U. Mechanical behavior of amorphous alloys. Acta Mater. 2007,
329
55, 4067–4109.
330
5. Inoue, A. ; Ohtera, K.; Kita, K. ; Masumoto, T. Magnetic properties of Co-B-C amorphous alloys
331
melt-quenched beyond the eutectic regime. Japan J. Appl. Phys. 1988, 63, 3397.
332
6. Wang, X.; Yoshii, I.; Inoue, A.; Kim, Y.-H.; Kim, I.-B. Bulk amorphous Ni75- xNb5MxP20- yBy (M= Cr, Mo)
333
alloys with large supercooling and high strength. Mater. Trans. JIM 1999, 40, 1130–1136.
334
7. Liu, L.; Zhang, T.; Liu, Z.; Yu, C.; Dong, X.; He, L.; Gao, K.; Zhu, X.; Li, W.; Wang, C. Near-Net Forming
335
Complex Shaped Zr-Based Bulk Metallic Glasses by High Pressure Die Casting. Materials 2018, 11, 2338.
336
8. Frans, S. A microscopic mechanism for steady state inhomogeneous flow in metallic glasses. Acta Metall.
337
9. Argon, A. S. Plastic deformation in metallic glasses. Acta metall 1979, 27, 47-58.
339
10. Wang, W. H.; Bian, Z.; Wen, P.; Zhang, Y.; Pan, M. X.; Zhao, D. Q. Role of addition in formation and
340
properties of Zr-based bulk metallic glasses. Intermetallics 2002, 10, 1249-1257.
341
11. Chen, N.; Martin, L.; Luzguine-Luzgin, D. V.;Inoue, A. Role of alloying additions in glass formation and
342
properties of bulk metallic glasses. Materials 2010, 3, 5320-5339.
343
12. Inoue, A. Bulk amorphous and nanocrystalline alloys with high functional properties. Mater. Sci. Eng., A
344
2001, 304, 1-10.
345
13. Cai, A.; Ding, D.; Liu, Y.; Wu, H.; An, W.; Zhou, G.; Luo, Y; Peng, Y. A series of Zr-based bulk metallic
346
glasses with room temperature plasticity. Materials 2016, 9, 408.
347
14. Liu, R. S.; Li, J. Y. On the structural defects and microscopic mechanism of the high strength of amorphous
348
alloys. Mater. Sci. Eng., A, 1989, 114, 127-132.
349
15. Conner, R. D.; Li, Y.; Nix, W. D.; Johnson, W. L. Shear band spacing under bending of Zr-based metallic
350
glass plates. Acta Mater. 2004, 52, 2429-2434.
351
16. Sattler, K.D. ; Handbook of Nanophysics: Functional Nanomaterials, CRC Press, 2010.
352
17. Yan, X. Q.; Huang, X. M.; Uda, S.; Chen, M. W. Effect of heavy boron doping on pressure-induced phase
353
transitions in single-crystal silicon. Appl. Phys. Lett. 2005, 87(19), 191911.
354
18. Pan, D.; Nieh, T. G.; & Chen, M. W. Strengthening and softening of nanocrystalline nickel during
355
multistep nanoindentation. Appl. Phys. Lett. 2006, 88, 161922.
356
19. Bei, H.; Lu, Z. P.; George, E. P. Theoretical strength and the onset of plasticity in bulk metallic glasses
357
investigated by nanoindentation with a spherical indenter. Phys. Rev. let. 2004, 93, 125504.
358
20. Wang, K.; Pan, D.; Zhang, W.; XM, W.; Inoue, A. Measuring elastic energy density of bulk metallic glasses
359
by nanoindentation.Mater. Trans. 2006, 47, 1981-1984.
360
21. Schuh, C. A.; Nieh, T. G. A survey of instrumented indentation studies on metallic glasses. J. Mater. Res.
361
2004, 19, 46-57.
362
22. Wang, K.; Chen, M. W.; Pan, D.; Fujita, T.; Zhang, W., Wang, X. M.; Inoue, A. Plastic deformation energy of
363
bulk metallic glasses. Mater. Sci.Eng., B 2008, 148, 101-104.
364
23. Johnson, K. L. Contact mechanics cambridge univ. Press, Cambridge 1985, 95
365
24. Hay,J.L.;Pharr, G.M.;Kuhn, H.; Medkin,D. ASM Handbook, Volume 8, Mechanical Testing and
366
Evaluation,2000
367
25. Qiao, J. W.; Zhang, Y.;Liaw, P. K. Serrated flow kinetics in a Zr-based bulk metallic glass. Intermetallics
368
2010, 18, 2057-2064.
369
26. Lewandowski, J. J.;Greer, A. L. Temperature rise at shear bands in metallic glasses. Nat. mater. 2006, 5, 15.
370
27. Stolpe, M.; Kruzic, J. J.;Busch, R. Evolution of shear bands, free volume and hardness during cold rolling of
371
a Zr-based bulk metallic glass. Acta Materialia 2014, 64, 231-240.
372
28. Schuh, C. A.;Nieh, T. G.A nanoindentation study of serrated flow in bulk metallic glasses. Acta Materialia
373
2003, 51, 87-99.
374
29. Packard, C. E.;Schuh, C. A.; Initiation of shear bands near a stress concentration in metallic glass. Acta


![Figure 5. Typical loading parts of the nanoindentation load-displacement curves of (Ti40Zr25Cu9Ni8Be18)100-xTMx(x=0,1, 3 at.%,TM=Nb,Y) glassy rod samples at the loading rate of 1 mN/s.As the indentation depth increases, the deformation volume increases, and the total plastic deformation work of the first "pop-in" occurs[22]:](https://thumb-us.123doks.com/thumbv2/123dok_us/7999196.1328559/7.595.87.485.171.511/typical-nanoindentation-displacement-indentation-increases-deformation-increases-deformation.webp)