©
DOI: 10.1534/genetics.104.032813
Variation After a Selective Sweep in a Subdivided Population
Enrique Santiago*
,1and Armando Caballero
†*Departamento de Biologı´a Funcional, Facultad de Biologı´a, Universidad de Oviedo, 33071 Oviedo, Spain and†Departamento de Bioquı´mica, Gene´tica e Inmunologı´a, Facultad de Biologı´a, Universidad de Vigo, Campus Universitario, 36310 Vigo, Spain
Manuscript received July 12, 2004 Accepted for publication October 8, 2004
ABSTRACT
The effect of genetic hitchhiking on neutral variation is analyzed in subdivided populations with differen-tiated demes. After fixation of a favorable mutation, the consequences on particular subpopulations can be radically different. In the subpopulation where the mutation first appeared by mutation, variation at linked neutral loci is expected to be reduced, as predicted by the classical theory. However, the effect in the other subpopulations, where the mutation is introduced by migration, can be the opposite. This effect depends on the level of genetic differentiation of the subpopulations, the selective advantage of the mutation, the recombination frequency, and the population size, as stated by analytical derivations and computer simulations. The characteristic outcomes of the effect are three. First, the genomic region of reduced variation around the selected locus is smaller than that predicted in a panmictic population. Second, for more distant neutral loci, the amount of variation increases over the level they had before the hitchhiking event. Third, for these loci, the spectrum of gene frequencies is dominated by an excess of alleles at intermediate frequencies when compared with the neutral theory. At these loci, hitchhiking works like a system that takes variation from the between-subpopulation component and introduces it into the subpopulations. The mechanism can also operate in other systems in which the genetic variation is distributed in clusters with limited exchange of variation, such as chromosome arrangements or genomic regions closely linked to targets of balancing selection.
I
T is generally accepted that the spread of an advanta- more appropriately described as an arrangement of par-tially differentiated subpopulations. Here we show that geous mutation reduces the genetic variation atlinked neutral loci: the mutation drags linked alleles in the effect of a selective sweep on the neutral variation of a subdivided population can be very different from its way to fixation, and most of the original variation is
eliminated. The magnitude of the effect depends on that predicted by the previous theory. Under particular combinations of recombination frequency, selective val-the recombination rate and val-the selective value of val-the
mutation (Maynard-Smith and Haigh 1974; Wiehe ues, and population subdivision, the genetic variability andStephan1993). After this selective sweep, most of increases at loci linked with the selected gene. At these the neutral alleles at closely linked loci are lost and, loci, an excess of genes at intermediate frequencies is afterward, the neutral variation is recovered very slowly expected.
by mutation. During this time, the spectrum of gene frequencies is dominated by rare alleles until, if there
is enough time without any other “disturbance,” a new THE BASIC THEORY mutation-drift balance is reached. These predictions
We assume a model of two subpopulations with 2N
have been widely used to discriminate between selective
monoecious haploid individuals each, which is equiva-sweep and other selective models. Particularly, the
back-lent toNdiploid individuals. The number of individuals ground selection model (Charlesworthet al. 1993)
is constant over discrete generations and there are no predicts a reduction of variability with a distribution of
extinction-recolonization events. Every generation, a pro-gene frequencies following a nearly neutral spectrum,
portionmof individuals migrates from each subpopula-and balancing selection models predict an increase in
tion to the other one and there is a random association neutral variation that is represented by genes at
interme-of individuals within subpopulations to accomplish sex-diate frequencies. However, most of the previous theory
ual reproduction;i.e., pairs of random individuals are of hitchhiking considers only the effect on a single
pan-temporarily combined in different meiosis to generate mictic population. Natural populations, in general, are
individuals of the next generation. We also consider a neutral locus for which mutation follows an infinite-allele model, so that every mutation creates a new allele not
1Corresponding author:Departamento de Biologı´a Funcional,
Facul-present before in the population. As a consequence of
tad de Medicina, Universidad de Oviedo, 33071 Oviedo, Spain.
E-mail: [email protected] the isolation, there is a genetic correlationFST(Wright
1951) between gene copies at the neutral locus within within the subset of chromosomes carrying copies of
a. Obviously, p0 ⫽ 1 and its value decreases due to subpopulations. The value of this correlation can be
recombination untila is fixed in the subpopulation at given as
generationf. At this generation, a proportionpfof the copies at the neutral locus will be replicates of the
origi-FST⫽ 2⫺ 3
1⫺ 3 nal neutral copyc.
As the mutation rate at the neutral locus is too small (Cockerham1969, 1973), where2is the average
proba-to affect variability when the selected gene is segregat-bility of identity by descent for pairs of genes sampled
ing, the identity by descent at the neutral locus after within subpopulations and3is the probability of
iden-the hitchhiking process in iden-the first subpopulation can be tity by descent for pairs of genes sampled from different
approximated in the following way. Two genes randomly subpopulations, respectively. The term1, normally used
taken from the subpopulation have a probabilityp2 f of to indicate the genetic identity within individuals, has
being identical copies ofc. Accordingly, the probability no meaning here as individuals are haploid.
of one copy ofcand one copy of another ancestral gene Because mutation generates new alleles, identity by
at generation 0 is 2pf(1 ⫺ pf), the expected identity descent and identity by state are equivalent. The
ex-between these copies being that before the selective pected heterozygosities within subpopulations (Hs) and sweep (2). Finally, the probability of none of the two for the whole population (Ht) can be expressed as func- copies coming from c is (1 ⫺ pf)2, the probability of tions of the probabilities of identity,
identity of these copies (x) being larger than the initial identity2because of the drift process during the
selec-Hs⫽1⫺ 2,
tive sweep. Averaging over the three values, the expected identity in the first population after the selective sweep
Ht⫽1⫺ 2 ⫹ 3
2 . (⬘2) is
A single copy of a favorable alleleaoccurs by mutation E(⬘2)⫽ 1E(p2
f)⫹ 2E(2pf(1⫺ pf))⫹E(x(1 ⫺pf)2) . at a linked locus in one of the two subpopulations. We
If the subpopulation is large and the proportion (1⫺ refer to this subpopulation as the “first subpopulation.”
pf) is not small, then genetic drift will not increase in a At this moment, neutral variation is not necessarily at
significant way the original 2 value within the set of mutation-migration-drift balance. The selective
coeffi-chromosomes that do not carry c. Therefore,xwill be cient of the new mutation is sand the recombination
close to2. In contrast, if (1⫺ pf) is small thex value frequency between the selected and the neutral locus
will be larger than the original 2, but the third term isr. With time, the mutation will be lost or fixed in the
of the equation will be negligible. Therefore, a simplifi-first subpopulation. As we are interested in studying the
cation can be obtained by substituting the third term effect of hitchhiking on variation, only the populations
for2E((1⫺pf)2) and, after rearrangement, in which the mutation is fixed are considered.
Eventu-ally, the favorable mutation is passed by migration to
E(⬘2)⫽ 2⫹(1 ⫺ 2)E(p2f) .
the other subpopulation (the “second subpopulation”)
and fixed in both subpopulations. Now, the prediction is extended to the second sub-The effect of fixation of a favorable mutation on exist- population. Here we assume that one single copy of the ing heterozygosity at a neutral linked locus in a single favorable mutation is transferred from the first to the population is given by Equation 19 of Stephan et al. second subpopulation. In the following generations, se-(1992). If the migration rate is not too large, this equa- lection increases the frequency of the neutral copy c
tion is also applicable to predict the heterozygosity in coming from the first subpopulation. As the mutation the first subpopulation after fixation. This is because goes to fixation, recombination tends to remove the most of the small amounts of variability introduced from association with this neutral copy, and the expected the second to the first subpopulation when the mutation values ofpf andp2f are the same as in the first subpop-goes to fixation will be swept by the hitchhiking effect ulation. Two genes randomly taken from the second ifr is small. Although this article deals with the effect subpopulation have a probability p2
f of being identical of hitchhiking on the whole population and, particu- copies ofc. The probability of one copy ofc and one larly, on the second subpopulation, we initially consider copy of another ancestral gene at generation 0 is 2 pf the effect of the selective sweep on heterozygosity in (1 ⫺ pf), the expected identity between these copies
the first subpopulation. being the identity between subpopulations before the
Letcbe the neutral copy originally associated witha selective sweep (3). Finally, the probability of none of when this first appears by mutation as a single copy. Let the two copies coming fromcis (1⫺pf)2and the
proba-qibe the frequency of alleleain the first subpopulation bility of identity of these copies is 2. Averaging these
igenerations after mutation (i.e.,q0⫽1/2N) andpibe three identities we obtain the expected identity after fixation in the second subpopulation,
TABLE 1
Average simulated (sim) and predicted (E) values ofpfandpf2for different combinations of population size
(N), recombination frequency (r), and selective coefficient (s) of the favorable mutation
2N r s simpf E(pf) (A1) simp2f E(p2f) (A2)
2⫻104 0.0005 0.005 0.5789 0.5567 0.5694 0.4118 0.3785 0.3289
105 0.0007 0.02 0.7299 0.7335 0.7353 0.5719 0.5771 0.5417
104 0.01 0.1 0.4618 0.4422 0.4523 0.2596 0.2388 0.2075
105 0.02 0.1 0.1300 0.1234 0.1354 0.0253 0.0227 0.0193
106 0.01 0.1 0.2716 0.2790 0.2854 0.0916 0.0951 0.0826
105 0.001 0.2 0.9394 0.9457 0.9457 0.8950 0.9034 0.8944
104 0.01 0.2 0.6378 0.6423 0.6457 0.4504 0.4560 0.4185
104 0.02 0.2 0.4136 0.4126 0.4220 0.2114 0.2079 0.1807
105 0.05 1 0.4397 0.5282 0.5310 0.2153 0.3084 0.2830
(A1) and (A2) are predictions ofpfandpf2using Equation 17 fromOttoandBarton(1997) and Equation 4 fromBarton(1998), respectively.
E(″2)⫽1E(p2f)⫹ 3E(2pf(1⫺pf))⫹ 2E((1⫺ pf)2) Substituting these values in the equations above, predic-tions forE(⬘2), E(″2), andE(⬘3) can be made for any ⫽ 2 ⫹E(p2
f)(1⫹ 2⫺ 23)⫺2E(pf)(2 ⫺ 3) .
combination onN,r, ands. As the third term in the right-hand side of the equation
is negative, for some combinations ofE(pf),E(p2
f),2, and
ANALYSIS OF EXPRESSIONS 3, it is possible for the identity by descent to decrease
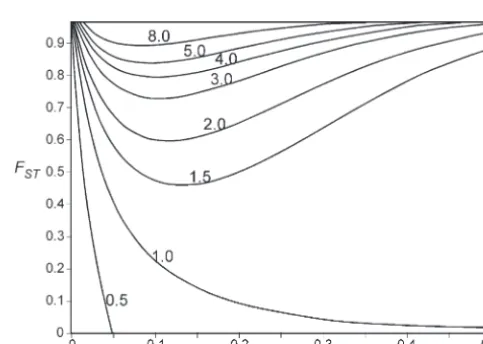
in the second subpopulation after the selective sweep. Predictions of variability in the second subpopulation In general this is expected when are quite different depending on the structure of the population (Figure 1). In a single panmictic population
FST⬎
E(p2
f) 2E(pf)⫺E(p2
f)
. (we could say that the population is equivalent to a set of subpopulations with a high migration rate and, Finally, after the selective sweep, the expected value therefore,FST⫽0), hitchhiking will reduce the variabil-of the identity⬘3of two genes, one from the first subpop- ity at linked neutral loci. The reduction will be large in ulation and the other from the second subpopulation, a chromosome region closely linked to the selected gene is the average of the probabilities of sampling the second (forr/s ⫽ 0.05 the variability is halved; see Figure 1). subpopulation from the areapfor the area (1⫺pf), This is also the expectation for the first subpopulation
E(⬘3)⫽ E(pf)⬘2 ⫹(1 ⫺E(pf))3.
OttoandBarton(1997, Equation 17) andBarton (1998, Equation 4) give approximations forE(pf) and
E(p2
f), which are, respectively, the expected change in allele frequency of the neutral allele initially linked to the beneficial mutation and the probability of coal-escence with the original neutral allele linked to the beneficial mutation in the first generation. The approxi-mation forE(p2
f) clearly underestimates the true value and turns out to be too close to E(pf)2 (see Table 1). This is probably because the only source of variance considered was the variation in times to fixation of the favorable allele. In the appendix we develop simple alternative predictions forE(pf) andE(p2
f), considering the effect of drift and using a combination of determinis-tic and diffusion approaches.E(pf) has a weak
depen-Figure 1.—Expected variability in the second subpopula-dence on N, and E(p2
f) moves away from E(pf)2 as s
tion after hitchhiking (2Ns⫽1000) as a function ofr/s(where becomes smaller:
ris the recombination frequency andsis the selection coeffi-cient of the mutation) andFST(the level of differentiation).
E(pf)⫽ (7Ns)⫺r/s,
Labels on level lines represent the proportion of the original variability maintained after hitchhiking.
E(p2
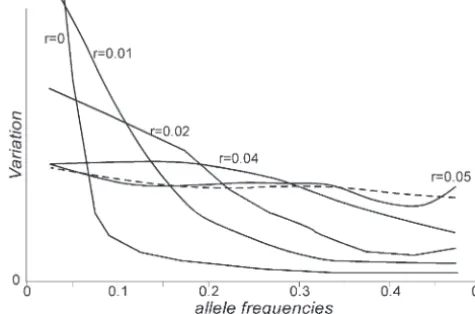
Figure 3.—Contribution of neutral loci at different
fre-Figure2.—Proportion of the original variation within sub- quencies to the variation in the first subpopulation. The populations after hitchhiking given as a function of the recom- dashed line represents the contribution of loci before hitch-bination frequency (r) between the selected and the neutral hiking. Solid lines are the contributions of loci at different genes. Lines are predictions of the model for the first (dashed distances (r) from the selected gene. 2N⫽1000,m⫽0.00001, line) and the second (solid line) subpopulations (2N⫽1000, s⫽0.5, and ⫽0.0000112.
s⫽0.5). Circles and squares are simulated values for the first and the second subpopulations, respectively, with parameters
2N⫽1000,s⫽0.5,m⫽0.00001, and ⫽0.0000112. This at mutation-migration-drift equilibrium (note that this combination of parameters yields anFSTvalue of 0.908 before
equilibrium is not necessarily assumed in the deriva-the sweep.
tions). Thereafter, a single copy of a favorable mutation was assigned to a chromosome of an individual ran-domly taken from the first subpopulation. The fre-in our model for any value ofFST. However, the effect
on the second subpopulation can be very different when quency of the new mutation increased until it was fixed in the first subpopulation (simulations in which the
FST⬎0. The genome region affected by the decline of
variability is narrowed around the selected gene;i.e., the favorable mutation was lost were discarded). As individ-uals migrated between subpopulations, copies of the larger the magnitude of the genetic divergence between
subpopulations, the smaller the region of reduced vari- favorable mutation were eventually transferred and fixed in the second subpopulation too. Then, a number ability. Additionally, if the divergence of the
subpopula-tions is large, the genetic variability in the second sub- of parameters were computed for neutral loci at differ-ent distances from the selected gene: heterozygosity,FST population could even increase over the previous level
before the hitchhiking. This increase affects a region values, and the distribution of the spectrum of variability in both subpopulations. At the end, 5000 simulations in the vicinity of the selected gene but not very close.
Figure 2 shows the effect of a selective sweep on the were carried out for each particular combination of values of population size, selection coefficient, recombi-variability of both subpopulations for neutral genes at
different distances from the selected gene. As the effect nation, and migration rates. Figure 2 represents an ex-ample of the agreement between the observed heterozy-on the first subpopulatiheterozy-on is equivalent to the effect heterozy-on
a single panmictic population, the comparison of the gosities in both subpopulations after hitchhiking and the predictions of the model.
predictions for both subpopulations reveals the great
difference between the predictions for a single or a Figures 3 and 4 show simulation results of the contri-butions of neutral loci at different frequencies to the subdivided population. The genetic variability for
neu-tral loci increases as the genetic distance decreases and, variation of the first and second subpopulations, respec-tively. Before the selective sweep (broken line), the dis-only for loci closely linked with the selected gene, the
genetic variability drops below the original level. tribution of neutral variability is nearly uniform over the whole span of allele frequencies. There are few loci with alleles at intermediate frequencies, but they SIMULATIONS
contribute as much variation as the large number of loci with alleles at low frequencies. In other words, if Predictions were checked by Monte Carlo
simula-tions. A population with two random-mating subpopula- the range of allele frequencies from 0 to 1 were split into equal segments of allele frequencies and loci were tions of 1000 haploid individuals each was reproduced
under constant rates of migration and neutral mutation. assigned to segments according to their frequencies, all the segments would contribute nearly the same to the The neutral loci were distributed over a genome
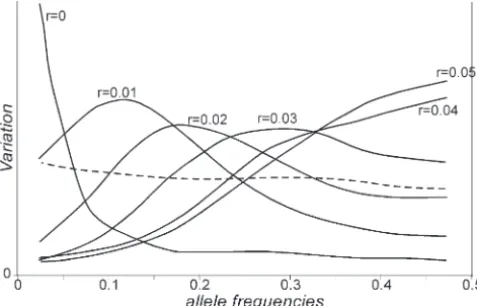
Figure 4.—Contribution of neutral loci at different fre-quencies to the variation in the second subpopulation. The dashed line represents the contribution of loci before
hitch-hiking. Solid lines are the contributions of loci at different Figure 5.—Average Tajima’s D values from simulations distances (r) from the selected gene. 2N⫽1000, m⫽0.00001, (2N⫽1000,m⫽0.00001,s⫽0.5, and ⫽0.0000112) after
s⫽0.5, and ⫽0.0000112. hitchhiking in the first (circles) and in the second (squares)
subpopulations. Each of the points represents an average of 5000 simulations. Horizontal dashed lines correspond to the upper and the lower limits of confidence at the 5% level. the uniform distribution due to migration, but this
devi-ation is relatively small when compared with the effect
of hitchhiking. After the selective sweep, the distribu- of D at the 5% level (critical values from Table 2 of tion of variability of neutral loci is very different in both Tajima1989), about half of them over the upper limit subpopulations. The effect in the first subpopulation of confidence and half below the lower one. This means (Figure 3) is equivalent to that expected in a single that, although the populations were run for enough panmictic subpopulation;i.e., there is a decrease in het- time to reach the neutral equilibrium, genetic drift and erozygosity for neutral linked loci and this reduction population structure cause deviations from the expecta-follows a characteristic pattern: neutral genes at inter- tion of Tajima’s model, increasing the proportion of mediate frequencies contribute to variation less than replicates withDvalues falling out of the limits of confi-expected in a neutral model, and genes at extreme dence.
frequencies contribute proportionally more than ex- As expected after hitchhiking in the first subpopula-pected (see Figure 3). This effect is larger as linkage tion, the number of samples with significantD values with the selected gene gets closer.Tajima’s (1989)D below the confidence limit increased for close linkage
and other statistics were designed to detect this distor- (say r/s ⬍ 0.1), but the average D value was always tion of the spectrum of gene frequencies. over the lower limit of confidence (see Figure 5). The The effect on the second subpopulation is quite dif- increase of variation in the second subpopulation when ferent (Figure 4). For the chromosome region with the linkage was not very tight was associated with an increase largest increase in genetic variance after hitchhiking in the number of significant D values over the confi-(r ⫽ 0.05 for the combination of parameters given in dence limit. For the combination of parameters given Figure 2), there is a maximum contribution of genes at in Figure 5, the increase in the average value ofD af-frequenciesⵑ0.5 and the set of genes at low frequencies fected a broad region around the selected gene. contributes less to variation (see Figure 4). As the
neu-tral gene becomes closer to the selected gene, the
maxi-DISCUSSION mum contribution moves from 0.5 to lower frequencies.
variance is expected only for a narrow section of chro- In our model, hitchhiking behaves like a system that takes variation from the between-subpopulation compo-mosome around the selected gene. The larger theFST
value between subpopulations is before hitchhiking, the nent and injects it into the within-subpopulation one. Thus, FST is expected to be reduced after hitchhiking smaller the section with decreased variability is for
sub-populations other than that where the favorable allele and all our simulations confirm this statement. For ex-ample, in a simulation of 5000 replicates,FSTdrops from first appeared by mutation. The effect can be seen as a
consequence of the increase in the rate of effective 0.90 to 0.18 when r ⫽ 0.001, m ⫽ 0.00001, s ⫽ 0.5, ⫽ 0.0000112, and 2N ⫽ 1000 individuals in each migration: the selected gene enforces the “migration of
linked haplotypes” between differentiated subpopula- subpopulation. These observations seem to be in contra-diction withSlatkinandWiehe’s (1998) prediction of tions, causing increases in diversity under very low
mi-gration rates. an increase ofFSTafter hitchhiking. The disagreement
is a consequence of the differences in the initial assump-To formulate predictions, we have derived
approxi-mations for the expected value of pf, which is the fre- tions of both models. In our model, particular migration and mutation rates are responsible for both the differen-quency after hitchhiking of copies derived from the
original copy associated with the favorable mutation, tiation between subpopulations before hitchhiking and the transfer of the favorable allele from one subpopula-and forE(p2
f). AlthoughE(p2f) is not conceptually equal
to the identity generated by the hitchhiking process tion to another. In Slatkin and Wiehe’s model, there is neither mutation nor drift, and all subpopulations have (because pf2 does not include genetic drift within the
set of neutral copies different fromc), their values are the same allele frequencies before hitchhiking (FST ⫽ 0). Their only parameter for migration is that one single very close and the equation forE(p2
f) has a similar form
to the equation for identity ofBarton(1998, Equation copy of the favorable allele is passed from subpopulation to subpopulation. Therefore, any random process (in-13). The reason is that almost all the identity generated
by the selective sweep is due to the increase in frequency cluding hitchhiking) will certainly produce an increase in FST. Another difference is the way of computation of of the allele originally associated with the selected
muta-tion. the expectedFSTvalues in both models. Slatkin and Wiehe
compute these expectations as 1⫺ (Hs/Ht), where the It is difficult to assess the extent to which the effect
predicted with our model is responsible for the distribu- bar represents the unweighted average over replicates. This is equivalent to averaging FST values weighted by tion of neutral variation in natural populations. Most
of the published research finds reduced diversity in chro- their correspondingHt, the common procedure for av-eraging estimates ofFSTover loci (Reynoldset al.1983; mosome regions with low recombination (Depauliset al.
1999, 2000;Langleyet al.2000;Yi andCharlesworth Weir and Cockerham 1984). In contrast, we obtain the expected valueFSTas the unweighted average over 2000; and review byAndolfatto2001). Although there
is a negative correlation between the recombination rate replicates. We think that this averaging method is more appropriate for the design of experiments measuring and the amount of variation contributed by rare alleles
inDrosophila melanogaster(AndolfattoandPrzeworski hitchhiking, as these deal with a particular genome
re-gion and a particular set of subpopulations. Thus, the 2001), the number of publications reporting significant
and negative Tajima’sDvalues in regions of low recom- interest is focused on the expected distribution ofFST values for a specific region under the effect of hitchhik-bination is small in other species.Hamblinand
Aqua-dro(1996) reported high levels of variability in regions ing rather than on estimating an averaged differentia-tion over the whole genome.
of low recombination in D. simulans. Nachman and
Crowell (2000) reported differences in the level of Although we have focused on the effect of hitchhiking in subdivided populations, the mechanism can operate variation and the spectrum of gene frequencies between
closely linked regions. These results can be explained by on any genetic system where the variation is structured in clusters. For example, the distribution of genetic vari-our model of local differentiation and selective sweeps
affecting the whole population. In other cases there ation in Drosophila is often correlated with chromo-some arrangements. Gene flow between karyotypes is are evidences of a recent hitchhiking with reduction of
variation, but there are not significant deviations from strongly restricted and the sporadic events of recombi-nation or gene conversion would be equivalent to migra-the spectrum of gene frequencies (Hamblin and
Rienzo2000;Vieiraet al.2001,PayseurandNachman tion in our two-subpopulations model. Any favorable mutation would sweep the karyotype where it first ap-2002). These observations can be explained by a
combi-nation of local sweeps, which reduce the neutral variabil- peared and, eventually, will be propagated to the other chromosomal types. Here, karyotypes are equivalent to ity, move the spectrum of gene frequencies toward an
excess of rare alleles, and increase the differentiation of subpopulations. Hitchhiking could explain the ob-served differences in the amount of variation of differ-subpopulations; and sporadic events of selective sweeps
affecting the whole population, which increase the varia- ent chromosome arrangements and the nonnegativeD
values could be evidences of recent selective sweeps tion within subpopulations and move the spectrum in
strongly selected substitutions on neutral polymorphism:
analyti-is also structured around loci with balanced
polymor-cal results based on diffusion theory. Theor. Popul. Biol. 41: phism: if the polymorphism has been maintained for a 237–254.
Tajima, F., 1989 Statistical method for testing the neutral mutation
long time, a genetic differentiation of haplotypes
associ-hypothesis by DNA polymorphism. Genetics123:585–595.
ated with balanced alleles is expected. Selective sweeps
Weir, B. S., and C. C.Cockerham, 1984 Estimating F-statistics for
caused by other genes linked to the balanced polymor- the analysis of population structure. Evolution38:1358–1370.
Vieira, J., B. F. McAllisterandB. Charlesworth, 2001 Evidence
phism could probably explain the observed differences
for selection at thefused1locus ofDrosophila americana.Genetics
in the levels and spectra of variation associated with the
158:279–290.
alleles of the balanced site (Balakirevet al.2002). Wiehe, T. H. E., andW. Stephan, 1993 Analysis of a genetic
hitch-hiking model, and its application to DNA polymorphism data We are grateful to two referees for useful comments. This work was
fromDrosophila melanogaster.Mol. Biol. Evol.10:842–854. supported by Universidade de Vigo, Ministerio de Educacio´n y Cultura
Wright, S., 1951 The genetical structure of populations. Ann. Eu-(PB1998-0814-C03-02) and Ministerio de Ciencia y Tecnologı´a, and gen.15:323–354.
Fondos Feder (BMC2003-03022). Yi, S., andB. Charlesworth, 2000 A selective sweep associated with a recent gene transposition inDrosophila miranda.Genetics
156:1753–1763.
Communicating editor: M.Veuille
LITERATURE CITED
Andolfatto, P., 2001 Adaptative hitchhiking effects on genome variability. Curr. Opin. Genet. Dev.11:635–641.
APPENDIX
Andolfatto, P., andM. Przeworski, 2001 Regions of lower cross-ing over harbor more rare variants in African populations of
Prediction ofpf:As the selected allele agoes to fixa-Drosophila melanogaster.Genetics158:657–665.
tion, the association with the original neutral copycis
Barton, N. H., 1998 The effect of hitch-hiking on neutral
genealo-gies. Genet. Res.72:123–133. reduced by recombination at a constant rater. Within
Balakirev, E. S., E. I. BalakirevandF. J. Ayala, 2002 Molecular the set of chromosomes carrying
a, which has a
fre-evolution of theEst-6gene inDrosophila melanogaster: contrasting
quencyqiat generationi,pirepresents the proportion
patterns of DNA variability in adjacent functional regions. Gene
282:167–177. of chromosomes carryingc. In the next generation, the
Charlesworth, B., M. T. MorganandD. Charlesworth, 1993
value ofpi⫹1can be predicted from the observed value
The effect of deleterious mutations on neutral molecular
varia-at the previous genervaria-ation,
tion. Genetics134:1289–1303.
Cockerham, C. C., 1969 Variance of gene frequencies. Evolution
pi⫹1⫽pi(1⫺(1 ⫺qi)r) . (A1)
23:72–84.
Cockerham, C. C., 1973 Analyses of gene frequencies. Genetics74:
This equation assumes that recombination destroysac
679–700.
Depaulis, F., L. Brazierand M. Veuille, 1999 Selective sweep chromosomes but never generates newacchromosomes
at the Drosophila melanogaster Suppressor of Hairlesslocus and its
back again. Under the conditions for hitchhiking, the
association with the In(2L)tinversion polymorphism. Genetics
consequence of the generation of newacchromosomes 152:1017–1024.
Depaulis, F., L. Brazier, S. Mousset, A. TurbeandM. Veuille, by recombination is negligible and an unnecessary
com-2000 Selective sweep near theIn(2L)tinversion breakpoint in
plication as individuals heterozygous for both loci in
an African population ofDrosophila melanogaster.Genet. Res.76:
repulsion are very infrequent in the subpopulation.
149–158.
Gale, J. S., 1990 Theoretical Population Genetics. Unwin Hyman, The favorable mutation goes to fixation following an
London.
S-shaped series ofqifrequencies. Thus, the equation for
Hamblin, M. T., andC. F. Aquadro, 1996 High nucleotide
se-pfafter fixation can be simplified to
quence variation in a region of low recombination inDrosophila simulansis consistent with the background selection model. Mol.
Biol. Evol.13:1133–1140. E(pf)⫽ p
0
兿
fi⫽0
(1⫺(1 ⫺qi)r)⬇e⫺r兺if⫽0(1⫺qi)⫽e⫺r(f/2).
Hamblin, M. T., andA. Rienzo, 2000 Detection of the signature of natural selection in humans: evidence from the Duffy blood
group locus. Am. J. Hum. Genet.66:1669–1679. The fixation time fdepends mainly on the effective
Langley, C. H., B. P. Lazzaro, W. Phillips, E. HeikkinenandJ. M. population size and the selective coefficient of the
muta-Braverman, 2000 Linkage disequilibria and the site frequency
tion. A good approximation for the mean value is given
spectra in thesu(s)andsu(wa)regions of theDrosophila melanogaster
Xchromosome. Genetics156:1837–1852. byGale(1990, p. 265),
Maynard-Smith, J., andJ. Haigh, 1974 The hichhiking effect of a favorable gene. Genet. Res.23:23–35.
f⫽3.9⫹2 logN⫹2 logs
s ⫺2⬇
3.9⫹2 logN⫹2 logs
s .
Nachman, M. W., andS. L. Crowell, 2000 Contrasting evolutionary histories of two introns of the Duchenne muscular dystrophy
gene,Dmd, in humans. Genetics155:1855–1864. Substituting this equation in the previous one, the
Otto, S. P., andN. H. Barton, 1997 The evolution of
recombina-prediction forpfbecomes
tion: removing the limits to natural selection. Genetics147:879– 906.
E(pf)⫽ (7Ns)⫺r/s.
Payseur, B. A., andM. W. Nachman, 2002 Natural selection at linked sites in humans. Gene300:31–42.
It is worth noting that this prediction is not
determin-Reynolds, J., B. S.Weirand C. C.Cockerham, 1983 Estimation of
the coancestry coefficient: basis for a short-term genetic distance. istic as the approximation of Gale considers random
Genetics105:767–779. events during the fixation process. The prediction is
Slatkin, M., andT. Wiehe, 1998 Genetic hitch-hiking in a
subdi-more simple than that obtained byOttoandBarton
vided population. Genet. Res.71:155–160.
Prediction ofp2
f:At generationi⫹ 1, the expected generation. Therefore, in one generation time, the
ex-pected increase of the number of copies ofain the set value ofp2
i⫹1can be given as a function of the value in
the previous generation: of populations where the allele will be fixed is
E(p2
i⫹1)⫽p2i(1⫺2r(1⫺qi))⫹
pi⫺p2i
2Nqi
. ki⫹1⫺ki⫽ 1⫹ kis⫺1⫺(1 ⫺2s)
ki(1⫹ 2k is) 1⫺ (1⫺2s)ki .
The first term is the square of Equation A1 and repre- The first term on the right-hand side (the number 1) sents the effect of change in the mean value ofpi. The is relevant only in early generations whenk
i⬍ 1/s. It second term is the effect of drift within the set of chro- defines a linear period in which the average number of mosomes carrying the favorable allelea. copies of allele a increases at a constant rate of one The solution for the corresponding differential equa- copy per generation. The second term represents the tion is very complex as the expectationE(p2
i) changes exponential rate of increase in copy number that is with time as allele a goes to fixation. To simplify the
relevant later whenki⬎1/s. The third term is a correc-approach, thep2
i values of consecutive generations are tion that smoothes the transition between the linear scaled (divided) by the square of the expectedpivalues, and the exponential periods. To simplify the solution which is represented by (pi)2in the equation
of Equation A2, we split the evolution of the number of copies ofa into these two consecutive periods: the E
冢
p2
i⫹1
(pi⫹1)2
冣
⫽冢
p2
i
(pi)2
冣
⫹ 1
2Nqi(1⫺2r(1⫺qi))
冢
1 pi
⫺
冢
p 2i
(pi)2
冣冣
. (A2)
period from one single copy to 1/s copies and the period from 1/scopies to fixation. This simplification This equation reaches a nearly constant value when the works better if r is very small when compared with s, number of copies of allele a (2Nqi) is large enough. which is the combination of parameters needed for the Note thatpi is the expected frequency ofc over all the hitchhiking effect. In the first period, we consider that possible populations and its value in consecutive genera- the number of copies of the favorable mutation in-tions can be approximated by Equation A1. Bothpiand creases at an average rate of one copy per generation (pi)2 are considered to be deterministic variables. In
in the set of populations where the mutation is going contrast, the termp2
i is considered a random variable. to be fixed, independently of the selection coefficient As the number of copies of the favorable mutation of the mutation. The simplification for the first period (2Nqi) increases, the second term of Equation A2 de- becomes
creases, and the equation reaches a constant value. Numerical simulations have shown that the
distribu-E
冢
p2 i⫹1 (pi⫹1)2
冣
⫽
冢
p2i (pi)2冣
⫹1
i
冢
1 (1⫺ r)i⫺
冢
p2
i
(pi)2
冣冣
. tion ofp2f(after fixation) over replicates is mainly depen-dent on the random process within the set of
chromo-In the second period from 1/sto fixation, the favorable somes carrying the favorable mutation: the random
mutation increases deterministically at a rate (1 ⫹ s) fluctuations of the frequency of the favorable mutation
per generation, (qi) have little effect, perhaps because of compensation
of deviations around its expectation. Therefore, we have
E
冢
p 2 i⫹1 (pi⫹1)2冣
⫽
冢
p 2 i (pi)2冣
⫹ 1
(1/s)(1⫹s)i
冢
1(1⫺r)(1/s)⫹i⫺
冢
p2i (pi)2
冣冣
. simplified the derivations considering that the
fre-quency of the favorable mutationaincreases
determinis-This is not true when the frequency is high, but this does tically. To approximate the consecutive frequencies over
not affect the prediction because, as we have shown, generations we considered that the evolution of the
the expectation becomes constant when the number of number of copies ki (qi ⫽ ki/2N) of allele a follows a
copies of the favorable gene is large. branching process when ki Ⰶ 2N; i.e., the copies are
Connecting both equations and solving the corre-propagating independently. Let us assume that we have
sponding differential equation, the solution after fixa-an infinite number of identical fixa-and independent
popu-tion is lations withkicopies. Eventually, alleleawill be lost in
a proportion (1⫺2s)kiof all the populations and fixed
in a proportion 1⫺(1 ⫺2s)ki. E
冢
p2 f
(pf)2
冣
⫽e 2(r/s). In the next generation, the expected number ofcop-ies of alleleain all populations is As we have assumed thatp
ichanges deterministically, (pf)2can be considered a constant equal to (7Ns)⫺2(r/s).
ki(1⫹s) .
Therefore For the set of populations in which alleleawill be
even-E(p2
f)⫽(pf)2e2(r/s)⫽(7Ns)⫺2(r/s)e2(r/s)⫽ (2.6Ns)⫺2(r/s). tually lost, the expected number of copies ofais
Intensive simulations were carried out to check the
冤
兺∞x⫽0
e⫺ki(1⫹s)(ki(1⫹s))x
x! (1⫺2s)
xx
冥
/
冤
兺∞
x⫽0
e⫺ki(1⫹s)(ki(1⫹s))x
x! (1⫺2s)
x
冥
⫽ki(1⫺s), equations. A single favorable mutation was put in a
computed in the population. After 10,000 simulations p2
f) were calculated (Table 1). The accuracy of the pre-dictions is very high. Deviations of the observed values for each particular combination ofN,r, ands, the
aver-age frequency of the neutral allele (observed pf) and areⵑ2% forpfandⵑ5% forp2f) whens⬍1, above or below the expectation with no general trend.