(Under the direction of Dr. Cathy Crossland).
The purpose of this study was to investigate student background characteristics, including student mathematical performance and documented teacher ratings of student mathematical performance, and the impact these variables have on eighth grade mathematics placement. The ECLS-K longitudinal data set was used to investigate how each of the following predicted placement in eighth grade Algebra or above: 1) cognitive math
by
Valerie N. Faulkner
A dissertation submitted to the Graduate Faculty of North Carolina State University
in partial fulfillment of the requirements for the degree of
Doctor of Philosophy
Curriculum & Instruction
Raleigh, North Carolina 2010
APPROVED BY:
_______________________________ ______________________________
Dr. Cathy Crossland Dr. Patricia Marshall
Committee Chair
________________________________ ________________________________
DEDICATION
To the memory of my mother Frances Rawhouser Faulkner (1928-2007)
who taught me to respect and enjoy the gifts of all students, and to
Dr. Christy Falba (1949-2010)
BIOGRAPHY
Valerie Ness Faulkner was born in Pennsylvania and raised in Massachusetts and New Jersey. She earned a Bachelor of Arts degree in Anthropology in 1985 from Duke University. In 1994, she earned the Master of Education degree in Special Education from North
Carolina State University. She is a candidate for the Ph.D. degree in Curriculum and
Instruction with a formal minor concentration in Mathematics Education. Valerie began her teaching career in the Durham Public School System in Durham, North Carolina working with students with special needs as a cross–categorical teacher who taught several subjects. During that time she developed a special interest in supporting and tutoring students in mathematics. Valerie then taught for several years in a public separate setting, serving students placed in residential treatment at a state psychiatric hospital in North Carolina. During the years of her doctoral program she worked as a coordinating teacher for the Wake County Public School System in Raleigh, North Carolina, where she specialized in
ACKNOWLEDGEMENTS
An oak tree is just a nut that held its ground – Author Unknown
To the degree that I have developed any tree-like qualities, it has been less a lone nut and more a supportive environment at play. I have many a metaphorical gardener to thank. First and foremost, thanks to Dr. Cathy Crossland for 18 years of providing me with intellectual soil, much needed rain, and regular weeding. I would not be here without her faith in the seed of my ability back in January of 1993. It has been my great honor to have the inimitable and indomitable Dr. Lee Stiff as a teacher and committee member. It was his approach to
addressing issues of equity that influenced my research questions. I thank Dr. Marshall for her continued support. Her determination to address and make evident cultural issues in the classroom has influenced my work since I began teaching in the early 1990s. I also thank Dr. John Nietfeld for his invaluable detailed feedback, accessibility, and enthusiasm for topics of the mind.
There are several people at North Carolina State University, not on my committee, to whom I also owe a great debt. Thank you to Dr. Susan Osborne for encouraging me to pursue my interest in the field of Mathematics and overseeing my development of a course on Special Education and Mathematics before this topic had traction. I would also like to thank Dr. Jason W. Osborne. I could not have developed my confidence in statistical analysis without his clear articulation of the science of academic research. Thanks too, to Stacy Weiss, who provided collegial support throughout the past five years, and to Erica Cutchins who tackled the final details of formatting and kept me from wilting in the autumn of this process.
way including the people at Wake County Public School System and those I worked with through the North Carolina Department of Public Instruction Exceptional Children Division who gave me the space and support to thrive. In particular, I would like to thank Jacki Russell, Dr. Joanne Medlin, Nancy Spencer, Laura Snyder, Susan Davis, Carol Hale, Mary Doggett, and Dr. Chris Cain. Thanks also to the many teachers who influenced and raised me in the public school districts of Worcester, Massachusetts and Jackson, New Jersey including the Rivas, the Santiagos, and my parents—all of whom were both public school teachers and family to me—as well as Eleanor Ryan, Joanne Coley, Judith Katz, and Walter Reed, who taught me to love both thinking and school.
TABLE OF CONTENTS
LIST OF TABLES ... x
LIST OF FIGURES... xv
Chapter One - Introduction... 1
Statement of Problem ... 6
Purpose ... 7
Primary Research Question and Hypotheses ... 7
Limitations and Assumptions ... 8
Operational Definition of Key Terms... 10
Overview of the Dissertation ... 14
Chapter Two – Review of Research... 15
Introduction to the Review of Research... 15
Conceptual considerations... 17
Tracking and Mathematics Placement ... 19
Overview of tracking... 19
Social and academic factors and predictors ... 21
Summary... 27
Teachers and Student Mathematics Placement ... 28
Teacher expectations ... 28
Teacher impressions and judgment of student ability ... 32
Elementary to middle school considerations ... 36
Summary... 36
Special Education and Mathematics ... 37
Special Education instruction and mathematics ... 38
Students with disabilities and mathematics... 39
Summary... 43
Conclusion ... 44
Teacher impressions, student performance and mathematics ... 44
ECLS-K studies... 45
Chapter Three - Methodology... 48
Research Design Overview... 48
Sample Selection ... 49
Data Collection Procedures ... 52
Base-year... 52
Third and fifth grade school years ... 53
Eighth grade year ... 55
Research Variables ... 56
Independent Variables ... 58
Teacher impression of student math ability ... 58
Dependent Variable ... 59
Eighth grade mathematics placement ... 59
Demographic Information ... 61
Receipt of Special Education Services... 61
Race/ethnicity ... 61
Socioeconomic status ... 63
Gender... 63
Research Instruments ... 64
Teacher Academic Rating Scale – Mathematics (TARS)... 64
Student Cognitive Test (MathCOG)... 66
Statistical Analysis ... 67
Weights and design effect... 68
Unit of analysis... 69
Analysis ... 70
Data preparation... 70
Sample: All students and high-performing students... 74
Research Questions... 74
Summary ... 76
Teacher impression of student math ability ... 58
Student mathematical performance... 58
Eighth grade mathematics placement ... 59
Demographic Information ... 61
Receipt of Special Education Services... 61
Race/ethnicity ... 61
Socioeconomic status ... 63
Gender... 63
Research Instruments ... 64
Teacher Academic Rating Scale – Mathematics (TARS)... 64
Student Cognitive Test (MathCOG)... 66
Statistical Analysis ... 67
Weights and design effect... 68
Unit of analysis... 69
Analysis ... 70
Data preparation... 70
Sample: All students and high-performing students... 74
Research Questions... 74
Summary ... 76
Summary ... 109
Chapter Five – Discussion ... 110
The importance of middle school mathematics placement ... 112
Students who receive special education services ... 115
Considerations regarding findings for students in receipt of special education ... 117
Students who are Black/African American... 120
Gender and Black/African American students ... 121
Considerations regarding findings for students who are Black/African American ... 122
Students who are Hispanic ... 124
Students who are Asian ... 125
Limitations ... 129
Implications for future research ... 136
BIBLIOGRAPHY ... 139
LIST OF TABLES
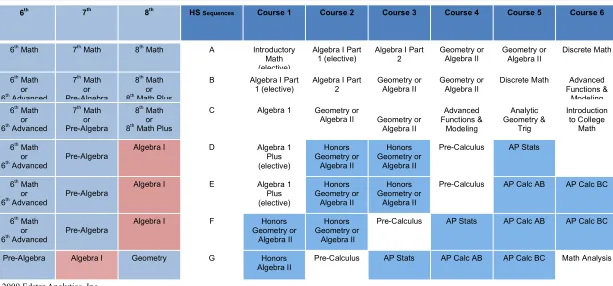
Table 1.1 Mathematics Course Trajectories: Who takes Honors and Advanced Placement Math? (Adapted and used with permission from EdStar
Analytics, Inc.) ... 4
Table 3.1 Distribution of the ECLS-K PSU sample by self-representing (SR) status, metropolitan (MSA) status, and census region ... 51
Table 3.2 Child level assessments and ratings completed in third grade ... 54
Table 3.3 Child level Questionnaires complete in fifth grade... 55
Table 3.4 Child level Questionnaires complete in Eight grade... 56
Table 3.5 Study variables, Definitions, and Corresponding ECLS-K Variables 57 Table 3.6 Teacher Questionnaire, ECLS-K –Student’s Mathematics placement: M7COURSE ... 60
Table 3.7 Creating Dichotomous variable PLACE8 from ECLS-K variable M7COURSE ... 61
Table 3.8 Demographic Background variables and co-variates ... 64
Table 3.9 Teacher Academic Rating Scale – Mathematics Grade Three, sample questions ... 65
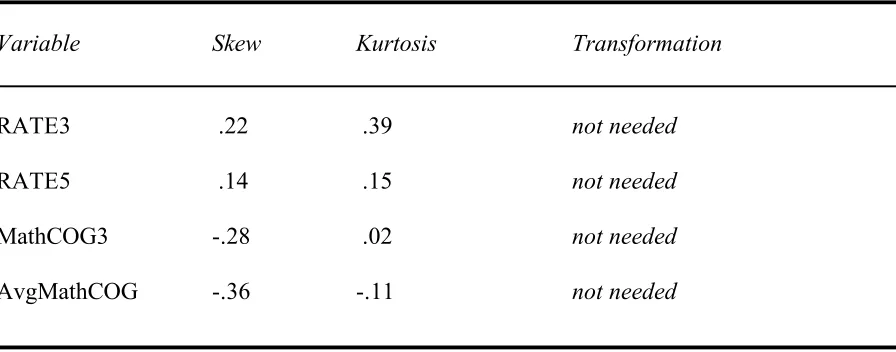
Table 3.10 Data Preparation: Normality of continuous independent variables: RATE and MathCOG... 71
Table 3.11 Data Preparation: Descriptive statistics for dependent variable: M7COURSEPLACE8*... 72
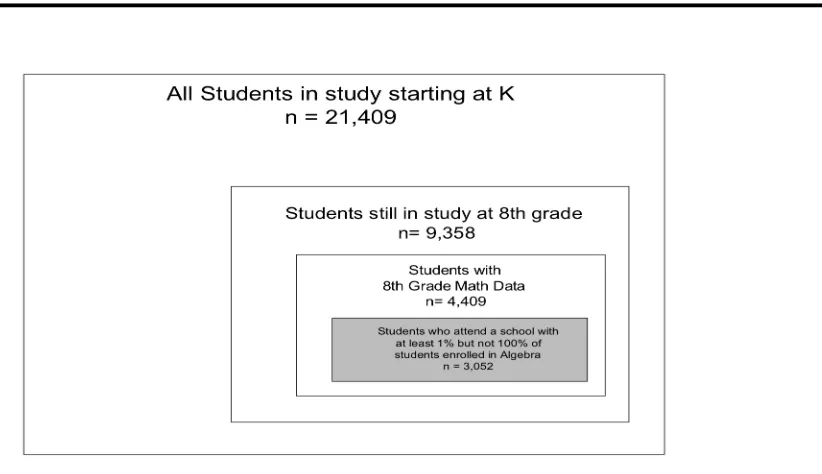
Table 4.1 Students from ECLS-K analyzed for eighth grade math Placement Outcomes ... 78 Table 4.2 High achieving students and subgroups ... 79 Table 4.3 Student Categories: Frequencies and Percentages by the presence
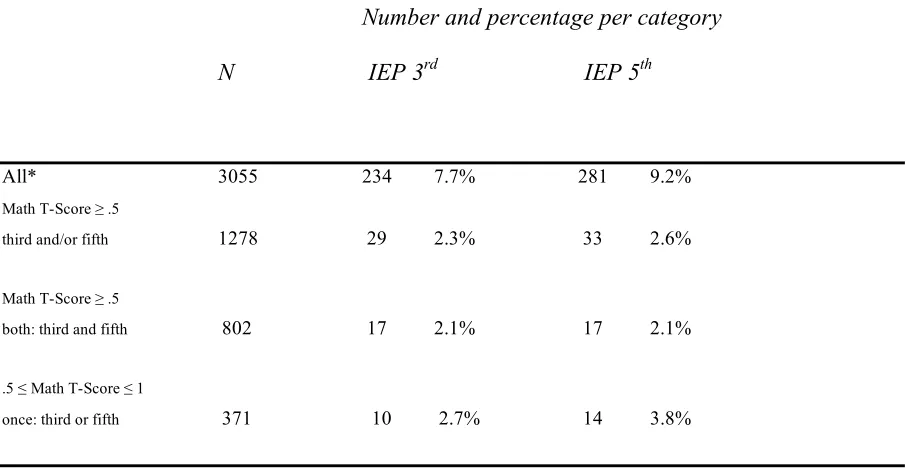
of Special Education Idwenfitication ... 80 Table 4.4 Student Categories: Frequencies and Percentages by Race ... 81 Table 4.5 Student Categories: Percentages Placed in Algebra or Above at
Eighth Grade ... 82 Table 4.6 Correlations: Teacher Ratings, Student Math Performance and
Placement:... 83 Table 4.7 Correlations: Fifth grade teacher rating versus fifth grade student
math performance by race, IEP status, and inconsistently high
performance ... 84 Table 4.8 All students Logistic Regression Predicting Student Placement in
Algebra or above at Eighth Grade—Special Education as a predictor for Eighth grade Placement in Algebra or above while controlling for Race, Gender, SES, Math T-score and Teacher Rating. ... 86 Table 4.9 High Achieving Third and Fifth grade students Special Education as a
Table 4.10 All third and fifth grade: Black/African American and Hispanic race as a predictor for Eighth grade placement in Algebra or above while controlling for Race, Gender, SES, receipt of Special Ed services, Math Z-score and Teacher Rating... 90 Table 4.11 High performing third and fifth grade students Black/African
American race as a predictor for Eighth grade placement in Algebra or above While controlling .for Race, Gender, SES, receipt of Special Education services, Math Z-Score(s) and Teacher Rating. ... 91 Table 4.12 High performing third and fifth grade students Hispanic race as a
predictor for Eighth grade placement in Algebra or above while controlling for Race, Gender, SES, receipt of Special Education services, Math Z-Score(s) and Teacher Rating... 92 Table 4.13 All students - Teacher Rating Versus Cognitive Score as predictor of
eighth grade math placement ... 94 Table 4.14 Placement Prediction – All students Log odds of Placement in eighth
grade Algebra or above Teacher Rating versus Math Cognitive score (average of 3rd and 5th grade scores) utilizing significant predictors and significant interaction ... 95 Table 4.15 Placement Prediction: All Students – Significant interaction,
MathCOG, R ... 96 Table 4.16 Students receiving Special Education services: RATE versus Average
Table 4.17 Placement Prediction - Students with IEP: Log odds of placement in eighth grade Algebra or above Teacher Rating versus Math Cognitive score (average of 3rd and 5th grade scores) utilizing significant
predictors and significant interaction ... 99 Table 4.18 Placement Prediction: Students w/ IEP –Significant interaction, cog
score, teacher rating... 100 Table 4.19 Fifth grade teacher rating versus cognitive score as predictor of eighth
grade math placement for different ethnic groups ... 101 Table 4.20 Placement Prediction - Ethnicity/Race: White Log odds of placement
in eighth grade Algebra or above Teacher Rating versus Math Cognitive score (average of 3rd and 5th grade scores) utilizing
significant predictors ... 103 Table 4.21 Placement Prediction: White – Significant interaction, cog score,
teaching rating... 105 Table 4.22 Placement Prediction: Black/AfAm – Significant cog score, teacher
Table 5.2 Teacher rating as predictor of eighth grade math placement for different student groups Controlling for other background
characteristics - Listed in descending order from most powerful to least... 127 Table 5.3 Student Math performance as predictor of eighth grade math
placement for different student groups controlling for other
background characteristics - Listed in descending order from most powerful to least... 128 Table 5.4 Ratios of significant results: Cognitive Performance/Teacher
Rating ... 129 Table 5.5 Evaluating p values of results with negligible impact due to design
effect adjustments: Samples reported as Significant or
Non-significant ... 133 Table 5.6 Evaluating p values of results with impact due to design effect
LIST OF FIGURES
Figure 1. Data demonstrating extensive overlap between student mathematics performance and ninth grade mathematics placement,
Chapter One - Introduction
The progressive side of the American public education system was fashioned on the notion that intellectual freedom is the primary cornerstone of the system that underpins the development of a democratic society. Within this paradigm, the recognition and
allowing based decision making. This movement has been reiterated anew with the data-driven Response to Instruction movement within special and general education.
Table 1.1
Mathematics Course Trajectories: Who takes Honors and Advanced Placement Math? (Adapted and used with permission from
EdStar Analytics, Inc.)
© 2009 Edstar Analytics, Inc
6th 7th 8th HS Sequences Course 1 Course 2 Course 3 Course 4 Course 5 Course 6
6th Math 7th Math 8th Math A Introductory
Math (elective)
Algebra I Part 1 (elective)
Algebra I Part 2 Geometry or Algebra II Geometry or Algebra II Discrete Math
6th Math
or 6th Advanced
7th Math
or Pre-Algebra
8th Math
or 8th Math Plus
B Algebra I Part
1 (elective) Algebra I Part 2 Geometry or Algebra II Geometry or Algebra II Discrete Math Functions & Advanced Modeling 6th Math
or 6th Advanced
7th Math
or Pre-Algebra
8th Math
or 8th Math Plus
C Algebra 1 Geometry or
Algebra II Geometry or Algebra II Advanced Functions & Modeling Analytic Geometry & Trig Introduction to College Math
6th Math
or
6th Advanced Pre-Algebra
Algebra I D Algebra 1
Plus (elective) Honors Geometry or Algebra II Honors Geometry or Algebra II
Pre-Calculus AP Stats
6th Math
or
6th Advanced Pre-Algebra
Algebra I E Algebra 1
Plus (elective) Honors Geometry or Algebra II Honors Geometry or Algebra II
Pre-Calculus AP Calc AB AP Calc BC
6th Math
or
6th Advanced Pre-Algebra
Algebra I F Honors
Geometry or Algebra II
Honors Geometry or
Algebra II
Pre-Calculus AP Stats AP Calc AB AP Calc BC
Pre-Algebra Algebra I Geometry G Honors
Algebra II
It is important to policymakers and school-based personnel alike that these issues be
understood. If student data are not driving academic trajectories, recommendations and
safeguards will be needed to protect and ensure the objective means by which such crucial
educational decisions are rendered.
This study investigates multiple factors in the processes that appear to determine
placement in eighth grade mathematics courses, with a particular emphasis on how actual
student ability (as measured by mathematics performance) affects placement, compared to
teacher perception of student ability (as measured by teacher rating scale of math ability).
There is substantial evidence supporting the claim that student class placement is not exactly
a neutral proposition; rather the decision is a composite of several factors. Studies have
shown repeatedly, and for decades, that the placement of students in classes or subgroups is
part of a process involving dynamic interactions between teacher expectations (Elder, 2000;
T. L. Good, 1987), student self-efficacy (Schunk, 1991), socioeconomic status (Oakes, 1990;
Rist, 1970) and race (Dauber et al., 1996; Gamoran & Mare, 1989). Demystifying this
process is complicated further by evidence that elementary school teachers may often play a
critical (albeit sometimes “hidden”) role in placement decisions (Dauber et al., 1996). The
impact of elementary school placement decisions for the first year of middle school may well
extend into late middle school although ostensibly made by teachers with whom a student has
interacted more recently. An example of this type of sub rosa decision-making might well be
present to a significant extent in the selection process related to which students are placed in
Academic placement decisions in mathematics have become a dynamic process with
many complicating factors and it is understood that these decisions have a substantial impact
on student outcomes (Burris et al., 2006; Gamoran & Hannigan, 2000; Hallinan, 2003;
Hanushek & Wofmann, 2006). It remains critical that the longitudinal influences leading to
these placement decisions be brought into line with the spirit and expectations of current law
and the practice of data driven decision-making.
Statement of Problem
Teachers form opinions about the potential of their students that results in both minor
and major decisions that can have an immediate impact on the academic paths and
placements for individuals and, collectively, for groups (Dreeben & Barr, 1988; Finley, 1984;
Hallinan, 1988, 1994, 2003; Rist, 1970; Soodak & Podell, 1993). It is well established that
these placements, in turn, have a lasting impact on student outcomes (Eder, 1981; Geiser &
Santelices, 2006; Hanushek & Wofmann, 2006; Rist, 1970; Rowan & Andrew W. Miracle,
1983). These are undeniable patterns in the cultural and professional undertaking of
educating our nations’ children. Much of the inquiry regarding these well-established
phenomena regarding teacher impressions, grouping students, and student performance
outcomes has been focused on populations at either elementary or secondary school levels.
Furthermore, much of the research has focused on literacy skills (specifically, reading). The
present research is designed to extend the understanding of these phenomena by focusing on
longitudinal issues of teacher impressions and student mathematics performance including
the important middle years of upper elementary and middle school. As part of this study,
about all students who belong to a sub-group that has a history of relatively poorer
performance than their peers. In other words, a high performing subset of students from
student groups (Black/African American, Hispanic, students with an Individualized
Education Plan (IEP)) will be analyzed to test whether these high performing students are
being placed in line with sub-group stereotypes or in line with their individual performance
level.
Purpose
The primary purpose of this study is to better understand student trajectories towards
placement in mathematics in late middle school, with a specific emphasis on the roles of
teacher impressions/judgment and actual mathematics performance on such trajectories. The
results of the study will contribute to the body of literature regarding the use of data-based
indicators as a valid and reliable means to interpret disproportionality issues in mathematics
classes. The national and longitudinal nature of the study will allow for an examination of a
phenomenon that has remained largely uninvestigated, i.e., whether, how and to what extent
the judgment of elementary school teachers affects the eligibility and placement of certain
students in middle school math classes, which in turn determines the placement trajectory in
high school math courses.
Primary Research Question and Hypotheses
How accurate are the impressions/judgments of teachers regarding student
mathematics ability and do these impressions/judgments differentially predict for some
subgroups (Black/African American, Hispanic, and students with an IEP) which students will
Hypotheses:
H1: High performing third and fifth grade students with an IEP in place will have
significantly lower odds of being placed in Algebra or above in eighth grade than high performing students without an IEP.
H2: High performing third and fifth grade Black/African-American or Hispanic
students will have significantly lower odds of being placed in Algebra or above in eighth grade than high performing students who are not Black or Hispanic.
H3: For students with an IEP in place, fifth grade teacher rating of student ability will
be a stronger predictor of placement in eighth grade mathematics classes than student performance.
H4: For students who are Black/African-American or Hispanic, fifth grade teacher
rating of student ability will be a stronger predictor of placement in eighth grade mathematics classes than student performance.
Analyses will be run to find significance levels and odds ratios and to test the
contribution of individual regression coefficients. Further investigation will involve analyses
of interactions and prediction equations for student placement in eighth grade mathematics
based on teacher rating and mathematics performance.
Limitations and Assumptions
A national and longitudinal database, Early Childhood Longitudinal Study-Kindergarten,
1998-1999 (ECLS-K), will be used to generate information that examines the relationships
between teacher impressions/judgment, student performance, race/ethnicity, and disability
status. A predictive model will be generated to contribute to an understanding of these
dynamics as they relate to student trajectories.
While this study seeks to inform educational practitioners and policy-makers regarding
factors worthy of note. The ECLS-K data set is used because of its large national scope and
because of its detailed teacher ratings of student performance and cognitive data for student
performance in mathematics. The set does not, however, include a variable indicating when,
how, or specifically by whom a student is placed into an eighth grade mathematics class.
This is a process that may, for any given child, begin or end with a guidance counselor, a
parent advocate, a teacher, a principal, a special educator, or a committee comprised of all of
the above. The mathematics portion of the Teacher Academic Rating Scale (RATE) is used
to approximate the impressions and judgments of teachers about student mathematical ability
that would affect placement recommendations made as students are moved from one grade to
another. These teacher impressions are used as a type of proxy for this decision-making
process and to represent the discussions regarding student placement that occur within and on
the part of the school system as this decision is being made; therefore, there will be no direct
data to indicate that a teacher rating caused a student placement or that teacher impressions
are a one-to-one indicator of teacher decisions about student placement.
While all students will be analyzed in order to better understand the data and trends
within the data set, analysis of high-performing students serve as a second focus. In order to
better understand this dynamic of placement, impressions, and mathematical ability it is
important to account for students who may be perceived to be low-performing because they
truly are performing poorly. These students would not contribute to analysis of whether other
students’ performance is being rated in accordance with negative class associations rather
than positive performance indicators. In other words, as well as analyzing the placement of
students who are in these sub-groups but are performing against stereotype (i.e.
high-performing) will also be specifically analyzed. This stands in contrast to studies that follow
all students of a certain sub-group and report trends for the entire group.
An assumption of the study is that teacher’s impressions may be unwittingly biased with
cultural misunderstandings that may perpetuate the same discriminative classifications that
occur towards certain groups in other aspects of society. It is an assumption of the study that
such cultural misunderstandings contribute to the well documented achievement gap within
certain groups compared to benchmark curriculum expectations. It is further assumed that, if
resistance to utilizing performance-based indicators for student placement decisions is to be
affected, it is critical that data be presented to counterbalance assumptions about student
characteristics and student performance. Therefore, the trajectories of strong performing
students can serve to tell a story not told by statistics that focus on poor performance and
achievement gaps currently in existence.
Students who are inconsistently high-performing will also be analyzed. These students
are, by definition, more difficult to analyze and assess as to their mathematical ability. These
students are likely to be the most affected by and/or vulnerable to teacher impressions and
judgments because their performance, again by definition, is not providing clear indication of
ability. For this reason, these students may also be the most vulnerable to being judged
according to other characteristics such as race or disability status.
Operational Definition of Key Terms
In this research, the following terms are defined with respect to the ECLS-K data set
Teacher Academic Rating Scales – Mathematics: These scales are completed by
teachers on individual students and are a detailed measure of the teacher’s understanding of
the student’s mathematical ability level. The teacher rating scale variable (RATE) will serve
as a record of teacher impression of student mathematical ability.
Student Cognitive Test - Mathematics: This test is a cognitive achievement test
designed by the Institute of Education Sciences-National Center for Education Statistics
(IES-NCES) for the purposes of measuring student ability in mathematics. The cognitive test
variable (MathCOG) will be utilized herein as the mathematical performance indicator.
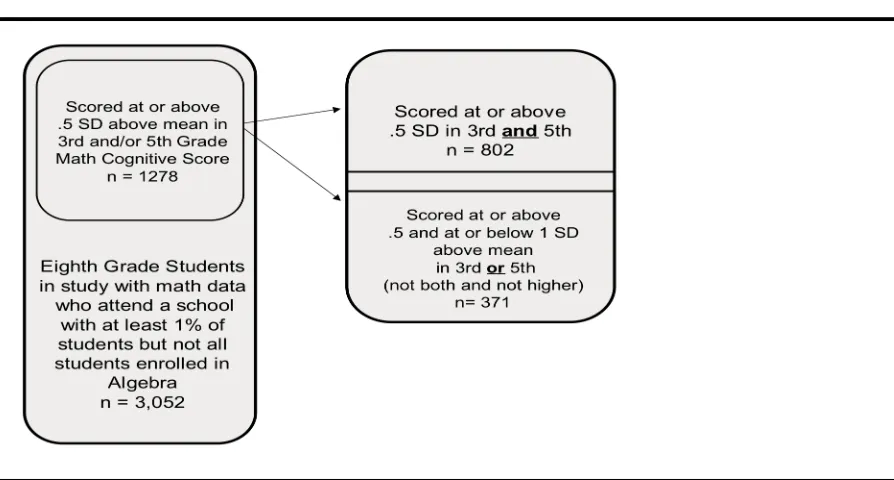
High-performing student: Students are categorized into three different high
performing groups for analysis. The mathematics performance assessment collected as part
of ECLS-K data collection will be used to determine high-performance in mathematics. The
first high achieving group, referred to as the group of all high-performers, scored at or above
.5 standard deviations from the mean (top 31 percent) on either the third or the fifth grade
mathematics performance assessment. The second group, referred to as consistently high
performing, scored at or above .5 standard deviations from the mean (top 31 percent) on both
the third and the fifth grade mathematics performance assessment. The third group, the
inconsistent high performers, scored between .5 and 1 standard deviation (in top 31 percent
but not above top 16 percent) above the mean on either the third or fifth grade mathematics
performance assessment, but NOT on both.
Eighth Grade Mathematics Placement: This information is a part of the ECLS-K
teachers. Students are categorized as either being in Algebra (or above) by eighth grade or
not.
Special Education Placement: At the third and fifth grade levels each student was
coded in the ECLS-K data set regarding whether or not the student was in receipt of special
education services. This variable will be used to determine if the student is a student with an
Individualized Education Plan (IEP).
Race: A composite variable for race/ethnicity is utilized. At the fifth and eighth grade
levels, race information was not collected for the ECLS-K and instead the ongoing variable
was recorded on the basis of information collected in previous parent interviews. The race
information used in this study, therefore, is derived from a composite variable that utilizes
both parent responses when available and data collected by field staff in the computerized
Field Management System (FMS) to complete data missing from parent interview. At the
third grade level student-level race information is requested specifically in parent interviews
and also collected through the FMS as a back up to parent data. Five race categories were
used (White, Black or African American, American Indian or Alaska Native, Asian, Native
Hawaiian or other Pacific Islander). Parent/Respondents were allowed to indicate that their
child belonged to more than one of these dichotomous categories. Another dichotomous
variable was created for those who indicated that their child was biracial or multiracial. Data
were collected on Hispanic ethnicity and this was combined with the race data to create a
categories: White, non-Hispanic; Black or African American, non-Hispanic; Hispanic, race
specified; Hispanic, no race specified; Asian; Native Hawaiian or other Pacific Islander;
American Indian or Alaska Native, and more than one race specified, non-Hispanic.
These categories are then combined for this research into the following categories:
White, non-Hispanic (WH), Black or African American, non-Hispanic (B/AA), Hispanic, race
specified + Hispanic, no race specified (HSP). Other race categories will not be specifically
analyzed through the hypotheses, but will be used as co-variates and reported as Asian and
PINt+1 (students identified as Pacific Islander, Native American, or more than one category).
Socioeconomic composite: A composite scale score is provided within the ECLS-K
for each student based on socioeconomic indicators of both prestige and wealth. These
indicators are: Father/male guardian’s education; Mother/female guardian’s education;
Father/male guardian’s occupation; Mother/female guardian’s occupation; and Household
income. This composite socioeconomic variable will be utilized (SES) and run as a
co-variate.
Gender: As with race, gender data is not collected after the third grade year. In order
to assure that gender reports are accurate, ECLS-K staff has crosschecked data and a
composite variable created to reflect student gender based on most-common responses
through third grade. This data is then crosschecked with FMS data and a judgment on student
gender is rendered based on the totality of the evidence collected. This composite variable,
Overview of the Dissertation
Following this introductory chapter to the current research is the literature review.
The review is divided into three sections: tracking and mathematics placement; teachers and
mathematics placement; and special education and mathematics as it relates to the current
study.
The third chapter, Methodology, begins with a description of the ECLS-K data set
and issues pertinent to this research such as how participants were identified, how research
was conducted regarding the collection of data and what procedures were in place throughout
the study. This section then describes the dependent and independent variables utilized.
Details regarding the use of logistic regression to create predictive values and investigate the
hypotheses are also provided.
In the fourth chapter, Results, the outcomes of the analysis outlined in Chapter Three
are presented. This includes presenting the predictive values for teacher impressions and
student ability utilizing logistic regression.
Chapter five, Discussion, explores the implications of the results as they relate both
to our understanding of the dynamics of student placement and to efforts to make practice
and policy changes to close the achievement gap. Finally, the limitations of this study and
Chapter Two – Review of Research
Introduction to the Review of Research
Research on the teachers’ role in placing students along an academic trajectory in
mathematics is limited, particularly with respect to the transition from elementary to middle
school. In 1990, Oakes characterized studies that investigate teacher judgment of student
intellectual ability and the impact of that judgment on outcomes as “an often neglected key to
understanding the distribution of critical features” of mathematics (and science) classrooms
(p. 17)(Oakes, 1990). Around the same time, Garet and Delaney conclude that “researchers
should give more attention to the school level processes involved in matching students to
courses” (p. 76) (Garet & Delany, 1988). In the twenty years since these observations were
made there has been research designed to understand patterns of how students are
academically tracked in mathematics but their remains little focus on the teachers’ specific
role in this phenomenon. The transition from elementary to middle school is an area
particularly important for further research as it is in this time frame that critical academic
decisions are made regarding a student’s placement in mathematics (Dauber et al., 1996;
Useem, 1992).
For decades, researchers have investigated issues that arise when students are tracked
into different groups or classes according to perceived ability. Initially research focused on
macro-analyses of the sociological and academic causes and effects of schooling and of
tracking students (Bowles & Gintis, 2002; Cahan & Linchevski, 1996; Gamoran & Mare,
practices may be affecting students differently according to socioeconomic status and race.
During the same general period, the “at risk” model was popularized as a means of finding
students in need of intervention by considering socioeconomic status and race (Donnelly,
1987; Slavin, 1987). Eventually, and concurrently, researchers began to investigate
smaller-scale issues regarding tracking and student academic placement, issues that are best
investigated at the teacher and classroom level (Eder, 1981; Finley, 1984; Rist, 1970; Ritts,
Patterson, & Tubbs, 1992; Useem, 1992). This included research on teacher expectations of
student performance (Brophy & Good, 1986; T. Good & Brophy, 1974; T. L. Good, 1987).
These studies contribute to the understanding of the dynamic of student placement in an
academic trajectory. Issues regarding special education dovetail with these issues regarding the
dynamics of academic placements for two primary reasons: 1) minority students continue to
be identified for special education at a higher rate than majority students (Artiles & Trent,
1994; Services, 2002) and 2) special education students are regularly served in a setting
separate from their peers and are thus routinely “tracked” in their own rite (Lipsky &
Gartner, 1987). Currently, research and policy recommendations in both special and general
education have begun to turn towards academic indicators and responsiveness to academic
treatments for assessment of a student’s risks and needs (Fuchs et al., 2005; Fuchs, Fuchs, &
Hollenbeck, 2007; Marzano, 2003; Stecker & Fuchs, 2000).
Investigating the patterns surrounding students who perform against stereotyped
impressions and student academic placement in mathematics. The literature relevant to this
study will include studies that investigate the issues of student placement particularly as they
relate to mathematics. Studies that establish the tendency of current practice to disadvantage
stereotyped demographic populations (specifically Black/African-American students and
Hispanic students) studies regarding special education and mathematics, and studies that
investigate teacher’s evaluative impressions of students will be highlighted. The review is
divided into three sections: tracking and mathematics; the teacher and mathematics placement;
and special education and mathematics.
Longitudinal studies provide information regarding the impact that placing a student
in a given group, class, or track has on longer-term academic outcomes. Large-scale and
district wide studies provide information about differential impacts on students from different
demographic backgrounds. Studies designed to investigate classroom dynamics provide
insight into the specifics of classroom decision-making and teacher involvement in the
process of student academic placement.
Conceptual considerations
As the issues of race, socioeconomics, and disability are reviewed and investigated
herein, it is important to note the vast experiences that we bring to bear in interpreting
findings. In particular, conceptual considerations of race are invoked just by using
Black/African-American, White, and Hispanic as variables. The structure of research
Lewis, & Mueller, 2007). One is to identify black students as either embodying an entire
cultural experience that stands in contrast to the normative ‘white’ experience. The other is to
“collapse conceptually the statistical relationships they document between race and the
moderating variable under study” (p. 542). I ask the reader to interpret the literature and
research presented with a finer brush and to resist any tendency to over-interpret statistical
data as it relates to the experience of any individual student. The problematic nature of
over-interpretation is demonstrated by Koretz& Kim (2007) in their analysis of ECLS-K data.
They analyze relationships in gap patterns nationally and then across three different states
and find very low correlations with respect to patterns in differential item analysis and
student responses (Arkansas v. Alabama, r = .33; Arkansas v. Michigan, r = .36; Alabama v.
Michigan, r =. 25). They find that, while national references to an achievement gap may
represent a certain overall pattern, it is misleading to assume that this pattern is consistent
across region, state and (by extension) individual experience and warn against making local
inferences based on the national data. (Koretz & Kim, 2007). In the current study,
high-performing students are disaggregated in order to better understand trends and experiences
within the sub-groups.
Among the four recommendations made by O’Connor and her colleagues are to (b)
bring attention to the way race is a product of educational settings as much as it is something
that students bring with them and (c) focus on how everyday interactions and practices in
intention herein to focus on how the everyday interaction of teachers’ impressions of student
ability may contribute to students’ educational outcomes. It may be less obvious that it is
also a focus here to consider how race may be a product of the educational setting, but this
paradigm is also pertinent. To the degree that race plays a part in a teacher’s decision-making
process it is the teacher who is creating the “product” of race. Actions based on a conception
of race are outside of the control of the student even though he or she is the ostensible bearer
of that ‘race’. I would argue that the same paradigms are in play as we consider the issue of
disability status, as well. Namely, that impressions about a class or group held by the teacher
contributes to the de facto “product” of that group.
Tracking and Mathematics Placement
Overview of tracking
This section provides an overview of tracking practices and the impact of tracking
practices on student populations. The section includes first the findings of two literature
reviews on the effects of tracking and ability grouping through the late 1990s and in the
United States. For context, a study that investigates the issue of tracking on an international
level is also included.
Gamoran (1992) summarized the research on grouping and tracking practices and its
effect on student performance. He concluded that, while grouping and tracking do not
promote overall achievement in schools, they do promote inequity. In his own 1987 study,
Gamoran found that achievement gaps widened more for high school students who remained
not. Elementary school studies also demonstrate that student learning inequalities increase
over time with a grouping model in place. In explanation of this increasing inequity,
Gamoran sites studies that point to differences in instruction as well as differences in student
attitudes and behaviors in the different groups or tracks. Gamoran concludes that tracking
should be reduced or eliminated and that ability grouping should be improved to incorporate
those practices that have been found effective in that setting.
Looking specifically at math and science and the practice of tracking, Haury and
Milbourne (1999) site Mullis’ 1991 estimation that by eighth grade over two-thirds of
students in the United States are tracked into differentiated math classes (Haury &
Millbourne, 1999) . These authors characterize the repeated demonstration of a connection
between demographic grouping and ability grouping as troublesome. Bringing the practice of
tracking into context, these authors cite the United States’ poor performance in international
comparisons and the National Assessment of Educational Progress to argue against any
reason for continuing existing practices. These authors conclude that given the
preponderance of the evidence, any marginal benefits found for the highest achieving
students are more than counteracted by losses among other students.
Hanushek and Wofmann use a differences in differences approach to analyze the
affect of tracking both within a country over time and also between countries. The
International Mathematics and Science Studies (TIMSS) and Program for International
Student Assessment (PISA) measures from primary and secondary school are used as
measures of performance. Elementary grouping practices are not considered in this study and
placements in separate classes begin. Elementary school student scores are used as pre-test,
and secondary scores of the same students as post-test to analyze the effect of tracking
practices within a given country. The primary school scores are then used as a control and
comparing performance differences between primary and secondary school scores across
early-tracked and late-tracked countries identifies the effect of tracking. Variance in
performance is also used as an indicator of the effect of tracking on student performance over
time. The authors find that the differences between early-tracked and late-tracked countries
are systematic and substantial. The data “suggest that early tracking practices increase
educational inequity” within a country and are associated with a tendency to “reduce mean
performance” between countries (p. 63) (Hanushek & Wofmann, 2006).1 When controlling
for economic differences between countries the effects of tracking are substantially
unchanged. What’s more, there is no evidence that stronger performing students gain from a
system of early tracking, as these students also experience a reduction in expected gain from
their elementary scores consistent with the overall reduction in gains found for students in
early-tracking countries as a whole.
Social and academic factors and predictors
This section will review studies that analyze relationships between mathematics
1 In this study, because the effects of broad-scale tracking are being measured (and not
within-class grouping) the United States is categorized as a late-tracking country. The U.S.
placement and social and academic characteristics of students. Two studies are reviewed.
In a longitudinal post hoc study involving more than 4,000 subjects and representing six
schools in a mid-western region, Hallinan (2003) investigates student class placement and
academic outcomes over the course of three years2. Student scores on a
statewide-standardized achievement test are used to measure achievement outcomes and represent the
dependent variable. A regression model3 is utilized to analyze the effect of various
independent/control variables (for instance, class placement (track), previous test scores,
gender, race, inclusion in a free lunch program, age, and school) on the dependent variable.
The researchers identified five levels of placement for mathematics classes: Advanced,
Honors, Regular, Basic and Very Basic.
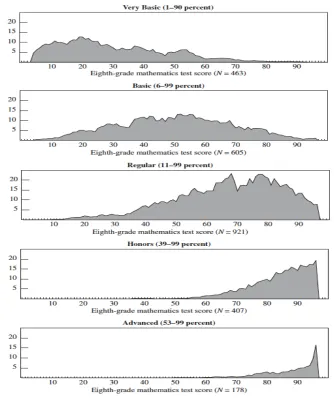
The author comments extensively on the initial descriptive statistics for the
mathematics groups (See Table 2.1). She points out how students with virtually any given
achievement score could be placed in one of at least three different class levels. Hallinan
(2003) summarizes a primary concern for this overlap pattern as follows:
The extent of the overlap in the ability group distributions also suggests that not all the
assignment criteria used by schools are designed to maximize group homogeneity.
While it is often believed that schools rely primarily on test scores and grades to make
ability group placements, these data suggest a heavy influence of nonacademic criteria as
well. (p.114)
2 Students with exceptional needs and students learning English as a second language are
excluded from the study analysis.
3 A censored regression model (tobit) is used to account for the limiting factor inherent in
Figure 1 Data demonstrating extensive overlap between student mathematics performance and ninth grade mathematics placement. From Hallinan, 2003
A prediction model is also utilized to estimate outcome scores for students had they
student of like background would gain in achievement by virtue of a higher class placement.
For instance, students placed in the Regular level scored on average 61.4. Like students are
predicted to score 67.6 (Honors) and 76.1 (Advanced) if Placed in a higher track (Hallinan,
2003).
In a longitudinal study that spanned 9 years (from first through eighth grade) Dauber,
Alexander and Entwistle (1996) analyzed the tracking patterns in place in an urban school
district with a majority of African-American students. They utilized logistic regression to
analyze data from the Beginning School Study (BSS), a longitudinal study of school children
in Baltimore. In particular, the researchers were interested in analyzing placement patterns in
English and Mathematics from elementary into sixth grade and tracking these patterns
through eighth grade placement. The outcome variables relevant herein included placement
in three possible categories of eighth grade mathematics: remedial, regular or advanced.
Predictor variables included 1) background characteristics such as race and mother’s
educational background, 2) academic records, including scores on fifth grade achievement
testing, and 3) parent and student academic expectations as measured by questions within the
BSS. (Dauber et al., 1996). The only academic placement wherein student expectations
neared significance was for eighth grade math placement (odds ratio .80, p < .10). Parental
expectations were significant for sixth grade math placement (odds ratio 1.47, p < .05) but
not for eighth grade placement (odds ratio .53, p > .10). At the same time, only a “weak
articulation” was found between academic records in elementary school and middle school
math placement. Once in middle school, however, the relationship between sixth grade math
< .05). Socioeconomic status was found to be a significant factor for placement in advanced
math classes in sixth grade (odds ratio 2.04, p < .01) but not at the eighth grade (odds ratio
.74, p > .10). Moreover, the correlation for race and advanced math placement was less
reliable in eighth grade (odds ratio -1.46, p <. 10) than at the sixth grade (odds ratio 1.25, p <
.05). The authors take extensive time to analyze these findings in their conclusion noting that,
when analyzing placement at the eighth grade level alone, the strong correlation between
sixth grade placement and eighth grade placement may serve to hide from view the actual
affects of background characteristics. Because sixth grade placement affects performance in
middle school math achievement, eighth grade students will perform substantially in line
with their track placement thus obscuring the effects of factors found earlier. This concern
and argument is identical to the one presented by Rist (1970) when he discussed the
self-fulfilling prophecy created by kindergarten group placements that were then perpetuated
through the second grade. Initial patterns are obscured and socioeconomic patterns solidified
as students are differentially affected by tracking opportunities.
Interested specifically in students who were English language learners (ELL),
Callahan (2005) investigated the impact of several independent variables on academic
outcomes such as grades and performance on standardized achievement tests. In a diverse
California school all ELL students in the school (N = 355) were analyzed. Of these students,
89% were Spanish language speakers. In this analysis, tracking practices showed a stronger
impact on student outcomes than did student knowledge of English. Whereas knowledge of
English demonstrated a reliable correlation close to zero on both the SAT9 (r = .181, p > .01)
placement had a moderate and reliable relationship on math academic performance measures
(SAT9: r = .274, p < .001; CAHSEE: r = .317, p < .01). The author concludes that tracking
plays “ a much larger role than previously believed in predicting English learners’ academic
achievement” (p. 324) (Callahan, 2005).
In a report for the Center on Education Policy, Kober (2001) conducts a review of the
achievement gap between white and minority students and provides policy recommendations.
Among these recommendations is expanding access to advanced courses in high-minority
schools. Raudenbush, et al (1998) analyze state-by-state data within the National Assessment
of Educational Progress (NAEP) for mathematics. They conclude that providing greater
access to academic resources that predict success (among them teacher emphasis on
mathematical reasoning and students taking algebra) is clearly an issue that needs policy
consideration in efforts to close the achievement gap (Raudenbush, Fotui, & Cheong, 1998).
While advanced classes and course-taking patterns do seem strongly related to issues
regarding race, socioeconomic status, mathematics, and academic achievement, some
researchers question the role of course taking as a mechanism for closing the achievement
gap.
More recently, in a review of NAEP data and other pertinent literature Lee (2002)
reports that the course-taking gap has closed from 1.2 in 1978 to 1.0 in 1999 for white versus
black students, meaning that the same percentage of students who are white and black take
advanced courses. This gap narrowed from 1.4 to 1.1 for Hispanic students in the same time
frame. Lubienski & Shelley (2003) analyzed data from the 1990, 1996 and 2000 rounds of
taking patterns, they conclude that any gap is largely explained by SES rather than by race.
They further cite the large difference in achievement scores for 12th grade students who take
calculus (white 344, black 314, and Hispanic 318) to argue that course taking is a correlate
to, but not a solution to, reversing the achievement gap.
It is of note, however, that the articulation of advanced course-taking patterns in the
NAEP may itself explain these conclusions. As noted in Lee (2002) the NAEP data defines
‘advanced’ courses as taking any one of a number of standard high school classes (algebra 1,
geometry, etc.) by 17 years of age. This definition does not ground these courses in the
context of place (resource class, lower-level, general, or honors) or time (eighth grade, ninth
grade, eleventh grade, etc.). Lubienski and Shelley’s own descriptive statistics using the
NAEP data from 2000 suggest that there is a course-taking gap (for instance, 14% of white
students, 5% of black students and 6% of Hispanic (sic) 12th grade students report taking
calculus). Students who take calculus by 12th grade would fit into an advanced course-taking
pattern consistent with definitions of such found in studies such as Hallinan (2003) and
Dauber, et al. (1996) cited above, as well as the present study. Without factoring in issues
related to drop-out, it appears that white students are at least 2.3 – 2.8 times more likely than
their Hispanic and Black/African-American peers to be taking courses that are in the
advanced math track as it is defined herein.
Summary
Tracking practices do not appear to benefit schools or students with regard to
increased academic achievement. Prediction models indicate that students who are placed in
Furthermore, tracking practices appear to differentially affect students according to
socioeconomic status and race. Students who are Black/African-American and Hispanic
continue to take advanced mathematics classes (such as calculus) at rates well below their
white peers. Furthermore, recent studies indicate that an achievement gap persists between
white students and their minority peers. The mechanisms for these phenomena are not fully
understood, although differences in schooling opportunity at the secondary level may play a
Teachers and Student Mathematics Placement
In this section the role that teachers play in the process of placing students in different
mathematics classes will be reviewed. Several constructs exist that are related to the role of
teacher’s as evaluators of student ability in mathematics. These constructs include teacher
expectations for student performance, teacher beliefs regarding mathematics, and teacher
impressions and judgment of student ability in general. These constructs will all be explored
in order to frame the issue of teacher impressions of student mathematics ability and how it
may affect the student placement process.
Teacher expectations
In a review of two decades of research on teacher expectation effects, Good (1987)
defined teacher expectations as “inferences that teachers make about the future behavior or
academic achievement of their students, based on what they know about these students now”
(p. 32). Teacher expectation is further defined by including two specific types of expectation
effects. These are 1) self-fulfilling prophecy effect wherein teachers believe something that is
substantively untrue about the child until that belief becomes actuated, and 2) sustained belief
effect whereby a teacher maintains an outdated belief about a child in spite of newer
evidence. Good notes that while the former of these two is more potentially powerful, the
latter is likely more commonplace. Good characterizes the body of research on teachers’
expectation effects as leading to a consensus that they “can and sometimes do affect
teacher-student interaction and teacher-student outcomes” and notes that the processes involved are “much
analysis is quite complex due to the fact that teachers hold multiple beliefs and students
possess multiple characteristics (T. L. Good, 1987).
Regarding teachers’ development of an understanding of student ability, Good
summarized that teachers do make reasonable assessments of student ability levels. While
background factors such as race and disability status can affect teacher impressions of a
student, teachers “usually develop accurate expectations about their students, and they tend to
change these expectations as more or better information becomes available” (p. 34). These
findings imply that the impact of self-fulfilling prophecy effects are delimited and tend to
occur when students are new to a teacher, as in the beginning of the school year. These
findings do not preclude an impact from sustained belief effects, however, because teachers
may hold onto initially accurate impressions of unambiguous student behaviors and then
maintain their initial expectations for students (T. L. Good, 1987).
In spite of teachers’ relative strength in originally developing expectations for
students, particularly with regard to behaviors that are relatively unambiguous, teachers do
demonstrate differential behaviors towards different students. This appears to contribute to
effects of the sustained belief type. For instance, Good cites Anderson and Levitt’s (1984)
finding that teachers interpret ambiguous student behavior or performance based on their
differing expectations of student performance. Good maintains that these ambiguous events
compose the bulk of classroom interactions and have the potential to have a substantial
impact on students. Good cites several studies that support the notion that student
presentation (timing of misbehaviors, language use) also contribute to teachers’ tendency to
expectations about their own teaching effectiveness, student effort and ability, and
curriculum pedagogy (among a myriad of other definable characteristics) are all part of an
interplay that can effect student outcomes (T. L. Good, 1987)
Teacher beliefs and mathematics tracking
The general merit of tracking or grouping students according to mathematical ability
level appears to be a common belief among teachers. Oakes (1990) finds that the use of
tracking and ability grouping in mathematics (and science) is widespread and believed by
educators to be appropriate because of different ability levels within the students. Cahan, et al
summarize neatly the research on this belief specifically as it relates to mathematics:
The main justification for using ability grouping is the need to adapt content, level,
pace and teaching methods to students who function at varied levels (Slavin, 1988,
1990; Sorenson & Hallinan, 1986). Such a didactic fit is considered particularly
important in mathematics, not only because ability is seen as the central factor
explaining differential achievements in this domain (Lorenz, 1982), but also because
mathematics is perceived as hierarchical, serial, or cumulative (Ruthven, 1987),
which makes it difficult to work with heterogeneous groups. Thus, while more than
80% of mathematics teachers believe that their subject is inappropriate for teaching
groups of students of mixed ability, only 16% science teachers and 3% of English
teachers hold this view about their own subjects (Her Majesty’s Inspectorate, 1978,
1979, 1980).
While the exact nature of how this belief may affect teacher impressions of student ability
about the nature of mathematics would have an impact on teacher assessment of student
learning and ability in mathematics. It is unclear if this belief is in any way helpful in
evaluating student ability or if teachers are consistent in how they see mathematics as a
discipline and how they assess mathematics as a learning task.
Nathan & Koedinger (2000) studied teacher beliefs about mathematics curriculum
and did find that teachers’ latent beliefs correlated with assessment of algebraic tasks rather
than their self-reported beliefs. One hundred and seven kindergarten through twelfth-grade
teachers who teach mathematics were interviewed regarding their own beliefs about
mathematics and also asked to analyze algebra problems based on difficulty level in order to
understand how these beliefs are applied to mathematics in the classroom. These researchers
found that teachers’ self-reported beliefs about mathematics are consistent with National
Council of Teachers of Mathematics (NCTM) reform principles (developing meaning,
analyzing solutions, etc.). This self-report of what matters in mathematics and how the
students access mathematics revealed a conceptual orientation on the part of the teachers.
Teacher beliefs were also inferred from how teachers ranked the hierarchical difficulty (for
students) of 6 different algebra problems (Nathan & Koedinger, 2000). Unlike their
self-report, teachers analyzed problems based on what the authors label a ‘symbol-precedent’
construct (as opposed to an organization based on concept difficulty). In other words,
teachers thought they were prioritizing concepts as a way to access mathematics, but their
task analysis of math tasks prioritized the manipulation of symbols. Consistent with their
findings regarding teacher assessment of how students will perform on given mathematical
Kahneman & Tversky, 1973) indicating that people do not necessarily follow logic or
probability when making decisions (Nathan & Koedinger, 2000). In this case, the teachers’
own beliefs about how they see mathematics did not match their latent beliefs as manifested
in their analysis of mathematical problems. Moreover, the authors found that there was a
pronounced difference in the teachers’ ability to predict student difficulty with algebra
problems when analyzed by those who teach elementary, middle or high school. The middle
school teachers were the best at predicting student performance on algebra tasks. The high
school teachers, who demonstrated the strongest correlation to the symbol-precedent
construct, were the weakest at predicting student ability with actual problems and were the
least aware of effective alternate solution strategies (Nathan & Koedinger, 2000).
There is also evidence that teachers may sometimes play a role in the student
assessment and placement process that is entirely outside the scope of student ability itself. In
a study designed to investigate social issues inherent in tracking practices, Finley (1984)
utilized a case-study approach in a suburban high school. Eighteen teachers were interviewed
and observed. Finley concludes that teachers, in effect, competed for higher tiered classes
that contained largely “privileged Anglo families” (p. 242). She contends further that the
tracking system itself was, at least in part, not the result of student need but a
teacher-motivated desire to create and maintain a status hierarchy within teachers’ professional
control (Finley, 1984).
Teacher impressions and judgment of student ability
In a 1990 National Science Foundation report, Oakes summarized the effects of
author analyzed mathematics and science classrooms using the 1985-1986 National Survey
of Science and Mathematics Education (NSSME) and combined this information with a
review of other literature on the topic. Through cross-tabulations, correlation analyses and
analysis of variance, schools serving different populations of students were analyzed.
Multivariate analyses were also used to isolate specific variables related to classroom
distributions (Oakes 1990). Germane to this section is the review and analysis of teacher
judgment about student ability and the impact this has on grouping students.
Oakes characterizes studies that investigate teacher judgment of student intellectual
ability and the impact of that judgment on outcomes as “an often neglected key to
understanding the distribution of critical features” of mathematics (and science) classrooms
(p. 17). Issues of teacher judgment are deemed particularly important for poor and minority
students, as these students were more likely to “experience initial learning difficulties” and
be judged with ‘low ability.’4 Oakes reports further that this is also reflected at the class level
as elementary classes with disproportionately minority students were seven times more likely
to be identified as low-ability than high-ability (emphasis in original p. 23). At the high
school level, classes with predominately white students are described by school personnel as
high ability 57% of the time whereas classes with a majority of non-white students are
described as high ability 9% of the time.
As well as her own studies, Oakes cites several other studies regarding teacher
judgment. These studies serve to accentuate Oakes’ point regarding a lack of focus on
4 If we invoke Good’s distinction for teacher expectation, we see here that an initially
teacher judgment. While these studies involve student placement in different tracks, none of
these studies refer specifically to teacher judgment and impressions of student mathematical
ability as it relates to student outcomes. One study does find that student perceptions of their
own track placement affects their own outcomes (Gamoran, 1987).
Although not with regard to mathematics, other studies have dealt specifically with
teacher impressions of students and how this affects their judgment of student ability. In an
extensive review of the literature on teacher impressions regarding student physical
attractiveness, Ritts and colleagues (1992) review specifically the literature on teacher
impressions and include discussion of other variables studied within this context (Ritts et al.,
1992). They found one study (Morrow & McElroy, 1984) that investigated the affects of
student attractiveness on teacher rating of student academic performance. This study did not
find an effect for attractiveness when teachers were rating expected performance. Past
performance itself accounted for the greatest variation in ratings. Physical attractiveness does
not appear to mitigate that judgment.
Several studies are reviewed that consider race within physical attractiveness studies,
and here, on the other hand, it was concluded that race was a “potent source of input into
teachers’ impressions” (p. 421). Ritts and colleagues summarized the conclusions of this
sub-set of the research and found that teachers: (a) rated black students less favorably, (b) treated
black students less favorably in the classroom and (c) held lower academic expectations for
black students than for white students (p. 421). The race of the teacher did not appear to
matter in these constructions as Cross and Cross (1971) found that this was true for both