Gene expression in plastids of higher plants:
evolutionary and functional aspects of different RNA
polymerases – coordinated assembly of
multiprotein-complexes
Gene expression in plastids of higher plants:
evolutionary and functional aspects of different RNA
polymerases – coordinated assembly of
multiprotein-complexes
Inaugural-Dissertation der Fakultät für Biologie
der Ludwig-Maximilians-Universität München
vorgelegt von
Juliana Legen
1. Gutachter: Prof. Dr. Reinhold G. Herrmann 2. Gutachter: Prof. Dr. Hans Ulrich Koop
1. Introduction………1
1.1. Structure and organisation of plastid chromosomes…..………..……….….1
1.2. Expression of plastid chromosomes……….……….4
1.2.1. Transcription………..5
1.2.2. Posttranscriptional RNA processing………..………6
1.2.3. Translational control of plastid gene expression………..…………...9
1.3. Thylakoid membrane-located multiprotein complexes………...9
1.3.1. Synthesis and assembly of the cytochrome b6/f complex………10
1.4. Goals of this study………..12
2. Materials……….………14
2.1. Chemicals and enzymes……….……..14
2.2. Length and weight standards………...15
2.3. Antibodies………15
2.4. Bacterial strains………..16
2.5. Plasmids………..16
2.6. Oligonucleotides……….16
2.7. Plant growth media………16
2.8. Plant material………..17
2.9. Media for growth of bacteria……….17
2.10. Antibiotic stock solutions………...18
2.11. General buffers and solutions………..18
3. Methods………...19
I. Manipulation of Nucleic Acids………..19
3.1. Isolation of nucleic acids………..…..19
3.1.1. Small-scale plasmid isolation from E.coli (Miniprep)………...……….….……19
3.1.2. Isolation of genomic DNA……….………....…….19
3.1.3. Isolation of RNA……….….….19
3.1.4. Elution of nucleic acids from agarose gels……….….20
3.1.5. Determination of nucleic acid concentrations………..……….…..20
3.2. Enzymatic modifications of nucleic acids……….………...20
3.2.1. Restriction analysis of DNA……….………..20
3.2.2. Ligation of DNA fragments……….………20
3.2.4. RNAse A treatment of DNA preparations……….…..21
3.2.5. Synthesis of cDNA………...………...……21
3.2.6. Primer extension analysis………..……21
3.2.7. 5‘ and 3‘ RACE reactions…….………..……….………..22
3.2.8. Polymerase chain reaction (PCR)……….……...23
3.2.9. Sequencing of DNA……….………23
3.2.10. Gelelctrophoresis of nucleic acids……….……...23
3.2.11. Southern analysis of DNA……….…….23
3.2.12. Northern analysis of RNA……….…….23
3.2.13. RNA ligation……….……24
3.2.14. Preparation of radiolabeled probes……….……….25
3.2.14.1. Radioactive labeling of PCR products………...25
3.2.14.2. Radioactive labeling of oligodesoxynucleotides……….….25
3.2.14.3. Preparation of radiolabeled RNA probes………..25
3.3. Hybridisation procedure……….26
3.4. Dot-blot DNA/RNA hybridisation analysis………...26
II. Array Preparation………...27
3.5. Nylon filter array preparation………27
3.6. End-labeling of plastid transcripts………27
3.7. Plastid run-on transcription assays……….27
3.8. Array hybridisation……….27
3.9. Image analysis………28
III. Manipulation of proteins………28
3.10. Extraction of leaf proteins……….28
3.11. One-dimensional SDS-polyacrylamide gel electrophoresis………28
3.12. Silver staining of protein gels………..……….29
3.13. Coomasie Blue R-250 staining of protein gels………..29
3.14. Electrophoretic transfer of proteins onto nitrocellulose membranes (Western analysis)……….…….30
3.15. Immunological probing of proteins on nitrocellulose membranes………..….……30
3.16. Immunological detection using enhanced chemiluminiscence………....30
IV. Bacterial transformation……….31
3.17. Preparation of competent bacteria……….……….…….31
3.18. Transformation of bacteria cells………31
V. Manipulation of plant cells and organelles………..32
3.19. Seed sterilisation……….……32
3.20. Isolation of plastids……….32
3.21. Fractionation of chloroplasts into stroma and thylakoid membranes……….33
3.22. Isolation of the major thylakoid protein complexes………...34
3.25. Isolation of protoplasts and transformation for transient expression……….35
4. Results……….37
4.1. Identification of tobacco NEP genes……….……...37
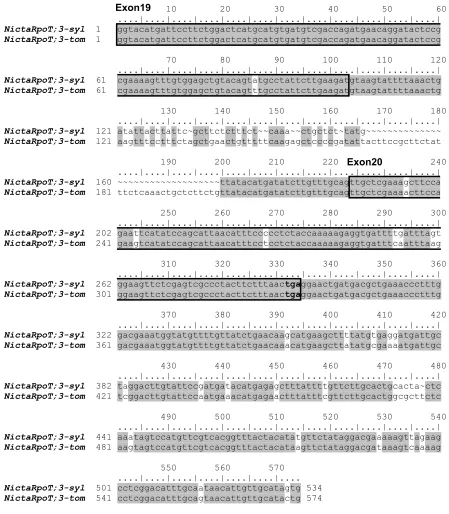
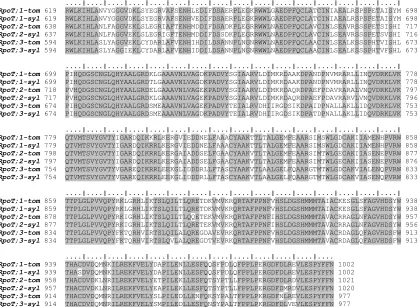
4.1.1. Characterisation and analysis of NicotianarpoT cDNAs……….……….38
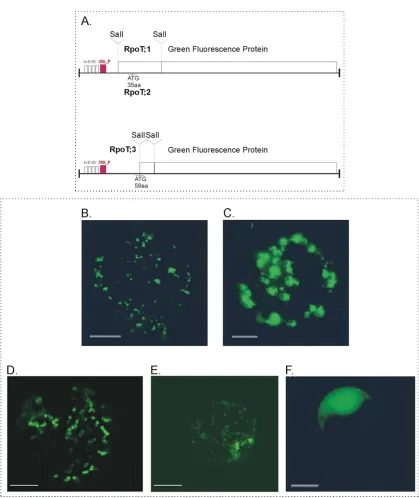
4.1.2. Subcellular localization of tobacco RpoT proteins……….41
4.2. Comparative analysis of plastid transcription profiles attributed to wild-type and PEP-deficient transcription machineries………..………45
4.2.1. Plastid macroarrays and their limitations………....48
4.2.2. Technical advances of array studies………...46
4.2.2.1. Specificity test………..46
4.2.2.2. Sensitivity test……….….47
4.2.2.3. Single-stranded vs. double-stranded probes………..47
4.2.2.4. Probe size, blot and hybridisation reproducibility………...49
4.2.2.5. What is the best probe for hybridising macroarrays?………....50
4.2.2.6. T4 Polynucleotide kinase specificity……….……51
4.3. Comparison of expression profiles of wild-type and PEP-deficient plastids……….….52
4.3.1. Genes encoding photosynthesis-related components……….….53
4.3.1.1. Transcriptional activity in wild-type and ∆rpoA mutant plastids………..….…53
4.3.1.2. Transcript levels in wild-type and ∆rpoA mutant plastids……….….…...58
4.3.1.3. Qualitative differences between wild-type and ∆rpoA plastid transcripts………….…..59
4.3.1.4. Protein accumulation in wild-type and ∆rpo mutant plastids………62
4.3.2. Genes encoding components of the genetic apparatus………...63
4.3.3. Heterogenic operons encoding components of both, the photosynthesis and genetic apparatus………....64
4.3.4. Genes specifying other functions……….….66
4.3.5. Open reading frames……….….67
4.3.6. Accumulation of aberrant transcripts of the rpoB-operon in ∆rpoA mutants…..……...72
4.4. PEP promoter studies………74
4.4.1. Cloning strategy and plastid transformation studies……….…75
4.4.2. Analysis of rpoB promoter transformants……….…..76
4.4.2.1. Homoplastomy check of transformed lines……….………...76
4.4.2.2. Phenotype characterisation of rpoB promoter mutants………78
4.4.2.3. Transcriptional characterisation of the rpoB promoter mutants……….……….79
4.5. Expression of genes for components of the translational machinery……….82
4.5.1. Expression of tRNAs in tobacco plastids………82
4.5.3. Expression of the rRNA operon………..……….….88
4.6. Analysis of the biogenesis of the cytochrome b6/f complex………..……90
4.6.1. Cloning strategy and homoplastomicity check of transformed pet-deficient lines………..……….91
4.6.2. Phenotype characterisation of transplastomic mutant lines……….…97
4.7. Protein analysis of transplastomic mutant lines………...………..99
4.7.1. Complex formation……….….99
4.7.2. Immunological characterisation of transplastomic lines……….………….…100
5. Discussion………....106
5.1. Conserved rpoT genes of both parental lines of tobacco……….…..106
5.1.1. Phylogenetic origin of the polymerases genes………..………..107
5.1.2. Targeting of RpoT;1 and RpoT;2 encoded RNA-polymerases into organelles……..108
5.1.3. Non-AUG initiation of translation of RpoT;3 mRNA………109
5.1.4. RpoT transcript accumulation ……….……….….110
5.2. Transcription studies of plastids based on array data………110
5.2.1. The choice of the probe type; technical aspects……….112
5.2.2. Transcription and transcript analysis……….114
5.3. A new NEP promoter upstream of the rpoB operon?……….………117
5.4. Assembly of the cytochrome b6/f complex………..……….120
6. Summary……….……….125
7. Abreviations………...127
8. Literature………..129
1. Introduction
Genetic information in plant cells is found in three different cellular compartments, nucleus, mitochondria and plastids. The latter two are acquisitions of formerly free-living organisms which have been integrated into a host cell by two independent successive endosymbiotic events. Whereas mitochondria trace back phylogenetically to the α -proteobacteria lineage, plastids are descendants of free-living cyanobakterial-like organisms. During evolution, the formerly autarkic gene expression apparatus of plastids - together with the corresponding machineries of mitochondria and the nucleus/cytosol - became the integrated, compartimentalised genetic system of the plant cell in which the ‘subgenomes’ are regulated syntonically (Herrmann, 1997; Herrmann and Westhoff, 2001).
Due to the eubacterial ancestry of plastids, their genetic machinery in many, but not all, respects resembles that of prokaryotes. During evolution from a free-living organism to the present-day organelle two major trends took place: (i) a massive reduction of the genome size, mainly due to gene loss and gene transfer to the nucleus and (ii) an pronounced increase in the complexity of gene expression.
1.1. Structure and organisation of plastid chromosomes
The genetic potential of plastids is encoded in a reiterated circular chromosome, generally in the range of 120 to 160 kbp, depending on the organism. Sequences of plastid chromosomes of a variety of vascular plants and algae have been completely determined (for a list of plastid chromosomes see http://www.ncbi. nlm.nih.gov/PMGifs/Genomes/plastids_tax.html). Some 80 copies of an identical chromosome are found in the single plastid of the unicellular alga Chlamydomonas and even 5000 – 10.000 copies in the 50-100 chloroplasts of a mesophyll cell of vascular plants. Thus, with respect to the plastid chromosome plant cells are highly polyploid. The organization of plastid chromosomes and their operons is well conserved in vascular plants. With the exception of some legumes, the circular DNA molecules contain a large inverted repeated segment (IRA and IRB) of species-specific sizes
Introduction
Figure 1. Gene map of the tobacco plastid chromosome (Shinozaki et al., 1986, redrawn by Schmitz-Linneweber, see also Table 1).
Typical plastid chromosomes of vascular plants encode some 120 genes which are usually organised in polycistronic transcription units that are located on both DNA strands (for a review see Sugita and Sugiura, 1996). This corresponds to approximately 5% or even less of the coding potential of the ancestral cyanobacterial genome that may have been in the order of approximately 3.000 genes. During evolution some of the genes got lost, e.g. because they where only useful for the autarcic life style, most genes of the endosymbiont, however, have been transferred to the nucleus and the respective gene products have now to be posttranslationally imported back into the plastids or are found elsewhere in the cell (see Bruce, 2001 and references therein). The genetic information of plastid chromosomes can be divided into three principal classes: (i) genes that contribute to the decoding of genetic information within the organelle, i.e., four genes for subunits of one of the organelle RNA polymerases (see below), genes for ribosomal RNAs and proteins, tRNAs, and factors involved in translational processes, altogether approximately 60 loci, (ii) genes for components of the photosynthetic apparatus, predominantly for constituent polypeptides of the thylakoid membrane complexes (approximately 40 loci ), and (iii) open reading frames of unknown function (hypothetical chloroplast reading frames, ycfs) (Table 1).
Table 1.
Classification of the genes encoded by the Nicotiana tabacum plastid chromosome Genes coding for RNAs
Genes coding for ribosomal RNAs rrn23#, rrn16#, rrn5#, rrn4.5#
Genes for transfer RNAs
trnA(UGC)$#, trnC(GCA), trnD(GUC), trnE(UUC), trnF(GAA), trnG(GCC), trnG(UCC)$, trnH(GUG), trnI(CAU)#, trnI(GAU)$#, trnK(UUU)$, trnL(CAA)#, trnL(UAA)$, trnL(UAG),
trnfM(CAU), trnM(CAU), trnN(GUU)#, trnP(UGG), trnQ(UUG), trnR(ACG)#, trnR(UCU),
trnS(GCU), trnS(GGA), trnS(UGA), trnT(GGU), trnT(UGU), trnV(GAC)#, trnV(UAC)$,
trnW(CCA), trnY(GUA)
Other RNA genes sprA
Polypeptide coding genes
Genes coding for ribosomal polypeptides
rps2, rps3, rps4, rps7#, rps8, rps11, rps12§†, rps14, rps15, rps16$, rps18, rps19 rpl2$#, rpl14, rpl16$, rpl20, rpl22, rpl23#,rpl32, rpl33, rpl36
Introduction
Genes coding for polypeptides of the photosynthesis apparatus rbcL
psaA, psaB, psaC, psaI, psaJ
psbA, psbB, psbC, psbD, psbE, psbF, psbH, psbI, psbJ, psbK, psbL, psbM, psbN, psbT, psbZ
(ycf9)
petA, petB$, petD$, petG, petL, petN (ycf6)
atpA, atpB, atpE, atpF$, atpH, atpI ycf3§, ycf4, cemA (ycf10)
Genes coding for subunits of the NADH dehydrogenase
ndhA$, ndhB$#, ndhC, ndhD, ndhE, ndhF, ndhG, ndhH, ndhI, ndhJ, ndhK
Other polypeptide coding genes accD, clpP§, ccsA (ycf5)
Conserved reading frames
ycf1, ycf2#, ycf14 (matK; partialy similar to intron maturase)
Pseudogenes infA,ycf15#
$ Gene with an intron; § Gene with two introns; † Gene coding trans-spliced exons; # Gene located in the inverted repeat (IR)
regions. For abreviations and nomenclature of genes, see in Stoebe et al. (1998).
Different from the general organisation, only rudimentary 35 - 75 kb chromosomes are found in plastids of organisms that have lost their photosynthetic capability (and genes), such as the apicomplexean parasite Plasmodium falciparum, the heterotrophic euglenoid alga Astasia longa, and the parasitic Orobanchaean species Epifagus virginiana (Siemeister and Hachtel, 1990; Wolfe et al., 1992; Wilson et al., 1996).
1.2. Expression of plastid chromosomes
Contrary to prokaryotes, transcripts of plastid encoded operons are extensively processed into complex sets of overlapping RNA species, finally often into monocistronic RNAs (Barkan, 1988; Westhoff and Herrmann, 1988). Several instances have been noted, where endonucleolytic cleavage of di- or polycistronic transcripts is a prerequisite for efficient translation of mRNAs (Barkanet al., 1994; Hirose and Sugiura, 1997). Essential in higher plant plastids as well are various other transcript maturation processes which are not (i.e. RNA editing) or less commonly (i.e. RNA splicing) associated with prokaryotic systems (Maier et al., 1996; Sugita and Sugiura, 1996). It appears that during organelle evolution distinct RNA processing steps evolved and spread out in the originally cyanobacterial-type genetic system of the ancestral plastid.
In additon to regulatory steps at the level of transcription and transcript processing, the accumulation and assembly of plastid-encoded gene products is controlled at the translational and posttranslational level as well (for a review see Choquet et al., 2000; Zerges, 2000).
1.2.1. Transcription
In analogy to the evolution of posttranscriptional processing, plastid transcription itself developed into a highly sophisticated process, again representing not merely typical prokaryotic features. In particular, transcription in higher plant plastids is performed by (at least) two different RNA polymerases of different phylogenetic origin. Besides the plastid-encoded RNA polymerase (PEP) which resembles eubacterial enzymes, a nuclear-encoded phage-type RNA polymerase (NEP) is involved in transcribing the plastid chromosome (summarised in Hess and Börner, 1999). The core subunit of the PEP enzyme is specified by the four plastid genes rpoA, rpoB, rpoC1 and rpoC2 which display significant similarity to the three genes encoding the core of the eubacterial RNA polymerase (summarised in Igloi and Kössel, 1992). Sigma-like factors, which are essential for transcription initiation by PEP, originate in nuclear genes and are posttranslationally imported into the organelle (Allison, 2000). Additional PEP-associated polypeptides of nuclear origin with developement-dependent compositions have been identified in mustard (Pfannschmidt et al., 2000). Whereas PEP traces back to the phylogenetic ancestor of plastids, the phylogenetic origin of NEP is still unclear.
Introduction
Complicating plastid transcription even more, very recently evidence for a further nuclear-encoded RNA polymerase-type in plastids, that is different from the phage-type NEP enzymes and probably involved in transcription of the rDNA operon has been obtained (Bligny et al., 2000).
The presence of diverse RNA polymerases operating in plastids of higher plants is complemented by the existence of different enzyme-specific promoters and possibly also termination signals preceeding and following plastid transcription units, respectively. The PEP enzyme is known to initiate transcription from -10/-35 eubacterial-type promoters (Igloi and Kössel, 1992). Analyses of transcription in mutants with disrupted PEP genes or in plastids of non-photosynthetic tissue culture cells led to the identification of NEP-specific promoters that are reminiscent of promoters recognised by mitochondrial and T3/T7 phage RNA polymerases (Hajdukiewicz et al., 1997; Kapoor et al., 1997). In vitro studies identified a small three nucleotide motif (“CRT”) at position –6 to –8 as the NEP promoter core (Liere and Maliga, 1999). Based on analyses of wild-type and PEP-deficient plastids, transcription units have been operationally grouped into three principal classes. Some genes or operons have been suggested to be transcribed by either PEP or NEP, whereas others appeared to be transcribed by both enzymes (Hajdukiewicz et al., 1997). It was proposed that NEP preferentially drives transcription of genes for components of the plastid genetic system, whereas PEP transcribes genes for constituents of the photosynthetic machinery (Hajdukiewicz et al., 1997; Maliga, 1998). Consistently, the accumulation of transcripts of a selected set of photosynthesis-related genes was shown to be reduced dramatically in plants lacking PEP (Allison et al., 1996; Hajdukiewicz et al., 1997). Analysis of run-on transcription activities in PEP-deficient plastids, however, revealed that most segments of the plastid chromosome, independent of the encoded gene class, are transcribed even in the absence of PEP (Krause et al., 2000). Thus, the functional and phylogenetic implications of multiple transcription machineries in the plastids of higher plants is obviously much more complex than initially supposed.
1.2.2. Posttranscriptional RNA processing
Plastid-encoded RNAs are generally subject to a cascade of posttranscriptional processing steps including endonucleolytic cleaveage of polycistronic RNA chains and
complex maturation of the transcript ends (for review see Sugita and Sugiura, 1996; Barkan and Goldschmidt-Clermont, 2000; Monde et al., 2000). In addition, from a number of transcripts introns have to be removed by RNA splicing. Introns are widespread in higher plant plastid chromosomes. Spinach for instance contains 19 intervening sequences spread over 16 plastid-encoded genes (Schmitz-Linneweber et al., 2000). With the exception of one (that in the tRNA-Leu gene represents a group I intron) all these introns belong to group II (Michel and Ferat, 1995). Group II intervening sequences, which have also been found to interrupt reading frames in fungal and plant mitochondria, rarely also in bacteria (Ferat and Michel, 1993), fold into a characteristic, evolutionary conserved secondary structure. Although some of these introns have been reported to exhibit self-splicing activity in vitro, splicing of plastid group II introns involves additional, in individual cases intron-specific splicing factors (Jenkins et al., 1997). With the exception of the plastid-encoded matK reading frame, which exhibits significant sequence similarity to fungal genes for intron maturases, all splicing factors must originate in nuclear genes (Vogel et al., 1999). Although both plastid-type group I and group II introns have been found in cyanobacteria (Thompson et al., 1995; Besendahl et al., 2000), the majority of them in plastids are thought to have been lost and gained at several branches during cell evolution. Whereas group II introns are not (any more?) present in plastids of most algae lineages, they appear to be widespread in those of euglenoids and vascular plants (Thompson et al., 1995).
Introduction
codons. The number of editing sites, however, is much lower in plastids. Circumstantial evidence suggests that the process in both plant organelles is evolutionary linked. In both organelles, editing has been found to be widespread within vascular plants occuring in all major groups, and also in Bryophyta (Malek et al., 1996; Freyer et al., 1997). An unusual degree of U-to-C conversions can be found in both, mitochondria and plastids, of the hornwort Anthoceros formosae (Yoshinaga et al., 1996), and editing appears to be absent in both organelles of the liverwort Marchantia polymorpha. Editing apparently also does not exist in plastids of algae nor in cyanobacteria, representing the phylogentic ancestor of plastids. Taken together, this has suggested that the probably common phylogenetic origin of RNA editing in both plant organelles resides in the early ancestors of land plants. The higher frequency of editing in plant mitochondria, in turn, indicates that editing has entered the genetic system of the organelles successively. If correct, this would be an interesting analogy to the nuclear-encoded RNA polymerase (NEP). However, so far no plant species has been found in which editing occurs in only mitochondria.
In addition to endonucleolytic cleavage of polycistronic transcripts, RNA splicing and editing, RNA stabilisation/destabilisation has been discovered as a further regulatory point in plastid gene expression (for review see Monde et al., 2000). It was found that RNA stability (defined as the time required for half the initial amount of the RNA measured to disappear) varies significantly between individual transcripts and that relative transcription rates and accumulation of a given transcript often do not correlate. In many cases fluctuation in transcription rates do not account for the observed changes in RNA amounts. Sequence elements located in the 5’ and 3’ UTR as well as in coding regions have been shown to play a critical role in the stability/instability of individual transcripts. Mechanistically, in the initial step RNA chains are endonucleolytically cleaved at specific sites. The cleavage products are then polyadenylated at the 3’ end followed by 3’–to–5’ degradation and/or exonucleolytical degradation from their 5’ termini (reviewed in Hayes et al., 1999; Schuster et al., 1999). The components involved are all nuclear-encoded (Monde et al. 2000 and references therein). It has been shown that the half-life of individual plastid RNAs is regulated differentially in a development-specific manner. For example, compared to spinach grown in dark a significantly increased stability of psbA mRNA is observed in light-grown plants (Deng and Gruissem, 1987).
1.2.3. Translational control of plastid gene expression
Translation in plastids exhibits many eubacterial-type characteristics, like 70S ribosomes and formylated initiator tRNAs (fMet-tRNA). However, only few plastid mRNAs contain Shine-Dalgarno (SD)-like sequences necessary for translation initiation in eubacteria, and if they do, it is often shifted to a more upstream position, untypical for eubacterial translation systems (Sugiura et al., 1998). In some instances, novel sequence elements not found in prokaryotes seem to replace or extend the function of SD sequences (e.g. Hirose and Sugiura, 1996). Plastid translation has been shown to be regulated in response to light and developmental programs (for review see Zerges, 2000). Trans-acting translational factors are encoded by the nucleus and interact with cis elements located in the 5’ and 3’ UTRs of plastid mRNAs. Only little is known of how translation of mRNAs is regulated mechanistically. As in the case of transcription rates and accumulating RNA amounts, frequently no direct correlation exists between mRNA amounts and corresponding polypeptides. It has been demonstrated that under certain developmental conditions substantial amounts of thylakoid proteins are translated, even from only minute mRNA amounts (Herrmann et al., 1992).
The plastid genome of tobacco encodes 30 tRNA species that can read all sense codons by expanded wobble codon-anticodon recognition. Therefore, there is principally no need for import of tRNAs from the cytoplasm, in contrast to plant mitochondria (Sugita and Sugiura, 1996). The finding that parasitic plants, like Epifagus virginiana, encode only 13 tRNAs in their reduced plastid genome, but nevertheless are able to translate mRNAs containing all codons (Morden et al., 1991; Taylor et al., 1991), however, suggests that at least in those plants nuclear-encoded tRNAs are involved in plastid translation as well.
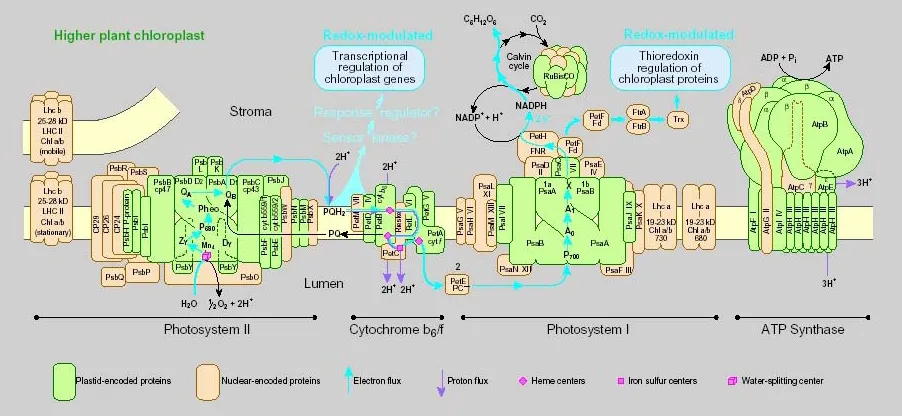
1.3. Thylakoid membrane-located multiprotein complexes
The thylakoid membrane of plastids contains four major multiprotein complexes, involved in photosynthetic electron transfer and ATP synthesis: photosystem I and II, the cytochrome b6f complex and the ATP synthase (Fig. 2). In addition, a fifth
Introduction
either encoded in the nucleus or in the plastid genome which have to be assembled into multiprotein complexes in defined stoichiometry. Assembly takes probably place at the site of function, in the thylakoid membrane, and demands highly coordinated mechanistic steps.
Figure 2. Scheme of the thylakoid membrane system (concept for scheme kindly provided by Prof. Herrmann). The thylakoid membrane system contains four major complexes stoichiometrically related to each other. A fifth minor abundant complex, the NADH-dehydrogenase complex is not shown. Each complex consists of nuclear (yellow) and plastid encoded (green) components.
1.3.1. Synthesis and assembly of the cytochrome b6/f complex
The cytochrome b6f complex is the simplest of the thylakoid membrane protein
complexes in terms of polypeptide composition. It consists of at least 8 polypeptide species (encoded by the genes petA, petB, petC, petD, petG, petL, petM and petN) of which in vascular plants six (genes: petA, petB, petD, petG, petL and petN) are encoded in the plastid genome. Nuclear-encoded genes petC (coding for the Rieske protein) and petM (coding for subunit VII) are transcribed and translated from individual mRNAs in the nucleo–cytoplasmatic compartment. The respective polypeptides are imported into plastids via N-terminal targeting signals. Plastid-encoded pet genes are scattered in four transcription units: petA (coding for cytochrome f) is transcribed as part of a tricistronic ycf4/cemA/petA message, whereas petB and petD (coding for cytochrome b6 and subunit IV, respectively) are
transcribed as part of the psbB operon (psbB/psbT/psbH/petB/petD). Both, petB and petD, contain group II introns which have to be removed by splicing as a prerequisite for expression of the encoded polypeptide. In addition, petB of tobacco and other vascular plants contains an editing site, at which a proline codon (CCA) has to be
posttranscriptionally changed to a leucine codon (CUA) by C-to-U editing to encode a functional cytochrome b6polypeptide (Freyer et al., 1993; Zito et al., 1997). petL and
petG (coding for subunit VII and V, respectively) are transcribed as a dicistronic message whereas petN (encoding subunit VI polypeptide) encodes a probably monocistronic mRNA (see Fig.1).
Various mutants impairing assembly of the cytochrome b6f complex of the green alga
Chlamydomonas reinhardtii and higher plants have been investigated (Lemaire et al., 1986; Bruce and Malkin, 1991; Voelker et al., 1995; Monde et al., 2000a,b). It has been shown that deletions of individual plastid-encoded pet genes result in a dramatic, by a factor ten or more, decrease of the accumulation of the remaining subunits (Choquet and Vallon, 2000). Two types of mechanism have been suggested to be responsible for the concerted accumulation of cytochrome b6f subunits: (i)
degradation of unassembled polypeptides, and (ii) regulation of translation by assembly (Choquet and Vallon, 2000). In Chlamydomonas, for instance, the half-life of subunit IV and cytochrome b6 is dramatically decreased upon deletion of another
subunit, whereas the synthesis rates remained unchanged. This suggests that unassembled polypeptides are rapidly degraded. Different from that, in the absence of its assembly partners, the synthesis rate of cytochrome f is decreased to approximately 10% of wild-type levels. The low amount of cytochrome f synthesised, however, is inserted into the thylakoid membrane and is as stable as in wild-type. This indicates a hierarchical organisation of the expression of cytochrome b6f
Introduction
1.4. Goals of this study
Plastid gene organisation maintains characteristics typical of its prokaryotic ancestry. The regulation of plastid gene expression however strongly deviates from that one its free-living cyanobacteria relatives. This intriguing complication of plastid gene expression characteristics is the result of an integration process of the cellular subgenomes that introduced eukaryotic traits into the formerly prokaryotic compartment (Herrmann et al. 1997). An interesting example for this process is the transcription system, which consists of both prokaryotic (PEP) and eukaryotic (NEP) RNA polymerases. In order to understand, how far the transcriptional apparatus within plastids was adapted to nuclear needs, three approaches have been undertaken.
Firstly, the tobacco homologues of the NEP-enzymes known from Arabidopsis were determined and characterised.
Secondly, an extensive transcript analysis for all plastid operons was carried out with wild-type and PEP-lacking material in order to assess the contribution of the two systems to transcription. In order to rapidly screen this plant material, an array-based technique was established. As no arrays for the plastid chromosome had been described, the preparation of the filters, optimisation of hybridisation conditions and probe preparation together with the use of the proper controls was one of the main challenges of this work, in particular as macroarrays are interesting for various other applications.
Thirdly, to assess the regulation of PEP expression, an in vivo analysis of the promoter for the rpoB operon was performed. According to data from other groups, this operon is controlled by NEP, which – in addition to other data – led to the suggestion that PEP is switched on by NEP (Hajduckiewicz et al., 1997). To test this, point mutations of the described NEP rpoB promoter (Liere and Maliga; 1999) should be prepared and introduced into the plastid compartment by particle transformation. Insight into the regulation of PEP is crucial in order to understand the interplay of the two RNA polymerase systems.
Finally, in addition to studies on plastid transcription, later steps in plastid gene expression were examined in the course of this work as well. As a model to study assembly of a multisubunit complex, the cytochrome b6/f complex was analysed by a
Materials
2. Materials
2.1. Chemicals and enzymes
Chemicals used in this study that are not listed in the table below were purchased from: Amersham-Pharmacia (Freiburg, Germany), Roche GmbH (Basel, Switzerland), Invitrogene (Karlsruhe, Germany), Biomol (Hamburg, Germany), New England Biolabs (Bad Schwalbach, Germany) or MBI Fermentas (Vilnius, Lithuania).
acrylamid powder 2x Serva; Heidelberg, Germany
agar, purified Sigma, Heidelberg; Germany
agarose BioWhittaker Molecular apl.; Rockland,USA
ammoniumpersulfate Sigma; Heidelberg; Germany
amoniumsulfate Roth, Karlsruhe; Germany
6-aminocapronic acid Sigma; Heidelberg; Germany
ampicillin Serva, Heidelberg; Germany
Bacto Agar ICN, Biomedicals Inc.; Ohio, USA
Bacto Tryptone USB, Cleveland; USA
BAP Sigma-Aldrich; St. Luis; USA
bis-Tris Roth, Karlsruhe; Germany
bromphenolblue Merck, Darmstadt; Germany
beef extract powder Sigma, Heidelberg; Germany
BSA, fraction V Roth, Karlsruhe; Germany
casein hydrolysate Merck; Darmstadt; Germany
tri-chloracidic acid Roth, Karlsruhe; Germany
coomassie brilliant blue, R250 Merck; Darmstadt; Germany
DEAE-cellulose membrane Schleicher and Schuell; Dassel, Germany
1,4-dithiothreitol Roth, Karlsruhe; Germany
ethidiumbromide Roth, Karlsruhe; Germany
formaldehyd Roth, Karlsruhe; Germany
formamide Sigma, Steinheim; Germany
glycerol Roth, Karlsruhe; Germany
hexadecyltrimethyl-amonium bromide Sigma; Heidelberg; Germany
HEPES Roth, Karlsruhe; Germany
Hybond-N-membrane Amersham-Buchler; Braunschweig; Germany
IPTG Sigma-Aldrich; St. Luis; USA
MES Serva; Heidelberg; Germany
β-mercaptoethanol Sigma, Heidelberg; Germany
mannitol Roth, Karlsruhe; Germany
Miracloth-filter Calbiochem; Merck, Darmstadt; Gremany
MOPS Roth, Karlsruhe; Germany
NAA Sigma-Aldrich; St. Luis; USA
di-sodium hydrogenphosphate Merck, Darmstadt; Germany
sodium dodecylsulfate Serva, Heidelberg; Germany
sodium chlorid Roth, Karlsruhe; Germany
sorbitol Roth, Karlsruhe; Germany
spectinomycin Sigma-Aldrich, St. Luis; USA
percoll Pharmacia; Uppsala; Sweden
phenol/chloroform Roth, Karlsruhe; Germany
Polyethyleneglycol 6000 Serva; Heidelberg; Germany
Ponceau S Serva; St. Luis; USA
rifampicin Fluka; Steinhein; Germany
Qiagen colums Qiagen; Hilden; Germany
TEMED Serva; Heidelberg; Germany
Tris Roth, Karlsruhe; Germany
Tris-sodium citrate 2-hydrate Roth, Karlsruhe; Germany
Triton X-100 Roth; Karlsruhe; Germany
Tween 20 Applichem, Darmstadt; Germany
X-gal Sigma-Aldrich, St. Luis; USA
xylenecyanol Serva; Heidelberg; Germany
yeast extract Merck, Darmstadt, Germany
2.2 Length and weight standards
A 1 kb DNA length standard 54 to 8000 bp was purchased from Invitrogene, Karlsruhe. In addition, λ DNA restricted with EcoRI and HindIII yielding fragments between 564 to 21226 bp was used. An RNA molecular weight standard (0.24-9.5 kb) was purchased from Invitrogene, Karlsruhe. As a standard for the determination of the molecular weight of proteins, the marker SDS-7 (Pharmacia) was used.
2.3. Antibodies
Materials
2.4. Bacterial strains
E. coli DH5α Hanahan (1983)
E. coli Y1090 Young and Davis (1983)
E. coli CJ236 Invitrogen (Karlsruhe, Germany)
2.5. Plasmids
pBlueScript (SK- and SK+) Stratagene (La Jolla, USA)
pPCR-TA Invitrogen (Karlsruhe, Germany)
2.6. Oligonucleotides
All oligonucleotides used for macroarray preparations, cloning, or sequence analyses have been obtained from MWG-Biotech (Ebersberg, Germany). The list of primers is given in an additional table at the end of this thesis.
2.7. Plant growth media
B5 medium was prepared according to Gamborg et al. (1968), protoplast culture media (PCN and PIN) according to Koop and Kofer (1995). RMOP medium for shoot regeneration was prepared according to Svab and Maliga (1993).
Table 2. Composition of plant growth media (adapted from Brunner, 1997).
mg/l B5 F-PCN F-PIN RMOP
NH4NO3 1650
KNO3 2500 1012 1012 1900
CaCl2 2H2O 150 440 440 440
MgSO4 7H2O 250 370 370 370
KH2PO4 170 170 170
NaH2PO4 H2O 150
(NH4)2SO4 134
macro salts
NH4-Succinat 0.2 mM 0.2 mM
EDTA-Fe(III)Na 40 40 40 40
KJ 0,75 0,75 0,75 0,83
micro
H3BO3 3 3 3 6,2
MnSO4 H2O 10 10 10 22,3
ZnSO4 7H2O 2 2 2 8,6
Na2MoO 2H2O 0,25 0,25 0,25 0,25
CuSO4 5H20 0,025 0,025 0,025 0,025
CoCl2 6H2O 0,025 0,025 0,025 0,025
Inositol 100 200 200 100
Pyridoxin-HCl 1 2 2
Thiamin-HCl 10 1 1 1
Biotine 0,02 0,02
vitamines
Nicotinic acid 1 2 2
BAP 1 1 1
NAA 0.1 0.1 0.1
Polybuffer 74 10 ml 10 ml
Sucrose 20 000 130 000 30 000
Glucose 85 000
pH (KOH) 5,7 5,8 5,8 5,8
Osmolarity 550 (mosm/l) 550 (mosm/l)
other
Agar 7000 8000
2.8. Plant material
For plant transformation experiments as well as for biochemical and biophysical analyses
tobacco plants (Nicotiana tabacum L. cv. Petit Havana) were grown axenically under
standard light conditions (100 µE m-2 s-1) or under lower (ca. 4 - 10 µE m-2 s-1 ) light regimes generally at 20°C - 25°C, and 16/8 h light/dark cycles (Osram L85W/25 Universal White fluorescent lamps). For phenotypic comparison, plants were grown in soil under greenhouse conditions.
2.9. Media for growth of bacteria
All values refer to 1 liter of medium:
LB medium 10 g Bactotryptone
5 g yeast extract
5 g NaCl
Materials
2.10. Antibiotic stock solutions
ampicilline 40 mg/ml dissolved in water
chloramphenicol 40 mg/ml dissolved in 70% ethanol
2.11. General buffers and solutions
TE Buffer 10 mM Tris/HCl
pH 8.0 1.0 mM EDTA
10xTBE Buffer 1.0 M Tris
0.5 M boric acid
20 mM EDTA
50xTAE Buffer 2.0 M Tris/HCl
pH = 7.4-7.6 1.0 M sodium acetate
20 mM EDTA
10xMOPS Buffer 200 mM MOPS
pH 7.0 50 mM NaOAc
1 mM Na2EDTA
10xSDS-PAGE Buffer 250 mM Tris/HCl
pH 8.3 14.4% (w/v) Glycin
1% (w/v) SDS
20xSSC 3 M NaCl
pH 7.2 0.3 M tri-sodium citrate
10xPBS Buffer 750 mM NaCl
pH 7.5 30 mM KCl
45 mM Na2HPO4
15 mM KH2PO4
Denaturation Solution 1.5 M NaCl
0.5 M NaOH
Neutralisation Solution 1.5 M NaCl
pH 7.0 0.5 M Tris/HCl
3. Methods
I. Manipulation of Nucleic Acids 3.1. Isolation of nucleic acids
3.1.1. Small-scale plasmid isolation from E. coli (Miniprep)
3 ml LB/Amp-Medium (100 µg/ml ampicillin) was inoculated with a single colony and incubated overnight at 37°C with constant agitation. Cultures were transferred into 2 ml Eppendorf tubes and cells were pelleted by centrifugation (14.000 g, 1 min, RT). Plasmids were isolated from bacterial cells using anion exchange columns (Qiagen) according to the manufacturer’s protocol. DNA was eluted from the columns by addition of 50 µl 10 mM Tris/HCl, pH 8.0, with subsequent centrifugation (14.000 g, 2 min, RT).
3.1.2. Isolation of genomic DNA
Isolation of DNA from plants was performed according to Doyle and Doyle (1990) using CTAB as detergent. The leaf material (approx. 500 mg) was ground in liquid nitrogen. DNA extraction was performed using 400 µl of the CTAB-buffer and continued grinding. Afterwards, the slurry was incubated at 65oC for 30 - 60 min. The reaction was centrifuged to remove cellular debris (12.000 g; 10 min) and DNA precipitated from the supernatant with isopropanol (4oC; 30 min;18.000 g).
CTAB-buffer
2% CTAB
1.4 M NaCl
20 mM EDTA, pH 8.0
100 mM Tris/HCl, pH 8.0
100 mM β-mercaptoethanol (added before use)
3.1.3. Isolation of RNA
3.1.4. Elution of nucleic acids from agarose gels
DNA-fragments were recovered from agarose gels by electro-elution onto DEAE membranes using NET Buffer (Sambrook et al., 1989).
NET Buffer
1.0 M NaCl
0.1 M Na2EDTA
20 mM Tris/HCl, pH 8.0
3.1.5. Determination of nucleic acid concentrations
DNA and RNA concentrations were determined spectroscopically using an Amersham-Pharmacia (Ultraspec 3000) spectrometer. The absolute volume necessary for measurement was 100 µl. Concentrations were determined by measuring the absorbances at 260, 280 and 320 nm. A ratio of A260/A280 between 1.8 and 2 indicated a sufficient purity of the nucleic acid preparation.
3.2. Enzymatic modifications of nucleic acids 3.2.1. Restriction analysis of DNA
For restriction, the DNA was incubated with twice the recommended amount of appropriate enzymes in the recommended buffer for 2 h. Restriction was terminated by addition of sample buffer and the sample was applied onto an agarose gel. If the conditions for two enzymes were incompatible with each other, the DNA was digested successively with the respective enzymes. The DNA was purified between the two digestion assays using the rapid purification kit (Life Technologies).
3.2.2. Ligation of DNA fragments
Ligation of DNA fragments was performed by mixing 50 ng vector DNA with a fivefold molar excess of insert DNA. 1 µl of T4 DNA ligase and 2 µl of 10x ligation buffer were added and the reaction mix was brought to a final volume of 20 µl. The reaction was incubated either for 2 h at RT or overnight at 16°C. The assay was used directly for transformation of E. coli cells without any further purification.
3.2.3. Dephosphorylation of plasmid DNA
After restriction, plasmid DNA was purified by the gel purification method (described in Section 3.1.4.). Then SAP buffer (Boehringer Ingelheim) and 1 U SAP (shrimps alkaline phosphatase) per 100 ng plasmid DNA were added and the reaction was incubated at 37°C for 2 h and terminated by incubation at 70°C for 10 min. The plasmid DNA was used for ligation without further purification.
3.2.4. RNAse A treatment of DNA preparations
RNAse A treatment of DNA preparations to eliminate RNA contamination was performed by adding 1 µg/ml of RNAse A. The reaction was incubated for 30 min at 37oC with a subsequent phenol/chlorophorm purification step in order to remove the enzyme.
3.2.5. Synthesis of cDNA
RNA preparations were treated with RNase-free DNase I, extracted with phenol-chloroform and precipitated with 2 volumes of ethanol in the presence of 0.3 M sodium acetate, pH 4.8. Aliquots of 3 µg plastid RNA were reverse transcribed with Moloney murine leukemia virus RNase H-free reverse transcriptase (SuperscriptTM,
GIBCO/BRL, USA). The reactions were either primed with random hexanucleotides or sequence-specific oligonucleotides. The reaction was terminated by addition of 0.2 volumes of 0.5 M EDTA, pH 8.0. To remove RNA, the product mixture was ethanol precipitated, and the pellet was incubated in 0.3 M NaOH, 5 mM EDTA, pH 8.0, for 30 min at 65°C. The sample was then neutralized by addition of 1.2 volumes of 1 M Tris/HCl, pH 7.5.
For preparation of labelled cDNA probes for macroarray hybridisation, reverse transcription was carried out in the presence of α-32P-dCTP. As primers, either
3.2.6. Primer extension analysis
Primer extension reactions were carried out with 50 µg of total leaf RNA with SuperscriptTM reverse transcriptase (GIBCO/BRL, USA) and a fluorochrome-labeled primer (5’-IRD700-TGTATCTGATTAAATCCAGGTATTG-3’; MWG Biotech, Ebersberg, Germany) annealing to the region between +55 and +31 relative to the first nucleotide of the rpoB coding sequence. DNA sequences were generated by using the same primer and the Thermosequenase kit (Amersham Pharmacia Biotech, Freiburg, Germany). Products were analysed with the LI-COR 4200IR2 two-laser system (MWG Biotech, Ebersberg, Germany).
3.2.7. 5’ and 3’ RACE reactions
RACE PCRs were carried out using SMART RACE (Clontech, Heidelberg, Germany) as well as GeneRacer (Invitrogen, San Diego, CA, USA) protocols, following the manufacturers instructions.
3.2.8. Polymerase chain reaction (PCR)
Amplification of DNA fragments was performed in a 50 µl reaction mixture with thin-walled PCR tubes in a Hybaid PCR cycler. The following reaction mixture was used:
template: 2 - 10 ng primer 1 (10 pM): 1 µl primer 2 (10 pM): 1 µl
nucleotides (dNTPs; 20 mM): 1 µl PCR buffer (10 x): 5 µl
Taq polymerase: 2.5 U H2O ad 50 µl
The PCR was performed with the following steps, if not otherwise stated: 1) Initial denaturing at 94°C for 2 min,
2) denaturing at 94°C for 0.5 min, 3) annealing at Tm-4°C for 0.5 min,
4) synthesis at 72°C for approx. 1 min/1kb DNA, 5) termination at 72°C for 5 min,
6) cooling to 4°C.
The amplification procedure (steps 2 - 4) was repeated 30 times.
The melting temperature of the primers depends on their GC content and was calculated by the following formula:
Tm = n (G+C) x 4 oC + (A+T) x 2 oC
If the two primers chosen had different melting temperatures, the lower one was used. The quality of PCR products was monitored by gel electrophoresis.
3.2.9. Sequencing of DNA
Nucleotide sequences were determined by the dideoxy chain termination method (Sanger et al., 1997)using gene-specific primers with an ABI 377 sequencer (Applied Biosystems, USA). Sequences were evaluated and assembled using Sequencher 3.0 (Gene Codes Corporation, USA). Sequences were aligned using the BioEdit sequence alignment editor (North Carolina State University).
3.2.10. Gelelectrophoresis of nucleic acids
For electrophoresis of DNA fragments agarose gels from 0.5% to 2% in 1x TBE were used. For electrophoresis of in vitro transcripts used in macroarray studies 4.5% polyacrylamide/urea gels were chosen. For electrophoresis of RNA 1 - 1.2% denaturing formaldehyde agarose gels were employed (Sambrook et al., 1989).
3.2.11. Southern analysis of DNA
For Southern analysis 5 µg of total DNA was restricted with the desired enzyme and electrophoretically separated in an agarose gel. DNA transfer from the gel onto nitrocellulose membranes was performed by capillary blotting as described in Sambrock et al. (1989). As a quality and loading control, the membrane was stained with methylene blue solution for 30 sec and destained with deionized water for 10 min.
3.2.12. Northern analysis of RNA
formaldehyde, and transferred onto nylon membranes by capillary blotting. The blot is blotted as described in Sambrook et al., 1989.
Denaturing formaldehyde-containing RNA gel (for 120 ml)
1% (w/v) agarose
90 ml water
12 ml 10x MOPS, pH 7.0
20 ml formaldehyde (>37%) (Roth, Karsruhe, Germany)
Running buffer (for 500 ml)
50 ml 10x MOPS, pH=7.0
50 ml formaldehyde (>37%) (Roth, Karsruhe, Germany)
400 ml water
Sample buffer
1.2 ml formamide (deion., Sigma-Aldrich, St. Louis, USA)
0.4 ml formaldehyde (>37%) (Roth, Karsruhe, Germany)
0.24 ml 10x MOPS, pH 7.0
with addition of 1 µl of 100x Bromphenol-Blue solution (0.1 mg of Bromphenol-Blue solubilized in 1 ml water).
Methylene-blue staining solution (for 100 ml)
0.03% (w/v) methylene blue
0.3 M sodium acetate, pH 5.2
3.2.13. RNA ligation
Ligation of oligonucleotides to transcripts was used to detect 5’ or 3’ ends of distinct mRNA species. The principle of the method is based on the catalytic reaction of T4 RNA ligase that forms intramolecular phosphodiester bonds between 5’ phosphate and 3’ hydroxyl termini of single-stranded RNA. Its minimal substrate is a 3’ ribonucleoside and 5’ phosphate group. For RNA ligation DNAse I-digested mRNA was used, to keep the reaction specific. For low expressed genes, 50 µg of total plastid RNA was used in a reaction of 50 µl volume. The ligation reaction was perfomed over night at 4 - 10 oC, according to the supplier.
3.2.14. Preparation of radiolabeled probes 3.2.14.1. Radioactive labeling of PCR products
PCR products (100 ng DNA) were radiolabeled by random priming with Klenow enzyme and ³²P-dATP or ³²P-dCTP according to Sambrook et al. (1989). For this assay, the Random Primed DNA Labeling Kit from Roche (Basel) was used following the manufacturer’s protocol.
3.2.14.2. Radioactive labeling of oligodesoxynucleotides
The 5’ hydroxy group of synthetic oligonucleotides (primers) was radioactively labeled by 30 min incubation at 37°C with T4 polynucleotide kinase (New England Biolabs, Bad Schwalbach). Residual radioactive mononucleotides were removed by ethanol precipitation.
Assay mixture (25 µl)
0.5 µg oligodesoxynucleotides 2.5 µl 10x PNK buffer
7 µl [γ-32P]ATP
1 µl T4 polynucleotide kinase
3.2.14.3. Preparation of radiolabeled RNA probes
To obtain a probe for strand-specific hybridisation, PCR with a single primer containing 5’ the T7 promoter sequence was performed. Approximately 100 ng of the PCR product was used for in vitro transcription in the presence of [γ-32P]ATP. This
resulted in a radiolabeled antisense transcript for the desired RNA.
Radioactive in vitro transcription mixture (20 µl) 2 µl 10x transcription buffer (NEB)
2 µl 100 mM DTT
0.5 µl RNasin (RNase inhibitor, Promega) 4 µl rNTP mix-UTP (2.5 mM per base)
2.4 µl 100 µM UTP
x µl PCR product (100 ng)
5 µl [α-³²P]-UTP
The transcription reaction was carried at 37°C for 2 h. Subsequently, 1 µl of DNase I was added to the mix and the sample was incubated for 15 min at 37°C. After incubation, 80 µl of sterile water was added and two cycles of chloroform extraction were performed. RNA was precipitated from the aqueous phase by adding 2.5 volumes of 100% ethanol and 0.1 volume of Na acetate, incubated for at least 30 min at –20°C. The RNA pellet was washed once with 70% ethanol, dried and dissolved in RNAse-free water. Before hybridization the radioactive RNA sample was denatured for 5 min at 65°C.
3.3. Hybridization procedure
Both, nucleic acids on Northern and Southern membranes were fixed by UV crosslinking (2 x Autocrosslink on “UV-StratalinkerTM 2400”, Stratagene) and prehybridized at 65°C for at least 2 h in Church buffer. Hybridization was performed by incubation of the membrane with the denatured radiolabeled probe in 10 ml of Church buffer overnight at 65°C.
Afterwards, the filter was washed with a series of solutions containing decreasing amounts of salts (1x to 0.05x SSC, 0.1 SDS) in order to increase hybridization stringency and thereby eliminating non-specific probe binding. Finally, the filters were sealed in a plastic foil and exposed to X-ray film (Biomax film, Fujifilm, Belgium). Alternatively, autoradiographs for both RNA and DNA analyses were evaluated using Fuji Bio Imaging plates type BASIII, a Fuji Bio Imaging analyzer, the BAS200025 software package (Fuji) and the TINA20 software package v2.08 beta (Raytest, Spröckhovel/Germany).
3.4. Dot-blot DNA/RNA hybridisation analysis
In oder to detect differences between single-stranded and double-stranded probes and to test the sensitivity of macro arrays, dot-blot analysis was performed. 1 - 5 µg of total RNA or 7 µg of in vitro transcripts were mixed with RNA sample buffer and denatured at 65oC for 5 - 8 min. The samples are dotted onto pre-wet (in 5x SSC) positively charged nylon membranes (Hybond N+, Amersham, Freiburg, Germany). The soaking effect is supported by using Whatman paper below the membrane. The samples were fixed by UV crosslinking and hybridised.
II. Array Preparation
3.5. Nylon filter array preparation
Amplicons were arrayed on 7.8 x 11.9 cm positively charged nylon filters (Hybond-N+, Amersham Pharmacia Biotech, Freiburg) using a 96-pin tool (0.4 mm pins) with a BioGrid spotting device (BioRobotics, UK). Assuming that a pin of 0.4 mm diameter transfers 20 nl of liquid per spotting event three different dilutions of each amplicon (6.25, 25 and 100 ng/µl, respectively) were prepared. Each sample was spotted tenfold to the same position in order to obtain final DNA quantities of 1.25, 5 or 20 ng per sample on different spots. Each sample was arrayed in duplicate using a spotting density of 3 x 3. As a negative control pBluescript vector DNA was spotted onto the 8x12 cm filters. Prior to hybridisation the arrayed DNA was UV crosslinked to the filter.
3.6. End-labeling of plastid transcripts
5´ ends of DNase I-treated RNA (6 µg) were labeled using 5 units T4 polynucleotide kinase in the presence of 30 µCi of [γ-32P]ATP in a final volume of 20 µl according to
the supplier’s protocol (New England Biolabs, USA). The reaction was stopped by heat inactivation at 65°C for 20 min and remaining nucleotides were removed by the use of columns as described for run-on transcription assays (see above).
3.7. Run-on transcription assays
Run-on transcription assays with 2 x 10⁷ lysed plastids were carried out in a 100 µl volume in the presence of heparin as described in Klein and Mullet (1990). Unincorporated nucleotides were removed from the reaction assay by MicroSpin S-200 HR Columns (Amersham Pharmacia Biotech, Freiburg, Germany) following the manufacturer’s instructions. Incorporation of α-32P-UTP into elongating transcripts
was determined as described by Hallick et al. (1976) with aliquots spotted onto DE81 filters (Whatman, Maidstone, UK). The reaction was applied directly as a probe to hybridise macroarrays.
3.8. Array hybridisation
Arrays were prehybridised for 2 h at 65°C in ‚Church buffer‘ (0.25 M Na2HPO4, 7%
Arrays were successively washed at 65°C for 10 min in 2 x SSC, 0.1% SDS, 10 min at 65°C in 1 x SSC, 0.1% SDS, 10 min at 65°C in 0.5 x SSC, 0.1% SDS followed by a final wash at 65°C in 0.2 x SSC, 0.1% SDS for 10 min.
3.9. Image analysis
Radioactive signals were detected using a Fujifilm BAS 1500 Phosphorimager (Fuji, Japan). Images were directly imported into the TINA (raytest, Germany) or ArrayVision software (Imaging Research Inc., Canada) and analysed. In the case of arrays intensities of duplicate spots representing the same gene were averaged. Background correction was done against the negative control (pBluescript).
III. Manipulation of proteins 3.10. Extraction of leaf proteins
Plant tissue was ground in liquid nitrogen. Before thawing, 0.5 ml of the homogenisation solution was added under continuous grinding. The resulting slurry was frozen and stored at –70°C.
Homogenisation buffer
40 mM β-mercaptoethanol
10% sucrose
100 mM Tris/HCl, pH 7.2
5 mM EDTA
5 mM EGTA
2 mM PMSF
3.11. One-dimensional SDS-polyacrylamide gel electrophoresis
Separation of proteins was performed by means of the discontinuous SDS-polyacrylamide gel electrophoresis (SDS-PAGE).
Running gel: height 4.5 cm, thickness 1 mm 10% - 12% acrylamide solution
Stacking gel: height 0.8 cm, thickness 1 mm 4% - 5% (v/v) acrylamide solution
15-well combs
After complete polymerization of the gel, the electrophoresis chamber was assembled. Up to 35 µl sample was loaded per lane and the gel was run at a constant voltage of 80 V for 10 min and then at 140 V until the Bromphenol Blue had reached the end of the gel. Gels were then either stained or subjected to Western analyses.
3.12. Silver staining of protein gels [Heukeshoven and Dernick (1988)]
After SDS-PAGE, gels were fixed and incubated with freshly prepared thiosulphite in acetate/ethanol solution for 30 min at RT with constant agitation. Gels were washed intensively for at least three times for 5 min and subsequently stained for 20 min. Afterwards, gels were developed with sodium carbonate and the reaction was stopped with glycine buffer.
Fixation solution Thiosulfite solution
40% ethanol 0.3% Na2SO3 x 5x H2O
10% acetic acid 30% ethanol
0.83 M sodium acetate
Silvernitrate solution Developing Solution
0.1% AgNO3 3% Na2CO3
0.05% formaldehyde 0.025% formaldehyde
Stop solution
1% Glycine
3.13. Coomassie Blue R-250 staining of protein gels
After SDS-PAGE, the gels were stained in Coomassie staining solution (at room temperature for 1h) with constant agitation. The gels were then incubated in destaining solution until the background of the gel appeared nearly transparent.
Coomassie Blue R-250 staining solution
45% (v/v) methanol
9% (v/v) acetic acid
Destaining solution
20% (v/v) methanol
7% (v/v) acetic acid
3.14. Electrophoretic transfer of proteins onto nitrocellulose membranes (Western analysis)
Proteins were transferred from SDS-gels onto nitrocellulose membranes (Protran Nitrocellulose, Schleicher & Schüll) using a Semi-dry blotting apparatus (Owl, USA). After equilibration of SDS gels in blot buffer for 5 min, the blotting sandwich was assembled as described in the manufacturer’s protocol. Proteins were transferred electrophoretically in blot buffer at a constant voltage (85 V for 120 min or 35 V overnight at 4°C).
3.15. Immunological probing of proteins on nitrocellulose membranes
After electrophoretic transfer, the membranes were removed from the sandwiches and placed, protein-binding site up, in glass vessels. Membranes were washed once in TBS (Tris blocking solution without Tween 20) and incubated in blocking buffer for 1 h at room temperature. Afterwards, the primary antibody was added in an appropriate dilution either for 2 h at room temperature or overnight at 4°C. The primary antibody was removed and membranes were washed five times for 5 min with TBST (Tris blocking solution with Tween 20 in concentrations of 0.1% – 0.5%). The secondary antibody/peroxidase conjugate was applied for 2 h at RT. Membranes were washed again five times for 5 min with TBST and immunoreactive bands were visualized using the enhanced chemiluminescence detection system (ECL, Amersham, Braunschweig).
3.16. Immunological detection using enhanced chemiluminescence (ECL)
The immunocomplex composed of nitrocellulose membrane-bound protein, primary antibody and secondary antibody coupled with horse-raddish peroxidase (HRP) was detected using the enhanced chemiluminescence detection system (Orosz et al., 1996). The membrane was soaked for 1 min in detection solution (1:1 mixture of solutions I and II). The solution was removed and the blot was placed between two Saran wrap foils. The membrane was exposed to X-ray film (Biomax-MR, Kodak) for varying periods.
Solution I Solution II
2.5 mM Luminol 5.4 mM hydrogen-peroxyde
0.4 mM coomaric acid 0.1 M Tris/HCl, pH 8.5
0.1 M Tris/HCl, pH 8.5
IV. Bacterial transformation
3.17. Preparation of competent bacterial cells
E. coli DH5α cells were streaked on LB-plates containing the appropriate antibiotics and incubated overnight at 37°C. Single colonies were picked and used for inoculation of 10 ml of an overnight culture. 1 ml of the overnight culture was added to 100 ml of pre-warmed LB broth containing antibiotics and shaken until an absorbance of 0.5 at 600 nm was reached (approximately 90 – 120 min). The culture was chilled on ice, transferred to sterile round-bottom tubes and centrifuged at low speed (4000 x g, 5 min, 4°C). The supernatants were discarded and the cells resuspended in ice-cold KP1 buffer (30 ml for a 100 ml culture). The suspension was kept on ice for an additional 90 min. Then, the cells were collected by centrifugation (4000 x g, 5 min, 4°C), the supernatant was discarded again and the cells resuspended in 4 ml ice-cold KP2 buffer. Aliquots of 100 µl were prepared, frozen in dry ice-ethanol mix, and stored at –80°C.
KP1 BUFFER KP2 BUFFER
potassium acetate 30 mM
MnCl2 50 mM
KCl 100 mM 10 mM
CaCl2 10 mM 75 mM
MOPS, pH=7.0 10 mM
glycerol 15% 15%
3.18. Transformation of bacteria
and the bacteria incubated at 37°C for 30 min. The cells were then centrifuged (10000 x g, 1 min, RT) and the supernatant removed. Cells were resuspended in 100 µl of LB medium and plated onto LB plates containing the appropriate antibiotics. Plates were incubated overnight at 37°C.
V. Manipulations of plant cells and organelles 3.19. Seed sterilisation
Seeds were washed in a 6% sodium hypochlorite solution (Ruel-Chemie, Karlsfeld, Germany) for 1 min. The hypochlorite solution was replaced by 70% ethanol (1 min). The ethanol was immediately removed and replaced by sterile water. Several washing steps with sterile water followed.
3.20. Isolation of plastids (according to Müller and Eichacker, 1999)
Chloroplasts were isolated from 3 week-old plant tissue culture growing on modified VBW medium (Aviv and Galun, 1985). Approximately 50 g of leaf material was used for homogenisation in 250 ml of medium A (ice-cold) in a Waring blender. The homogenate was filtered through Miracloth filter (Calbiochem, Darmstadt, Germany) and centrifuged for 2 min at 2545 g.
The chloroplast pellet was gently resuspended in medium A and centrifuged again for 30 sec at 5725x g and 4 oC. The pellet was then resuspended in approx. 500 µl of medium B and loaded to Percoll gradients (80%/40% for wild-type plastids; 80%/30% for PEP-deficient plastids). The gradients were centrifuged for 20 min, at 7800 g and 4oC. Intact chloroplasts accumulate at the phase between the two Percoll layers of different density. Chloroplasts isolated from gradients were diluted 1:3 in medium B and centrifuged for 5 min, 5725x g and 4oC. Plastids are resuspended in 1 ml of medium B and counted in a Thoma chamber. For run-on analysis 2 x 10⁶ plastids/µl were used.
Medium A
4 mM ascorbate
1.2 mM MnCl2
0.8 mM MgCl2
4 mM EDTA
1 mM KH2PO4
4 mM DTT
0.2% (w/v) BSA
0.1% (w/v) PVP-10
25 mM MES
25 mM HEPES, pH 6.8 (KOH)
Medium B
0.33 M sorbitol
50 mM HEPES, pH 7.6
80% Percoll solution, pH 7.6 (KOH)
80% (w/v) Percoll
0.33 M sorbitol
50 mM HEPES
30% Percoll solution, pH 7.6 (KOH)
30% (w/v) Percoll
0.33 M sorbitol
50 mM HEPES
3.21. Fractionation of chloroplasts into stroma and thylakoid membranes
Freshly prepared chloroplasts were osmotically ruptured with TMK buffer (100 µg chlorophyll /0.5 ml TMK buffer). Chloroplasts were lysed for 10 min in darkness on ice and centrifuged for 3 - 5 min at 2000 x g. The supernatant (stroma fraction) was collected, the pellet (thylakoids) was washed twice by centrifugation in TMK buffer. The final pellet was resuspended in TMK buffer. Aliquots of the thylakoids were stored at –70°C.
TMK Buffer
10 mM Tris/HCl, pH 6.8
10 mM MgCl2
3.22. Isolation of the major thylakoid protein complexes
Thylakoid protein complexes, equivalent to 3 x 10⁸ chloroplasts were solubilized for 10 min in ice by 1.5% (w/v) β-dodecylmaltoside (final concentration) as described in Müller et al. (1999). The thylakoid lysate was loaded onto linear 0.1 - 1.0 M sucrose gradients and centrifuged for 16.5 h at 36 000 x g and 4°C (Beckman rotor SP 40 Ti). The sucrose gradients were top-to-bottom fractionated into 35 fractions of 300 µl each using an ISCO 640 gradient fractionator (Instrumentation Specialties Company, USA). For further analyses individual gradient fractions were precipitated with 10% (w/v) trichloroacetic acid and washed with 100% acetone.
3.23. Plastid transformation
The biolistic transformation technique (Boynton et al., 1988; Svab et al., 1990; Svab et al., 1993) was applied. 60 mg of gold particles (0.6 µm) were suspended in 220 µl sterile water and mixed with 25 µl of purified plasmid DNA (1 µg/µl), 250 µl of 2.5 M CaCl2, 50 µl spermidin (0.1 M), followed by 2x washing of the DNA-coated gold
particles in 100% ethanol (p.a.), and final suspension of the gold particles in 72 µl of 100% ethanol. The gold particles were delivered into plant cells using Particle Gun - PDS 1000/He, Bio-Rad (Hercules, USA).
Parameters used with the Particle Gun Device
helium pressure 1100 psi
rupture discs 900 psi
distance rupture disc/macrocarrier 8 - 10 mm distance macrocarrier/stopping screen 10 mm
distance stopping plate/table 7 cm
vacuum (26 – 27 inches Hg) 0.85 bar
For each plasmid construct 20 leaves were shot and dissected 48 h after particle bombardment into 3 x 3 mm segments that were kept in sterile Petri dishes under non-selective conditions for 3 days, and then under selective conditions.
3.24. Selection and regeneration of the mutants
Selection with 500 mg/liter of spectinomycin started three days after transformation. Green colonies began to appear and grow vigorously after approximately 3 weeks, while untransformed cell lines bleached and showed impaired growth. Resistant calluses were transferred onto RMOP medium and cultivated in Petri dishes until shoot formation. For further segregation transplastomic lines were transferred into Petri dishes containing fresh medium at 3 - 4 week intervals. After several rounds of segregation, small green shoots were transferred to 750 ml glass jars containing B5 agar with antibiotic, and grown for 4 - 6 weeks until use.
3.25. Isolation of protoplasts and transformation for transient expression (according to Bayley et al., 1992)
This method was used to characterise the import of the nuclear encoded T3/T7-phage type RNA-polymerases (method modified according to Bayley et al., 1992).
Axenically grown wild-type tobacco leaves (3 weeks old) or leaves of PEP-deficient material (4 - 5 weeks old after regeneration) were harvested (5 - 8 leaves) and incubated with 10 - 15 ml K3AS-medium containing 0.25% Cellulase R10 (Serva) and 0.125% Macerozyme R10 (Serva). The leaves were cut into small stripes (1 mm) and incubated overnight at RT gently shaking in a shaded box. To facilitate release of the protoplasts, the suspension was gently pipetted up and down using a wide-bored pipet. The suspension was filtered through a sterile 100 mesh filter and washed with 5 ml of K3AS medium.
min of incubation at room temperature 0.5 ml of 40% PEG solution were added and gently mixed. The suspension was incubated for 25 min at room temperature and then diluted with 5 ml of W5 medium, and then centrifuged for 5 min at 200x g. The pellet was resuspended in K3AM solution to approximately 105 protoplasts/ml and incubated in the dark. The cells were harvested after 16 - 24 h by centrifugation for 5 min at 200x g, resuspended in a few µl of K3AM medium and analysed microscopically.
K3AS medium (for 100 ml), pH 5.8 (KOH), after (
Murashige and Skoog-salts + vitamins 10 ml of 10x stock solution
CaCl2x2H2O 0.046 g
sucrose 13.7 g
W5 medium (for 500 ml), pH 5.8 (KOH)
NaCl 4.5 g
CaCl2 x 2H2O 9.18 g
KCl 0.185 g
glucose 0.45 g
2x MaMg medium (for 50 ml), pH 5.8 (KOH)
mannitol 7.3 g
MgCl2 x 6H2O 0.305 g
MES 0.2 g
K3AM medium (for 100 ml), pH 5.8 (KOH)
Murashige and Skoog salts +vitamins 10 ml of the 10x stock solution
CaCl2x2H2O 0.046 g
sucrose 3 g
mannitol 7.28 g
40% PEG solution (for 10ml), pH 5.8 (KOH)
4 g of PEG6000 was disolved in 5 ml of 2x MaMg medium and subsequently adjusted up to 10 ml with water. All solutions were filter sterilized.