Derivation of temperature dependent mechanical properties
of polymer foam core materials using optical extensometry
J.M. Dulieu-Barton1,a, C. Boyenval Langlois2, O.T. Thomsen3, S. Zhang1, R.K. Fruehmann1
1School of Engineering Sciences, University of Southampton, Highfield, SO17 1BJ, UK, 2 French Institute for Advanced Mechanics (IFMA), Campus de Clermont-Ferrand / les Cezeaux,
BP 265, 63175 AUBIERE Cedex, France
3Department of Mechanical and Manufacturing Engineering, Aalborg University,
Pontoppidanstræde 101, DK-9220 Aalborg East, Denmark
Abstract.A methodology for determining the temperature dependence of Young’s modulus and Poisson’s ratio of polymer foams core materials is presented. The design of the test specimen is described in detail, covering the parasitic effects resulting from departures from the uniform strain condition. The measurement approach is based on a non-contact technique so that the behaviour of the complaint foam is not modified by the attachment of strain gauges or extensometers. Firstly experiments are conducted at room temperature and then at elevated temperatures in a thermal chamber. Readings are taken through an optical window using a standard digital camera. Digital image correlation is used to obtain the strains.
1
Introduction
Polymer foam cored sandwich structures are being used increasingly for a variety of applications including wind turbine blades, boat hulls and ship structures as well as for structural applications in the transportation and aerospace sectors. Polymer foams (usually polyvinylchloride, PVC or Polyethylene, PET) are commonly used. Sandwich structures are often subjected to aggressive service conditions that may include elevated temperatures. The material properties of foam cored sandwich structures depend on the temperature field imposed, particularly as the mechanical properties of the polymer foam core material are sensitive to elevated temperatures, and hence significant degradation of the mechanical properties can occur well within the operational temperature range. For example, PVC foams (Divinycell® and Airex®) lose all stiffness and strength at about 80-100oC, while PMI foams (Polymethacrylimide, e.g. Rohacell®) lose the heat distortion resistance at about 200oC. Moreover, significant degradation of the properties of the foam occurs at much lower temperatures than the temperatures where a complete loss of stiffness and strength is experienced. The thermal degradation of polymer foam cored sandwich structures is generally poorly understood. However, there is a growing concern that the simultaneous action of mechanical loads and elevated temperatures may compromise the structural integrity under certain circumstances, e.g. [1]. At the same time the manufacturers of polymer foam core materials, including PVC, PET, PMI and other polymer foam types, offer limited and incomplete information
a e-mail : [email protected]
© Owned by the authors, published by EDP Sciences, 2010 DOI:10.1051/epjconf/20100638004
about the temperature dependence of the core properties alone and without any consideration of the effects of interacting mechanical and thermal loads. The starting point in mapping the thermal degradation behaviour of polymer foam sandwich structures is to ascertain the mechanical properties of the foam over a range of temperatures.
The work described in this paper investigates the strain distributions and sensitivity to misalignment of a typical foam specimen under tensile loading using a combination of full-field optical techniques and finite element analysis (FEA). A comparison with results from other sources is also included.
2
Experimental Arrangement
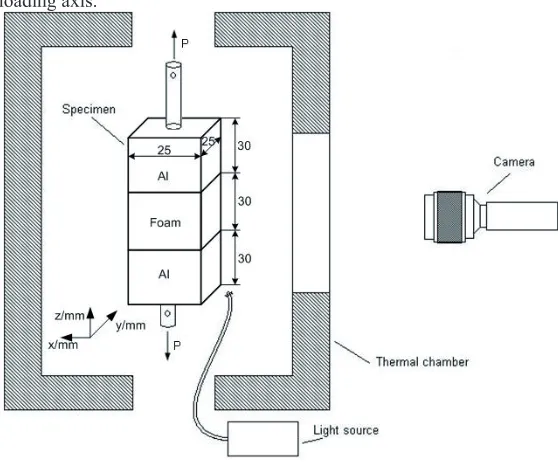
The dimensions of the foam specimen are constrained by the dimensions of the available material, usually obtained as a flat panel, and the requirement for a suitably strong specimen to fit the test machine. Further, as the foam is a cellular material, a minimum dimension is necessary to ensure that the macroscopic properties are measured. In sandwich beams it is the through thickness properties of the foam that are of primary interest. During the forming process, the cells are formed with a directional bias. Hence, the material properties are not necessarily the same in all directions, and it is desirable for the through thickness direction to be measured specifically. The maximum length of the specimen is therefore defined by the thickness of the foam panel. The minimum width and thickness is defined by the requirement of the specimen to withstand the applied load during testing without sustaining damage. In this work Divinycell PVC H200 and H100 30 mm thick foams were used, giving specimen dimensions of 25 x 25 x 30 mm, as shown in Figure 1. A further consideration is the overall specimen dimensions compared to the average cell size (0.3 ± 0.03 mm and 0.4 ± 0.06 mm in the H200 and H100 foams respectively [2]) to achieve a representative volume. So the test specimen dimensions are approximately 100 times greater than the cell size. Machined aluminium blocks were bonded to the specimen to provide a connection into to the test machine grips. The load was applied via a pin-joint that allowed self alignment of the specimen parallel to the loading axis.
Fig. 1. Experimental setup
full-field data that enables the uniformity of the strain field to be assessed. Two systems have been deployed in this work: a 3D digital image correlation (DIC) system from LA Vision to provide full field data at room temperature, and a video extensometer (VE) from Imetrum that provides strain measurements between selected points on the surface and requires significantly less processing time. During the initial tests, both systems were used together, first viewing the same face, to verify the agreement between the two techniques and second, viewing opposite faces of the specimen, to verify the alignment of the test configuration.
For the tests at elevated temperatures a thermal chamber was placed in the test machine and the load applied via the test rig which was mounted through holes in the top and bottom of the chamber. The chamber had an optical glass window to allow the specimen to be viewed by the camera from the outside (as shown in Figure 1). A fibre optic light was passed through the lower hole to illuminate the specimen face from below at a shallow angle. The contrast produced by the cellular surface provided the speckle pattern used in the VE measurements.
This test setup (in particular the specimen geometry) has been selected for practical reasons, most importantly relating to the available dimensions of the foam. The main challenges associated with this setup are as follows:
1. The low aspect ratio of the specimen and the Young’s modulus mismatch between the foam and the aluminium end tabs result in a non-uniform strain distribution in the specimen, due to restrained transverse (in-plane) contraction effects in the vicinity of the end tabs. How then can surface measurements be related to the bulk material properties?
2. How does this relationship change as the material properties of the foam decay at elevated temperatures?
3. The low aspect ratio of the specimen makes it very sensitive to misalignment in the test rig. How can misalignment be identified and quantified, and is it possible to compensate for it? 4. Are the VE measurements influenced by viewing through a window, and how can this be
addressed?
3
FEA of specimen strains
3.1 Model
The distribution of the strain through the thickness of the specimen was studied using FEA. The strain distribution will be influenced by the specimen material properties, the specimen geometry and the nature of the end constraints where the load is introduced to the specimen. An FEA model was constructed in ANSYS [3] with the dimensions shown in Figure 1. The material properties of the Divinycell PVC H200 and aluminium are shown in Table 1.
Table 1. Material properties
Foam [4] Aluminium [5]
Tensile Young’s modulus(MPa)
250 68000
Poisson’s ratio 0.32 0.35
3.2 Results
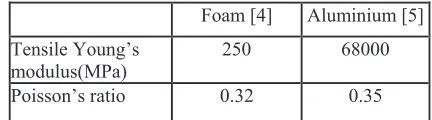
The resulting solution of the strain in the z-direction (z) is shown in Figure 2. It can be seen that z is
distributed non-uniformly in the specimen. Ignoring the boundary regions adjacent to the aluminium tabs, the highest strains are found in the centre of the specimen, both on the surface and through the thickness. The area enclosed by the dots on the surface represents the measurement area. In Figure 2b plots of the distribution of the strains over the lines marked a, b and c are shown. To quantify the strain distribution uniformity, a coefficient is defined as:
_ min
_ max z
z H K
H
(1)
where, z_max and z_min are the maximum, minimum z-direction strain on foam mid-plane. By the definition of the strain distribution uniformity coefficient, an value closer to unity means more a uniform strain distribution.
(a)
(b)
Fig. 2. z-direction stain distribution, (a) 3D view of specimen, (b) distribution along lines a, b and c
effect with a decrease leading to a more uniform strain distribution (typical PVC foam core Poisson’s ratio values lie in the range 0.3-0.4 [4]).The effect of the strain non-uniformity on the surface Poisson’s ratio was also considered. This was found to have a minimal effect and therefore has been omitted for reasons of brevity.
3.3 Surface strain correction
To obtain the Young’s modulus of foam from the strain on the surface, and assuming that the foam behaves as a linear elastic solid loaded in a unidirectional and uniform state of stress and strain, it is necessary to compare the foam surface strain s and the foam ideal strain a, defined as:
P
a EA
H (2)
where P, E and A are the tension load, foam Young’s modulus, and foam cross-sectional area, respectively.
The foam surface strain s was obtained as the average strain over the central 20 x 20 mm area on
foam surface, the dashed line area as shown in Figure 2a, replicating how the surface strain is measured experimentally. A correction coefficient is defined as:
a s H P
H
(3)
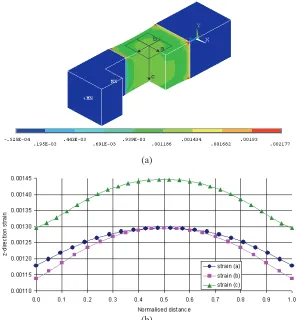
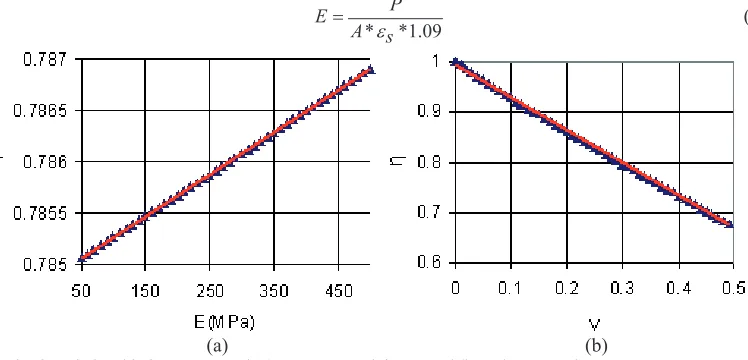
Because it has been verified that the foam Young’s modulus does not affect the strain distribution significantly, can be considered as a constant and a value of 1.09 is obtained with the FEA model under the assumption of a Poisson’s ratio equal to 0.32 [4]. Therefore, in the DIC measurements for foams, Young’s modulus E can be estimated as:
* *1.09 P E
A Hs (4)
(a) (b) Fig. 3. Relationship between and (a) Young’s modulus E, and (b) Poisson’s ratio
3.4 Off-axis load
In the experiments, the loading axismay be offset from the centre line of the specimen as shown in Figure 4, which will introduce bending to the specimen and a different strain on surfaces A and B. To investigate this difference, the FEA model has been rerun with the same characteristics as described in section 3.1 but with the load offset from the centre line by a distance dx.
From Figure 5, it can be seen that z on surface A is greater than that on B with a positive value
conducted, this may bring a very inaccurate assessment of the specimen stiffness. However, the average strain of the two surfaces does not change with the load offsetdistance, dx, and it is exactly the same as the surface strain obtained from an ideally aligned test. Thus, simultaneous strain measurements on two sides must be utilised to obtain accurate value of Young’s modulus.
Fig. 4. Off-axis load schematic Fig. 5. Strain on surface A and B with different load offset distance
4
Experiments at room temperature
One of the first challenges is to compare the accuracy of both measurement techniques to validate the feasibility of using the VE for the tests at elevated temperatures through the glass window of the chamber. To achieve this, experiments have been carried out by measuring the strains on one side of a Divinycell H200 foam specimen using both DIC and VE. The results are given in Table 2 and show a very good agreement between the two techniques, with a standard deviation of less than 5%. This gives confidence in using the two techniques interchangeably. The average value of Young’s modulus is given as 221.7 MPa which is 11% less than the value given by the manufacturer (see Table 1). This reduced value could be as a result of misalignment in the test rig and must be investigated.
Table 2. Measured Young’s modulus at room temperature
Test number 1 2 3
Young’s modulus - VE (MPa) 220.5 222.5 222.6
Standard deviation (MPa) 8.6 9.2 9.0
Young’s modulus - DIC (MPa) 226.4 221.3 217.1
Standard deviation (MPa) 2.4 3.7 2.9
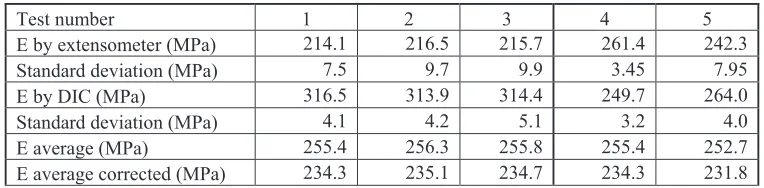
To evaluate the effect of misalignment of the test rig during tests, experiments have been carried out measuring the strains on two opposite sides of a Divinycell H200 foam specimen. Three measurements were taken with the DIC viewing the forward face and the VE viewing the rear. The specimen was then rotated through 180° and two further test runs were conducted. The results are shown in Table 3. The average for the results from both faces is given and then this is corrected using equation (4).
surface readings show that the Young’s modulus of this foam is 234.0 MPa approximately 6% less than the manufacturers quoted value.
Table 3. Measured Young’s modulus on opposite faces of misaligned test.
Test number 1 2 3 4 5
E by extensometer (MPa) 214.1 216.5 215.7 261.4 242.3
Standard deviation (MPa) 7.5 9.7 9.9 3.45 7.95
E by DIC (MPa) 316.5 313.9 314.4 249.7 264.0
Standard deviation (MPa) 4.1 4.2 5.1 3.2 4.0
E average (MPa) 255.4 256.3 255.8 255.4 252.7
E average corrected (MPa) 234.3 235.1 234.7 234.3 231.8
5
Experiments at elevated temperature
For the tests at elevated temperatures, a thermocouple was used to continuously monitor the surface temperature of the test specimens. The VE was used to collect deformation data through the optical window. This was first done at room temperature with and without the window in place. It was shown that the window did not impair the measurements, provided that the brightness of the illumination of the sample is greater than the ambient light outside the chamber. Having validated the setup, data was then collected over a range of temperatures from ambient (~20°C) to 100°C. The procedure was such that the temperature in the chamber was increased in increments of 1oC and between each temperature increment the specimen temperature was allowed to stabilise (this took approximately 15 minutes between tests). The load was applied as in the room temperature tests in position control at a rate of 0.1 mm/min. The strain readings were collected from each test and a stress-strain curve was plotted from which Young’s modulus was evaluated. Unfortunately the scatter in the data was such that accurate values of Poisson’s ratio could not be establish; however these appeared to have little dependence on temperature.
Figure 6 shows the Young’s modulus value plotted against temperature for both H100 and H200 foam. As the temperature increases as expected the modulus decreases. The H100 foam could only be tested up to 345 K due to failure at the adhesive interface. The tests demonstrate the deterioration of Young’ modulus with temperature and the tests on the H200 foam reveals a sharp reduction at 350 K as the material enters the glass transition stage around 354 K for PVC. It is important to note that the values shown in Figure 6 have not been corrected for misalignment. However the plot clearly shows the validity of the approach and in future work misalignments can be correct by taking reading from opposite faces before and after the test.
To compare the results with tests on similar materials, the stiffness was normalised against the room temperature Young’s modulus. Thus the loss of stiffness can be given as a percentage. A comparison with tests and numerical simulations by Frostig and Thomsen [1] is presented in Figure 7. Figure 7 shows a comparison between the results given in Figure 6 using the trend line for H100 foam with results of the numerical study [1] and experimental results from compressive tests [1] for Divinycell HP100 which is a ductile PVC foam core material. The three data sets show an almost identical trend despite the small differences in the material.
6
Conclusions
room temperature from opposite faces of the test specimen. Most importantly a modelling approach allowed compensation for departures from uniform strain in the specimens.
Fig. 6. Change in Young’s modulus of H100 and H200 foams with temperature
Fig. 7. Normalized temperature-dependent elastic modulus of Divinycell H100 and HP100 foams
Acknowledgements
The work presented has received support by the Danish Council for Independent Research |Technology and Production Sciences (FTP), Grant Agreement 274-08-0488, “Thermal Degradation of Polymer Foam Cored Sandwich Structures”. The Divinycell PVC foam core materials were kindly supplied by DIAB AB, Sweden. The support received is gratefully acknowledged.
References
1. Frostig, Y. and Thomsen, O.T., 2008, “Non-linear Thermal Response of Sandwich Panels with a Flexible Core and Temperature Dependent Mechanical Properties”. Composites Part B: Engineering Vol. 39, Issue 1, pp. 165-184.
2. Viana, G.M. and Carlsson, L.A., 2002, “Mechanical properties and fracture characterization of cross-linked PVC foams”. Journal of Sandwich Structures and Materials Vol. 4, pp. 99-113. 3. ANSYS Edition 12.0