E-mail:[email protected] Received 16 October 2006 Published 7 December 2006
Online atstacks.iop.org/JPhysCM/19/016006
Abstract
A simple bond model of the optical second-harmonic (SH) response from interfaces, which assumes a single axial component for each bond, is tested by comparing the response from different step structures at the Si–SiO2interface. The response of native-oxide-covered vicinal Si(111), offcut by 3◦ towards
[¯112¯ ], is compared with previous work on similar samples, but offcut by 5◦ in the opposite, [112¯], direction. The two offcuts have different step geometries, but the same terrace structure at the Si–SiO2 interface, while the bulk quadrupolar contributions from the two offcuts are related by simple geometric factors, thus significantly constraining the number of adjustable parameters. The bond model is tested against experiment for the eight sample rotation plots obtained by permuting s- and p-polarization combinations. The constrained fit is found to be too poor to justify the extraction of quantitative information. Kleinman symmetry is shown to be a necessary, but not sufficient, condition for determining whether such a simple bond model can be applied, quantitatively, to the SH response from interfacial structures. It remains possible that quantitative information may be obtained from axial bond models by including local field effects in a simple way.
1. Introduction
simplified approach offers the interesting possibility of estimating linear bond polarizabilities from the single axial nonlinear component, which could lead to a unified microscopic model of nonlinear optical SHG and linear optical reflection anisotropy spectra [7].
Powell et al [4], who proposed the SBHM, tested their approach by using the experimental data from vicinal Si(111)–SiO2and Si(001)–SiO2interfaces obtained by L¨upke et al [6]. The sample rotation plots for sS, pS, sP and pP polarization combinations, where mN indicates m-polarized input and N-polarized SH output, showed remarkably good agreement with the SBHM, using only three different bond hyperpolarizabilities. The agreement was surprising because, first, full ab initio valence bond calculations of SHG from adsorbate-terminated Si(111) surfaces produced transverse hyperpolarizability components comparable in size to the axial components [1]; second, the substantial bulk quadrupolar contribution to SHG at Si(111)– SiO2 interfaces was neglected; third, local-field effects, which are known to be important in bond calculations of the optical response [1,8], were not included; fourth, the model did not distinguish adequately between the step and terrace bonds of the vicinal interface [9]. The model was easily adapted to deal with this last point by using appropriate statistical weighting, which produced more intuitively appealing values of the three bond hyperpolarizabilities for the Si(111)–SiO2interface [9]. However, the large bulk quadrupolar contribution remains to be determined quantitatively, before firm conclusions can be reached about the usefulness of the SBHM for Si(111) surfaces and interfaces.
Kwon et al [7], in a spectroscopic SHG and reflection anisotropy spectroscopy study of vicinal Si(001)–SiO2 interfaces, applied correct statistical weighting and were also able to include the anisotropic bulk quadrupolar response by measuring the singular Si(001)– SiO2interface. The isotropic bulk contribution, however, could not be identified for reasons discussed in section2.1. Fitting to pP plots, as a function of energy, produced very good fits that were improved by allowing the bond angles to vary. The bond parameters were used to generate sP plots that agreed well with experiment. Even with spectroscopic information, however, there is a concern that the use of only two polarization combinations may allow good fits to be obtained with incorrect parameters, given the number of adjustable parameters in the model.
In this paper four polarization combinations, from two related interfaces, are used to constrain the fits. The bulk quadrupolar contribution to the SH response from the Si(111)– SiO2interface is determined by exploiting the SH response from two vicinal interfaces with different interfacial step structure: SHG is known to be particularly sensitive to steps at surfaces and interfaces [10,11]. Bulk contributions are identified by comparing the SH response of a Si(111)–SiO2interface offcut by 3◦towards[¯112¯ ], using an excitation wavelength of 765 nm, with previous work at the same wavelength on similar samples, but offcut by 5◦in the opposite,
[112¯], direction. For these low vicinal angles, where there is no evidence of faceting at the interface, the two offcuts will have the same values of the bulk and terrace tensor components, with only the step components changing. By using steps in this way, simultaneous fitting of the eight rotation plots described above allows the bulk and interface contributions to be determined using the standard phenomenological model. The SBHM is then tested rigorously against experiment by the coherent addition of the bulk contribution to the SBHM dipolar response.
2. Interface structure and theory
2.1. Structure
The interface of each of the vicinal offcuts has 1m symmetry, with a single,xˆ− ˆz mirror plane
Figure 1. Schematic plan view of the bulk-terminated Si(111) surface, showing step bonds associated with[¯112¯ ]and[112¯]offcuts: step regions are indicated by the boxes.
directions of the bulk-terminated Si(111) surface is shown schematically. It is generally agreed that the formation of a native-oxide layer on the Si(111) terraces produces an abrupt interface containing a range of suboxides, but the detail remains controversial [12–15]. At the steps, the interface structure is also likely to involve suboxide formation, but no definitive work has been reported, presumably due to the difficulty of isolating the small step response. For the purposes of this work, the key factor is that two offcuts differ only in their step structure, and 180◦rotation of the step bonds might be expected to produce a similar difference in the phase of the tensor components of the step-related SH response.
2.2. Phenomenological theory
The SH response comprises dipolar contributions from the interface and quadrupolar contributions from the bulk (contributions from SiO2 surfaces are negligible in comparison [16]). Ten independent dipolar tensor components are allowed for interfaces of 1m symmetry and, for cubic media such as bulk Si, the quadrupolar tensor components reduce to one isotropic parameter,γ, and one anisotropic parameter,ζ [17]. The quadrupolar contribution for any bulk crystallographic orientation can be calculated using the appropriate geometric factors. Full phenomenological expressions for the 12 independent tensor components, which include the effect of vicinality on both the components and the Fresnel factors, have been published by L¨upke et al [6]. These relate the SH intensity arising from sample rotation for sS, pS, sP and pP polarization combinations to the tensor components, for vicinal surfaces and interfaces of cubic materials. The SH intensities arising from sample rotation are analysed in terms of the complex Fourier components, cn(m,N), of the azimuthal angle,ψ:
Im S(ψ)2ω ∝
4
n=1
cn(m,S)sin(nψ)
2
and Im P2ω(ψ)∝
4
n=0
cn(m,P)cos(nψ)
2
. (1)
The expressions of L¨upke et al relate cn(m,N)to the tensor components. A complication,
interface contribution. The form of the expression is(γ +ε2ω∂31), whereε2ωis the dielectric function of the bulk at the SH frequency and ∂31 = χzxx, using the standard contracted notation: this prevents separating these components using the rotation plots. In contrast, the bulk anisotropic contribution,ζ, can be distinguished: for example, it is the sole contributor to the fourfold rotation patterns observed from singular Si(001) interfaces. Fitting to the 12 parameters of the phenomenological expression thus leaves an arbitrary division betweenγ and∂31.
Previous SHG studies of the Si/SiO2 interface have obtained reasonable estimates of
ζ [6,10,17,19], but estimates ofγ have ranged from∼32|ζ|[6] to being negligibly small [20]. It has been pointed out that, asζ can be measured, a good theoretical calculation of(γ /ζ ) would be sufficient to resolve this problem [21]. While this is not yet available, an estimate can be obtained by using the relationship between third-order bond polarizabilities and the third-order (fourth-rank) susceptibility tensor components [22]: this would appear to be the best available approach at present, and is consistent with testing bond models. In recent work applying the SBHM to third-harmonic generation (THG), the axial model had to be extended to include a transverse third-order component, α3t, as well as the longitudinal component, α3l, in order to obtain reasonable agreement with bulk THG data from Si [22]. The algebraic relationship between the susceptibilities and hyperpolarizabilities restricts the TH isotropic/anisotropic ratio to between−12 and−14 for 0 (α3t/α3l) ∞, assuming the
αcomponents are real. This assumption is reasonable as the excitation wavelength of 765 nm corresponds to harmonic energies of 1.6, 3.2 and 4.9 eV, while the Si bulk E1and E2resonances are centred at 3.4 and 4.4 eV [23], with widths of about 0.1 and 0.2 eV, respectively. The middle value, corresponding to(γ /ζ )= −0.375, is used in section3. This middle value gives a TH anisotropy parameter, σ = −0.8, in reasonable agreement with the experimental value of
|σ| =0.6 for 765 nm excitation [6].
2.3. Bond theory
The SBHM of Aspnes and co-workers [4] gives the SH field in the far-field region, for the real space repeat units, as
E=k2 e
ikr
4πε0r
j
pj− ˆk
ˆ k· j pj (2)
where the sum is over the different bond types, j , in the repeat unit andk = kk is the SHˆ
wavevector in the direction of the detector. The induced second-order polarization is given by
j
pj=
j
βj(bˆj·E)2bˆj (3)
whereβjis the second-order bond polarizability (the lowest-order hyperpolarizability),bˆj are
unit vectors along the bond axes, andE is the electric field at the fundamental wavelength:
Figure 2. Schematic diagram of the interface geometry of Si(111), for vicinal angleα, showing the bonds in a repeat unit associated with a Si terrace atom and a Si[¯112¯ ]step atom.
down bonds are assumed to have the same hyperpolarizability. The average interface response of each bond is then the population-weighted sum of the two units [9]:
βinterface
j =β
terrace
j (1−tanα)+β
step
j tanα (4)
whereαis the vicinal angle. Figure2 shows that equation (4) only affects the left-pointing bond of the unit, whose average value becomes the weighted sum of step bond and the terrace down bond. Only three complex bond hyperpolarizabilities are thus needed to generate the SH field from the interface,βup,βdownandβstep, giving six bond parameters for fitting. The total SH response is obtained by adding, coherently, the SH fields from the interface and the bulk, the parameters of the latter being taken from the phenomenological fit:
Im N2ω(ψ, α)∝ |E
2ω,bulk
m N (ψ, α)+E
2ω,interface
m N (ψ)|
2. (5)
Only the relative phases of the components are required, which allows the bulk component,ζ, to be taken as real (and alsoγ, as discussed above). The remaining components are assumed to be complex.
2.4. The relationship between susceptibility tensor components and bond hyperpolarizabilities
When local fields are neglected, the hyperpolarizability tensor component,βijk, of the repeat
unit in its coordinate system is related to the interface dipolar susceptibility tensor component,
χi j k, in the laboratory frame by simple geometric factors [24]:
χi j k =Ns(TiiTj jTkk)βijk (6)
where Nsis the number of repeat units per unit area of the interface, Tii are components of the coordinate transformation tensor, T, and there is an implied summation. This expression has been widely used to determine the average orientation of molecules in monolayer films using SHG by assuming that the molecular hyperpolarizability is dominated by only one or two components [24]. Where the response can be approximated by a single component,
βξξξ, aligned along the long axis,ξ, of the molecule (this is the main SBHM approximation), equation (6) simplifies to
χi j k =Ns(i·ζ)(j·ζ)(k·ζ)βξξξ, (7)
Equation (7) shows that, within this approximation,χi j k =χki j=χj ki, etc. These are the
Kleinman symmetry relations [25,26] and it can be seen that, where the nonlinear response can be approximated by a single axial component and where local fields are neglected, Kleinman symmetry is a necessary consequence. Within the SBHM, each bond satisfies this requirement and thus the whole repeat unit must obey this symmetry. For SHG in the bulk, away from resonances, Kleinman symmetry has proved to be a useful concept, although even here its applicability appears to be more limited than was previously thought [27]. There is no evidence that it is generally obeyed at interfaces and this may limit the applicability of the SBHM: the model is unlikely to be useful for interfaces where the standard phenomenological model reveals large departures from Kleinman symmetry. The first step in testing the model will be to attempt a phenomenological fit of the data with Kleinman symmetry imposed. A reasonable result will indicate that an SBHM fit may be possible and useful results obtained.
3. Experiment
SHG sample rotation plots for sS, pS, sP and pP polarization combinations were obtained in air from native-oxide-covered, vicinal n-type Si(111) samples, cut 3◦ towards[¯112¯ ]. A diode-pumped, mode-locked Ti:sapphire laser was used to produce∼130 fs pulses at 765 nm excitation wavelength, at a repetition rate of 76 MHz and with an average laser power of 0.9 W. The output was very stable, avoiding the need for point-by-point normalization procedures. The beam diameter was 30μm at the sample, and an incident angle of 45◦was used. Sample alignment was consistent with that of reference [6]: the incoming beam looks down the steps of the[112¯]offcut and up the steps of the[¯112¯ ]offcut, forψ =0◦(the beam comes from the left in figure2). Stable and reproducible SHG signals were obtained by displacing the laser beam 500μm from the axis of sample rotation for each measurement, in order to prevent the build-up of laser-induced charge at the oxide surface [7]. Care is required because electrons from the Si valence band can undergo multi-photon excitation into the oxide conduction band and become trapped, producing a significant time-dependent, electric-field-induced SHG signal [28].
4. Results and discussion
4.1. Rotation plots of the two offcuts
Rotation plots of the SH intensity for the four polarization combinations from the two interfaces are shown in figure3, both sets of data being obtained using 1.62 eV (765 nm) excitation. The smoothed data in the left panels were generated from the Fourier coefficients for the
[112¯]offcut from reference [6]. The data on the right are from the[¯112¯ ] offcut, where the graphs are normalized such that |c3(m,N)| = 1. This allows direct comparison with the results of L¨upke et al and also avoids having to compare absolute intensities between different polarization combinations. In addition, the normalization determines(∂11/ζ )to within±5% via the c3(m,N)equations.
Figure 3. SH rotation plots for native-oxide-covered vicinal Si(111). Left panels: 5◦offcut towards
[112¯]; smoothed data generated from the Fourier coefficients of reference [6]. Right panels: 3◦ offcut towards [¯112¯ ]; raw data scaled to |c3(m,N)| = 1. The solid lines are fits using the
expressions of reference [5], assuming Kleinman symmetry.
4.2. Phenomenological fits and the bulk contribution
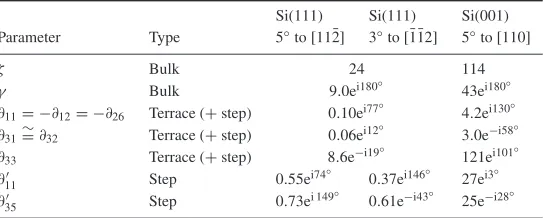
Table 1. Fitted parameter values, assuming Kleinman symmetry.
Si(111) Si(111) Si(001) Parameter Type 5◦to[112¯] 3◦to[¯112¯ ] 5◦to[110]
ζ Bulk 24 114
γ Bulk 9.0ei180◦ 43ei180◦
∂11= −∂12= −∂26 Terrace (+step) 0.10ei77◦ 4.2ei130◦ ∂31∼=∂32 Terrace (+step) 0.06ei12◦ 3.0e−i58◦
∂33 Terrace (+step) 8.6e−i19◦ 121ei101◦ ∂
11 Step 0.55ei74
◦
0.37ei146◦ 27ei3◦ ∂
35 Step 0.73ei 149
◦
0.61e−i43◦ 25e−i28◦
terraces have 3m symmetry, with four independent components: ∂11 = −∂12 = −∂26, ∂15 =
∂24, ∂31 = ∂32, ∂33. The steps have 1m symmetry, with ten independent components:
∂11, ∂12, ∂13, ∂15, ∂24, ∂26, ∂31, ∂32, ∂33, ∂35. The overall response is a coherent addition of the bulk, terrace and step contributions. The low step density of these vicinal surfaces allows the approximations∂31 ∼=∂32,∂15 ∼=∂24, to be introduced for these components, which are exact for the terrace. The experimental c2(m,N)Fourier components depend on the differences,
(∂31−∂32)and(∂15−∂24), which are measured to be zero within experimental error in this work, and very small in previous work [6], for these vicinal Si(111) surfaces.
The number of components becomes manageable by noting that the bulk and terrace parameters are the same for the two offcuts, and by imposing Kleinman symmetry in order to force consistency with the SBHM, as discussed above: ∂12 = ∂26;∂13 = ∂35;∂15 =
∂31;∂24=∂32. The main step contributions appear in the 1m symmetry terms, where∂11 =3∂12 within these approximations [6], where the prime denotes a step component. This leaves five independent tensor components common to the two offcuts, and two step-related components that will be offcut dependent: this number of parameters is reasonable when eight independent data sets are available. The fitted values are set out in table1, where the 1m components are identified by a prime;∂11is separated into terrace and step contributions by assuming that the contribution with 3m symmetry arises mainly from the terraces and the contribution with 1m symmetry from the steps. A fit to the vicinal Si(001) data of L¨upke et al [6] is also included in table1, and is discussed below.
The estimated uncertainty in both the amplitude and phase in table1is±10%, except for
γ and ∂31, as discussed above. Very poor fits were obtained if the bulk contributions were set to zero. Figure3 shows that reasonable fits can be obtained using Kleinman symmetry, although better fits, with significant changes in some of the dipolar components, resulted if these symmetry relations were relaxed. However, the fitted bulk contribution did not change significantly, indicating that these parameter values are quite robust and can be used with confidence in testing the SBHM. Of particular importance for the SBHM calculation below is that the c3 Fourier component is dominated byζ, with the dipolar contribution,∂11, being small.
Figure 4. SH rotation plots, using 765 nm excitation, for native-oxide-covered vicinal Si(001), 5◦
offcut towards[110]. The smoothed data are generated from the Fourier coefficients of reference [6], which are scaled to|c4(m,N)| =1. The solid lines are fits assuming Kleinman symmetry.
7.0 forχxxx (|∂11 /∂11|in our notation) was estimated using sS plots from two different[112¯] offcuts [10], in good agreement with the value of 5.7±0.8 obtained here for the[112¯]offcut (3.9±0.5 was obtained for the[¯112¯ ]offcut).
As an additional test, the same procedure was used to fit 765 nm data from Si(001), offcut 5◦towards[110][6]. Figure4shows the excellent fits that were obtained to the more limited sP and pP data set, using Kleinman symmetry and the bulk values from the Si(111) fits, scaled to the|c4(m,N)| = 1 normalization, which also determines the value of ζ for this face (a very small imaginary contribution givesζ a phase of 5◦, which is offset in the table for comparison purposes). Fitted values of the parameters are shown in table 1 (note that the different normalization for (111) and (001) interfaces produces different scaling of the parameters). A value of|∂11 /∂11|of 6.4±0.9 was obtained but, in this case, the∂11 3m component can only come from the steps, as the (001) terraces have no 3m symmetry elements: this indicates that, for Si(111) offcuts, a significant step contribution to the∂113m component is possible.
Only limited further interpretation of the detailed results of table1is attempted. The step components from the three different interfaces are relatively large, consistent with the well-known sensitivity of SHG to step structures [10,11]. By far the largest dipolar component, however, for all the vicinal structures is∂33 ≡ χzzz. This is reasonable because, first, the pP data show that the∂33 term makes a significant contribution even though the bulk Si Fresnel factors scaling this term are very small and, second, the response normal to the interface is expected to experience the largest effects of symmetry breaking. The results for the possible 180◦ phase shift for step terms between the two opposite offcuts, mentioned in section 2.1, are also interesting. The shift for∂35 ≡χzxz is found to be 190◦±20◦, but is 70◦±20◦ for
∂
11 ≡ χxxx (table1). The first value is consistent with this simple interpretation, while the
second is not. A possible explanation is that Kleinman symmetry in the 1m terms requires
∂
11 = 3∂12 (χxxx = 3χxyy) , and the forced relationship with the y-dependent term may
complicate an otherwise simple interpretation.
(001) interfaces compared to (111) interfaces. Comparison of figures3and4shows that the vicinal Si(001) fit is much better than the Si(111) fit, presumably due to the smaller data set, the smoother structure and the smaller bulk contribution at these wavelengths, these three factors making vicinal Si(001) a less stringent test of the SBHM than vicinal Si(111).
With the large and structured data set, the fit to vicinal Si(111) is surprisingly good, given that Kleinman symmetry is expected to be broken at interfaces. The SBHM can now be tested in detail, as robust values of the bulk components have been determined and the Kleinman relations work to a reasonable approximation.
4.3. Testing the bond model
The detail and complexity in the previous discussion underlines the significant advantages a generally applicable SBHM would bring to low-symmetry interfacial structures. The phenomenological bulk contribution and the axial bond response within the SBHM are combined using equation (5). Very good fits were obtained for any single mN polarization plot. This is easily understood as the four bonds of the tilted unit (figure2) can generate c0, c1 and c3Fourier coefficients on rotation about the normal to the sample surface. It also explains the very good fits obtained when the large bulk contribution is ignored [4,5,9], as discussed in section1. Simultaneous fitting of the two mP plots or the two mS plots also produced very good results, with different bond parameters being found for the two types of plot. The potential problem of fitting to a limited data base, mentioned in section1, is now clear.
Very good simultaneous fits of the four rotation plots for the 3◦offcut were only obtained by allowingγto become much smaller than the table1value of−9, the fitted value being−0.8. Asγ only affects the mP plots, allowingγto vary freely will improve the simultaneous fits of the four plots. The discussion in section2.1indicated that there remains some uncertainty in the phenomenological value ofγ, but such a small value is unlikely.
The problem with testing the SBHM is now clear. The eight adjustable parameters arising from the amplitude and phase of the hyperpolarizabilities of the three distinct bonds (figure2), the weighting parameter of the Bruggeman EMA, and the isotropic bulk component,
γ(assumed to be real and negative as discussed in section2.1) require a larger data set to limit the fit. By using two opposite offcuts the data set can be doubled by the addition of only two extra parameters, the amplitude and phase of the opposite offcut step bond. The ‘up’ bond and the ‘down’ bonds are the same for both offcuts (figure2), but the single ‘step’ bond parameters of the[¯112¯ ]offcut may differ from those of the two ‘step’ bonds of the[112¯]offcut, because the step structure is not the same.
The simultaneous fit shown in figure5used the SiO2dielectric function and restrictedγto be real and negative. The bulk quadrupolar response is also shown in figure5as a guide to the size of the bulk contribution (note that the quadrupolar and dipolar fields add coherently, not the intensities). A value forγof−6.6 was obtained, which is reasonably close to the estimate of table1. Figure5shows that a significant proportion of the change in the sS plots, discussed in section4.1, arises from the variation in the bulk response with tilt angle.
Figure 5. SH rotation plots for native-oxide-covered vicinal Si(111). Left panels: 5◦offcut towards
[112¯]; smoothed data generated from the Fourier coefficients of reference [6]. Right panels: 3◦ offcut towards [¯1¯12]; raw data scaled to|c3(m,N)| = 1. The solid black lines are fits using equation (5) to combine the bulk and SBHM response. The grey line shows the bulk quadrupolar contribution.
The fitted values of the bond hyperpolarizabilities were: ‘down’, 0.9ei84◦; ‘up’, 14.8e−i13◦;
[¯112¯ ]‘step’, 15.0ei164◦; [112¯]‘step’, 8.6ei151◦. The ‘down’ bond is a Si–Si bond that, in the bulk, would produce zero dipolar response, so it appears reasonable that it is a factor of 15 smaller than the other bonds, which are polar Si–O bonds. The similar amplitudes of the ‘up’ and ‘step’ Si–O bonds also appears reasonable and is consistent with the well-known sensitivity of the SH response normal to the interface (e.g.∂33in table1) and normal to the step (e.g.∂11 and∂35 in table1).
Kwon et al [7], for the same excitation wavelength. Their ‘terrace’ Si–O bond value, however, at only 5% of the ‘step’ Si–O bond, is very small. While the contribution from the two terrace bonds might be expected largely to cancel parallel to the surface, the contributions should reinforce normal to the surface. It is surprising that the Si–O ‘terrace’ bond value of the (001) surface is not more comparable to the Si–O ‘up’ bond value of the (111) surface.
It is now clear that large data sets from related structures that constrain the number of adjustable parameters are needed to test the SBHM. The results show that the simple model does not produce a sufficiently good overall fit to the Si(111)–SiO2 interface to justify quantitative interpretation, although the qualitative information discussed above is useful. As regards improving the simple model, local fields are neglected in the SBHM and this may be an important omission. For example, it is known from work on molecular monolayers that bond tilt angles relative to the surface normal, when determined from the SH response using the same axial approximation as the SBHM, are too large. Smaller angles result when a simple point dipole approximation is used to correct for local field effects [30, 31]. The bond angles of the unit would be expected to increase beyond the tetrahedral angle, if these were allowed to vary to compensate for local field effects. It is difficult to justify introducing further variables: including the point dipole local field approximation, with its tightly defined parameters, may be a better approach to exploring whether the SBHM can obtain quantitative results for these interfaces. It remains possible, however, that transverse hyperpolarizabilities, as well as local field effects, will have to be included to obtain reliable quantitative results from bond models [1], but this would remove the principal simplifying feature of the SBHM.
5. Conclusion
A simple axial bond model of the SH response has been tested by using different step structures at the Si(111)–SiO2interface. Kleinman symmetry has been shown to be implicit for axial bond models that neglect local fields. The phenomenological bulk contribution has been identified and combined coherently with the dipolar response of the bond model. The resulting constrained fits are relatively poor, showing that Kleinman symmetry is a necessary, but not sufficient, condition for assessing whether this simple bond model can be applied, quantitatively, to a particular interface. It remains possible that quantitative information may be obtained within the SBHM by including local field effects in a simple way.
Acknowledgments
This publication has emanated from research conducted with the financial support of Science Foundation Ireland and the Irish Higher Education Authority. It is a pleasure to acknowledge useful discussions with David Bottomley, Gunter L¨upke and Michael Downer. Lee Carroll is thanked for experimental support and useful comments.
References
[1] Patterson C H, Weaire D and McGilp J F 1992 J. Phys.: Condens. Matter4 4017 [2] Mendoza B S and Mochan W L 1997 Phys. Rev. B55 2489
[3] Arzate N and Mendoza B S 2001 Phys. Rev. B 63 113303/1
[4] Powell G D, Wang J F and Aspnes D E 2002 Phys. Rev. B65 205320/1
[5] Wang J F T, Powell G D, Johnson R S, Lucovsky G and Aspnes D E 2002 J. Vac. Sci. Technol. B20 1699 [6] L¨upke G, Bottomley D J and van Driel H M 1994 J. Opt. Soc. Am. B 11 33
[20] An Y Q and Cundiff S T 2003 Phys. Rev. B67 193302
[21] Bottomley D J, Luepke G, Meyer C and Makita Y 1995 Opt. Lett. 20 453 [22] Peng H J and Aspnes D E 2004 Phys. Rev. B70 165312
[23] Erley G and Daum W 1998 Phys. Rev. B58 R1734
[24] Heinz T F 1991 Nonlinear Surface Electromagnetic Phenomena ed H-E Ponath and G I Stegeman (Amsterdam: Elsevier) p 353
[25] Kleinman D A 1962 Phys. Rev.126 1977
[26] Boyd R W 2003 Nonlinear Optics (Amsterdam: Academic) [27] Dailey C A, Burke B J and Simpson G J 2004 Chem. Phys. Lett.390 8 [28] Mihaychuk J G, Shamir N and van Driel H M 1999 Phys. Rev. B59 2164 [29] SOPRA sa 2006 Database n&khttp://www.sopra-sa.com/
![Figure 1.Schematic plan view of the bulk-terminated Si(111) surface, showing step bondsassociated with [1¯12¯] and [112¯] offcuts: step regions are indicated by the boxes.](https://thumb-us.123doks.com/thumbv2/123dok_us/8812367.919031/3.595.130.451.86.262/figure-schematic-terminated-showing-bondsassociated-offcuts-regions-indicated.webp)
![Figure 2. Schematic diagram of the interface geometry of Si(111), for vicinal anglebonds in a repeat unit associated with a Si terrace atom and a Si α, showing the [1¯12¯] step atom.](https://thumb-us.123doks.com/thumbv2/123dok_us/8812367.919031/5.595.149.464.85.229/figure-schematic-interface-geometry-anglebonds-associated-terrace-showing.webp)
![Figure 3. SH rotation plots for native-oxide-covered vicinal Si(111). Left panels: 5expressions of reference [◦ offcut towards[112¯]; smoothed data generated from the Fourier coefficients of reference [6]](https://thumb-us.123doks.com/thumbv2/123dok_us/8812367.919031/7.595.113.471.85.528/rotation-expressions-reference-smoothed-generated-fourier-coefcients-reference.webp)
![Figure 4. SH rotation plots, using 765 nm excitation, for native-oxide-covered vicinal Si(001), 5◦offcut towards [110]](https://thumb-us.123doks.com/thumbv2/123dok_us/8812367.919031/9.595.102.465.84.215/figure-rotation-plots-excitation-native-covered-vicinal-offcut.webp)
![Figure 5. SH rotation plots for native-oxide-covered vicinal Si(111). Left panels: 5equation (◦ offcut towards[112¯]; smoothed data generated from the Fourier coefficients of reference [6]](https://thumb-us.123doks.com/thumbv2/123dok_us/8812367.919031/11.595.111.469.82.506/figure-rotation-equation-smoothed-generated-fourier-coefcients-reference.webp)
