AN ALGORITHM ABOUT PARTNER SELECTION PROBLEM
ON CLOUD SERVICE PROVIDER BASED ON GENETIC
1KANG YANFANG, 2NIE GUIHUA
1Wuhan university Of Technology, School of economics, Wuhan Hubei, 430070,China
2 Wuhan university Of Technology, School of economics, Wuhan Hubei,430070,China
Email : [email protected],[email protected]
ABSTRACT
Aiming at choosing suitable cloud service providers to construct a dynamic alliance and then satisfying
terminal customers more efficiently, to achieve the optimal allocation of cloud services. This paper uses
gray relative comprehensive evaluation model to determine the optimizing index of cloud services market.
We use the multi-objective optimization model to study partner selection problem quantificational and
explain the model by genetic algorithm. Selected the provider in the cloud computing market to offer the
computing services, storage services, software services as a research object, extract the cost, response time,
quality of service as a research indicators. Multi-objective planning was changed into a single objective by
weight, the model is to be solved by genetic algorithm .Though the best fitness value, the provider find the
partners with the interests of the various cloud service providers. Finally, an example show that the
algorithm is rational to solve the problem about finding the best cloud service provider partners, and it is
the validity of the model and algorithm.
Keywords: Cloud Service Provider, Cloud Computing, Partners Selection, Grey Relational
Analysis,Genetic Algorithm, Multi-Objective Optimization
1. INTRODUCTION
Cloud computing is one of the popular,
fashionable words nowadays. Under the form of
global economic integration, the problem of how
to reduce the operating costs in IT enterprise
continuously growing. Cloud computing as the
emerging commercial calculation model, in the
model the computing service task is to be
distributed in the calculation of server resource
pool through the network. The storage service,
computing services, software and infrastructure
services is to be accessed on-demand according to
various application systems on the Internet. In this
context, the cloud service provider was born.
Cloud service providers, just as its name implies,
is the enterprise for provide service to the end user,
through the new business model such as the cloud
computing. As the more and more cloud service
providers to enter the market, how to choose the
suitable cloud service providers as the partners is
to cause our attention.
The cloud service providers obtain
complementary information resources, in order to
highlight its advantages in the market, will form a
partnership combined with their cloud service
providers owned the same interests. Based on the
cloud services market has its own special service
mode. When select the cloud service provider
226 of rapid elasticity, on-demand self-service, broad
network access, shared resource pool, measurable
service. Therefore, The partner selection problem
on cloud services market attract much attention
from over the world. As the survivors of cloud
services market in the network environment, in
order to form the desired purpose of the economic
cooperation, to form a good partnership, and at the
same time to form the optimal allocation of
resources in the cloud services market, besides
there is the competitive ability of the cloud service
provider and the compatibility between the cloud
service partners. Above all the factors influence
the criteria of the partner selection. So the difficult
point of this paper is determine the reasonable
optimization index and eliminate the interference
in the process of information choice in the cloud
services partner selection problem.
The problem of partner selection in dynamic
alliance,it has attracted the interested of a few
scholars to study in different areas at home and
abroad. Camarinha-Matos, Cardoso [1] proposed
the basic framework of the virtual enterprise
partner selection and descript its function in detail.
Zhan Su, Poulin d. [2], in the basis of qualitative
analysis, puts forward some principles on the
management of the relationships between partners.
T. Srinivas and R. C. Baker [3] raise the model
about the two stage partner selection process, and
it is considered that the large amounts of
quantitative factors and overlooked some
qualitative factors in them odel. Korho - nen P [4]
research in the field of information management
system, he make the In-depth analysis on the
partner selection of virtual enterprise.
MarcoFischer, Hendrik Jahn, Tobias Teich [5]
discussed the virtual enterprise partner selection
problem in production networks based on the ant
colony optimization theory. W H Ip, Min Huang,
Yung K L, Dingwei Wang [6] studied the
enterprise partner selection of the engineering
project problem in the virtual environment. And
the above research rarely involve the allocation
problem of resources optimization in the cloud
services market, the index selection about the
optimized allocation of cloud services resources,
and the specific optimization strategy on
implementation. The overall goal of the paper is
the optimized allocation rate for the cloud
resources, based on the comprehensive evaluation
model of grey correlation analysis to select the
corresponding optimization index, solve
multi-objective programming problem to find the
best partner of cloud services by the way of using
genetic algorithm, and finally to verify the
effectiveness and rationality of the algorithm and
the model by the case.
2. THE PROBLEM AND THE MODEL
2.1 The Problem Description
The partner selection problem about the
dynamic alliance of the cloud service providers: In
order to select the cloud service provider partners,
to form the dynamic alliance, and to build the
corresponding index system of dynamic alliance.
This article assumes that the overall goal of
dynamic alliance is to achieve the optimal
allocation of the cloud services market resources,
and to improve the economic utility of resources.
It select the optimized index by the
comprehensive evaluation model of grey
correlation analysis [7] [8]. The following is
evaluated and analyzed:
It should set the reference sequence
0( )
x k ,which is the factor sequence about the
optimized allocation rate for cloud service
resources. The x k is the compare sequence that i( )
is index factor under optimization. Among them
1, 2,...,
change point of the target sequence. Based on the
theory of the grey relational analysis, it has
established the following formula: (1)
0 0
0
0 0
minmin | ( ) ( ) | maxmax | ( ) ( ) | ( ( ), ( ))
| ( ) ( ) | maxmax | ( ) ( ) |
i i
l k i k
i
i i k i
x k x k x k x k
X k X k
x k x k x k x k
ρ ξ
ρ
− + ⋅ −
=
− + ⋅ −
0
(X k X k( ), i( ))
ξ is the grey relational coefficient
about the rate of the cloud service resources
optimized allocation.
(2)
0 0
1
1
( ( ), ( )) ( ( ) ( ))
n
i i
k
X k X k r X k X k
n
ξ
=
=
∑
−The
0
(X k X k( ), i( ))
ξ is the index factor of the
Service for optimization and the correlation about
the rate of the cloud service resources optimized
allocation. It embodies the influence measure
about the optimal allocation of resources of the
index factor.
(3)
0 0
0 1
( , )
( , )
( , )
i
i N
i i
X X
X X
X X
ξ δ
ξ
=
=
∑
The
0 (X ,Xi)
δ is the relative weight measure
of the optimization allocation rate for the cloud
service resources owned by the index factor about
the optimized service. It reflects the relative
importance of the index attribute belong to the
optimized allocation of resources.
Through the above theoretical analysis, It can
determine the top three optimization index factor
measured by the relative weights according to the
above formula (3).That is (1) the cost factor
provided by the required service, (2) the factor of
the reaction time required by the service, (3) the
attributes factors of the service quality. So the
optimization goal of this article is the service costs
(C) generated by the each cloud service providers
in alliance, including the new software service for
the establishment of the dynamic alliance (saas),
the platform services (paas), the infrastructure
services (Iaas) the need to cost. The required
reaction time (T) generated when the cloud
service’s provider jointly offer the service to the
terminal customer in the dynamic alliance. The
service quality (Q) provided by cloud service’s
provider in the dynamic alliance.
So based on the demand of the above goal, the
following factors should be considered as the
cloud service providers: the cost of service, the
service response time, and the quality of service.
These factors can be expressed in objective
function. So if chosen the cloud service provider
partners, the purpose is to optimize the objective
function, and makes the dynamic alliance group is
more competitive, and it can bring more benefits
to members of the alliance, so we think it is the
multi-objective optimization problems to select the
proper cloud service providers.
The partner selection problem about cloud
service providers can be described as: Assuming
that the core of dynamic alliance should provide
service to the terminal users of n .To the special
task, there are m cloud service providers to offer
services to customers, so our optimization goal is
to complete each task with selecting the best
suitable partner, the problem can be described as
the following:
The task
w
={ } [ ,
w
r=
w w w
1 2,
3,...,
w
n]
,r=1,2,…,n
For the task there is candidate partners as follows:
1 2
{
} {
,
,...,
}
r rj r r rm
p
=
p
=
p
p
p
, j=1,2,…,mThe candidate partners
p
rj=
[
c t q
rj, ,
rj rj]
represent the cost, response time and quality.
2.2 Establish The Mathematical Model
Start with the basic model of multi-objective
optimization [9] :
1 2
m i n [ ( ) , ( ) ,. . . , n( ) ] G( x)= g x g x g x
. . r( ) 0
228
Among them: fr( x ) ---c o n s tr a i n t c o n d itio n;
gr(x)---objective functionFor the partner
selection problem of the cloud service providers,
in order to guarantee the effectiveness of choosing
the partners, the following objective function that
the dynamic alliance is composed of to be met.
(1) Define the 0-1 variables:
rj
if choose the p 1
0 otherwise
={
r jθ
stand for the task r completed by the candidate partners j
rjp
Among
= 1
= 1 = 1, 2 ,3 ...m
n
r j r
j
θ
∑
(2) define the objective function
According to the problems described above,
the selected service cost, response time and service
quality as the three objective function:
Objective function 1: in the dynamic alliance, the
minimum cost C of partner candidates for cloud
service: minC(the price of CP (cloud provider
r for service j) .
Minimize obj-1=
1 1
n m
rj rj
j r
C
θ
= =
∑∑
Objective function 2: in the dynamic alliance,
the minimum response time T of partner
candidates for cloud service: MinT:
Minimize obj-2=
=1 =1
n m
rj rj
j r
T
θ
∑ ∑
Objective function 3: in the dynamic alliance,
the best quality Q of partner candidates for cloud
service: maxQ:
Maximize obj-3=
=1 =1
n m
rj rj
j r
q
θ
∑∑
(3) The solution of the multi-objective
optimization model:
For the multi-objective optimization problems,
the multi-objective optimization function can be
converted into the single objective optimization
function, so the following objectives can be used
for this form:
Minimize
g
(x)
=w C w T w Q
1+
2-
3k
w
is stand for the weight. It determines theemphasis on the composition of each attribute in
the dynamic alliance. 3
=1 =1 k k
w
∑
(4) The constraint conditions:
One partner is chosen at least by only one
cloud service providers.
3. THE APPLICATION OF ANALYSIS
3.1 The Background Of The Case
It should be considered in the dynamic
alliance that the cloud service provider will
provide the following three services: the
computing services (computing), the storage
services (storage), the software, services to the
terminal customer and the number of candidate
partners is 3, 3, 5.The related data attributes of the
candidate partners is seen in table 1: The cloud
service provider that provide the above three kinds
of services cloud services is named
A
1,2,3,B
1,2,3,1,2,3,4,5
C
. The task is to find the best cloud serviceprovider candidate that completed the above task
cooperation. The Specific data can be seen after
the article in the appendix table1.
3.2.To Solve The Model
3.2.1 Determine the weighting factor
i=1,2,3…n.To determine the weighting factor [11]
should follow some certain principles: (1) the
principle of usability, (2) the principle of
maneuverability, (3) the principle of objectivity, (4)
the principle of comparability, (5) the principle of
comprehensive.
Set X={X1,X2,…Xm} as the research object . It
is the selected cloud service provider,
1 2 n
G ={G ,G ,...,G }
, For the indicators of eachobject to measure.
W
=
{
W W
1,
2,...,
W
n}
T for theindex weight vector.
1
1
n
j j
W
=
=
∑
.0,(
1, 2,..., ).
j
W
≥
j
=
n
A
=
[
a
rj m n]
× arj standfor the object of study. That is to say the value that
the cloud service providers Xr to the index Gj,
because the counting dimension of each indicator
is different, so we should standard the decision
matrix, The decision-making matrix A is been
standardized [12].
In order to determine the weight of each index, it
create the following models:
1 2
max
Z
=
( ,
Z Z
,...,
Z
m)
s.t.
1
1
n
j j
W
=
=
∑
W
j≥
0,(
j
=
1, 2,..., ).
n
among
*
* =1
-=
1+
-n
j rj j
r
j j rj j
a a w
z
a a w
∑
,a
*j is the "Idealvalue" of Gj..In practice,
*
j
a
=max{a1j,a2j,…amj}.Themeaning of Zr is the distance between the research
object
{
1 1,
2 2,...,
}
r r r rn rn
X
=
a w a w
a w
and theideal solution
* * * *
1 1 2 2
{
,
,...,
}
r r r rn rn
X
=
a w a
w
a
w
. Find aweight vector, makes the Z1,Z2,... ,Zn maximum.
The aim is to distinguish the research object
largely and to find the optimal solution clearly.
Adopt the method of linear solutions for the
above model:
* n
r *
r=1 =1
-max
=
z =
1+
-n
j rj j
j j rj j
a a
w
Z
a a
w
∑
∑
’
s.t.
1
1
n
j j
W
=
=
∑
W
j≥
0,(
j
=
1, 2,..., ).
n
By the above model, we get the conclusion
that
W
=
{ ,
W W
1 2,...
W
n}
.3.2.2. The quantitative process of qualitative
indicators about the quality of service
(Qos)
(1) The availability: The ability that the cloud services provided under the prescribed
conditions and the constraint time can be accessed by the user successfully; you can use
the following formula to express:
N
A
QoS
avaliabity=
/
Among them A for the number of services
provided that successful visited, N for the
number of total visits by the customers.
(2)The reliability: The ability that the
application services offered stable by the cloud
service providers. It can be represented by the
following formula:
QoS
reliability=
R
/
M
,, R forthe number that the service implemented
successful, M for the total number that the service
called[13].
(3)The scalability: The ability that dynamic
scaling with the needs cloud service, it can be
230 k
RS QoS
k
i i
scalabilty
∑
=
= 1 ,, K for the total number of
required service, RSi for the success of the service
call [14]. If successful, then
RS
i=
1
,then0
iRS
=
.(4) The integration: The ability that the cloud
services can be provided by the system which can
perform well with the applications systems belong
to the enterprise customers, with an average score
of the user said,
1 int egration
n
i i
AS
QoS
n
=
=
∑
.Although the score that asingle user ratings is subjectivity, but when the
number of users is large, the average score is
credible,
AS
irepresents a single user i ratings, nrepresents the general users [15].
3.2.3. The cost details
The specific cost details of the flow can be
seen in the appendix table 2,after the paper.
3.2.4 The problem about computing the quality
of service(Qos)
According to section 3.2.1, it can determine
the weighting
factor on: The weight of the service quality of
sub-layer:
1
=0.31,
2=0.27,
3=0.22,
4=0.20
ω
ω
ω
ω
1 2 3
=
+
+
value avaliabity reliability scalabilty
Qos
ω
QoS
ω
QoS
ω
QoS
The specific attribute value after the weighted Qos
can be seen in the appendix table 3.
3.2.5. The processing of data standardized
Because the different indicators is different in
dimension, it is indispensible to standard these
indicators. with X = {X1, X2,... Xn} for the raw
data, Y = {Y1, Y2,... Yn} for the processing data, minX to the lowest value of a set data, maxX to the largest value of a set data.
The process of Standardization:
min
max
min
i
i
X
X
Y
X
X
−
=
−
The normalized data can be seen in the table appendix
4.
4. THE GENETIC ALGORITHM
IMPLEMENTATION OF
MULTI-OBJECTIVE OPTIMIZATION
MODEL
4.1.The Process Of Based Genetic Algorithm
The basic steps of genetic algorithm are as
follows:
Step. The code. For the 0-1 integer
programming, the variables will involve only
adopt 0or1, it is directly coding with binary.
Step. The initial population generated. The
starting point of the optimization is initial
population generated. The size of the initial
population determines the initial search space. We
adopt the population size according the problem
size
N
=
10
. The initial population is randomlygenerated, to the cloud service providers (such as
computing services), its formula is as follows:
)
(
1round
rand
x
=
,)
*
)
1
((
1
1
rand
x
round
x
j
i i
j
∑
−
=
−
=
round
for integer,rand
for a random numbergenerated between[0,1].
Suppose that a individual coding is as follows:
It is said that we had chose the third provider of
computing services, the third provider of storage
service and the first provider of software provider.
Step. Calculate the fitness. After the data
standardized to the section [0,1]. The scope of the
objective function is
g
(
x
)
≤
3
, So the moderatefunction is taken by
fitness
(
x
)
=
−
g
(
x
)
+
c
,3
f
c
.In practice, the value isc
=
5
.Step. The choice. The choice is to ensure ④
that the best individual of the cloud service
providers can insert into the next generation of
new groups. Here we adopt the roulette method
and the method of the optimal retention. The
roulette method is calculated according to
accumulate the fitness of individual, we can use
the formula is expressed as:
∑
=
i i i
fitness
fitness
fit
The Molecules for theindividual's fitness, the denominator for the sum of
the fitness to the whole population. The random
number is generated by the random population size.
If
fit
i−1≤
rand
≤
fit
i, The individual of i ischosen to participate in the genetic operation. The
optimum reserved strategy is to save the
corresponding individual in the current optimal
solution that is not to participate in the next
genetic operation, after the other individuals to
participate in the genetic operation, with the
individual instead of the individuals with the
lowest fitness at this time. It can ensure that the
number of individuals in the process of population
evolution is more and more.
Step. The crossover and The mutation. For ⑤
the problem of the cloud service provider selection,
in order to satisfy the constraint conditions, and we
adopted a strategy of overall cross between
partitions. It will be generated randomly the three
numbers within the scope of [1,11], then the task is
to see which range [1, 3], [4, 6], [7,11]the three
data fall into, to identify the part of the crossover
operation to be done. The probability of crossover
9
.
0
=
P
, The variation is a multipoint mutation,we also adopted the three random number
generated between [1, 11]. According to the scope
of data, we identity the code that need to change.
The probability of mutation is set according to the
ideas of the simulated annealing algorithm. In the
early evolution, the probability of mutation is
small. Along with the unceasing evolution, the
probability of mutation is gradually increase.
Step. Repetitive execution. ⑥
Step.③--
Step.⑤Until the termination conditions is
satisfy, The termination condition is that the
number of iterations is less than the maximum
number of iterations. Here is the number of
iterations
T
=
50
.4.2The Analysis About The Result
According to the model, we solve the
problem with the Mat lab programming. The
232
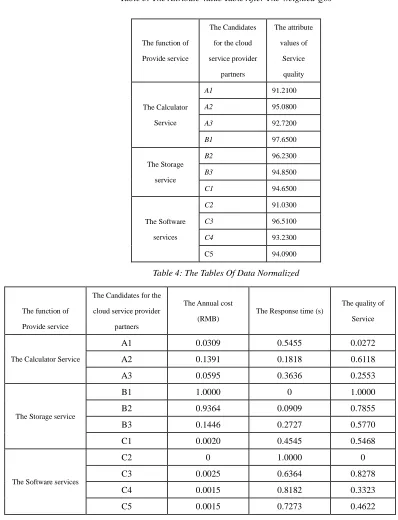
1 2 3 4 5 6 7 8 9 10 0.2 0.3 0.4 0.5 0.6 0.7 0.8 0.9 1 1.1 1.2
The Initial population
T h e v a lu e o f t h e o b je c ti v e f u n c ti o n
[image:8.612.89.523.67.290.2]The distribution of the initial population
Figure 1: The Initial Population Distribution Figure 2: The Diagram Of Fitness And The Number Of Iterations
1 2 3 4 5 6 7 8 9 10
0.1 0.2 0.3 0.4 0.5 0.6 0.7 0.8 0.9
The number of iterations N = 20
T h e v a lu e o f t h e o b je c t iv e f u n c t io n
The distribution of the fitness iterated of N times
Figure 3: The Function Value Distribution Of Iteration
2 0 T i m e s
0 5 10 15 20 25 30 35 40 45 50
0.16 0.17 0.18 0.19 0.2 0.21 0.22
The number of iterations N = 50
T h e o p ti m a l so lu ti o n
[image:8.612.93.242.320.490.2]The change of the optimal solution iterated of N times
Figure 4:The Distribution Of the Fitness Iterated 20
Times
Figure 6: The Average Value Variation Of The Objective Function
1 2 3 4 5 6 7 8 9 10 4 4.1 4.2 4.3 4.4 4.5 4.6 4.7 4.8 4.9 5
The number of iterations N = 20
T h e d is tri b u ti o n o f th e f it n e s s
The distribution of the fitness iterative of N times
0 5 10 15 20 25 30 35 40 45 50 4.78 4.79 4.8 4.81 4.82 4.83 4.84
The number of iterations
T h e f it n e s s
The relationship between the fitness and the number of iterations
0 5 1 0 1 5 2 0 2 5 3 0 3 5 4 0 4 5 5 0 0 . 1
0 . 2 0 . 3 0 . 4 0 . 5 0 . 6 0 . 7 0 . 8 0 . 9
T h e a v e ra g e v a lu e o f t h e ta rg e t o b je c t iv e fu n c tio n
T h e a v e ra g e v a lu e o f th e t a rg e t o b je c ti v e f u n c ti o n
[image:8.612.320.547.340.505.2]T h e c h a n g e o f th e a v e ra g e ta rg e t f u n c tio n ite ra te d o f N tim e s
Figure 5: The Average Value Distribution And The
[image:8.612.95.536.526.711.2]Optimal Iterated After 50 Times
According to the section 3.2.1,we determine
the factor weights W1=0.9,W2=0.9,W3=0.05. The
best fitness value of the multi-objective
optimization can be seen from the figure 2 is
4.8387, so as to get the partner selection results of
the best optimization: The computing service A1,
The storage services providers B1, The software
services providers C2, That is to say the best
combination of dynamic alliance is (A1, B1, C2).
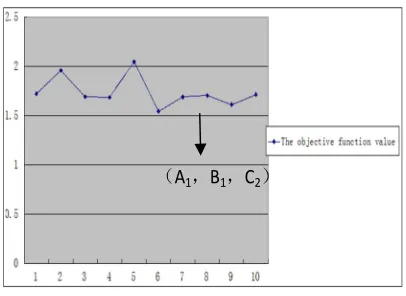
We randomly select the objective function value
belong to any group of 10 service group to
compare with the best cloud service providers (A1,
[image:9.612.89.292.322.470.2]B1, C2), The results are shown in figure 7 below:
Figure 7: The Comparison Chart Of The Best
Service Composition
It can be seen from the above, that the
minimum value of the objective function is the
best service group(A1, B1, C2) ,corresponding to
the rest randomly selected 10 service groups. Thus
it can show that (A1, B1, C2) is one of the best group in this paper.
5. CONCLUSION
The dynamic alliance partner selection of
cloud service providers is an important and
complex process. It is the key that we choose the
suitable and competitive partner in the dynamic
alliance, and optimize the cloud services resource,
and it has very important theoretical and realistic
significance. This paper proposes a method of
cloud service providers to choose partners. We
adopt the multi-objective optimization model, and
consider the multiple factors affecting cloud
service providers, use the genetic algorithm, to
find the best fitness value, finally it find out the
best cloud services combination plan. Through the
experimental results show that the validity and
practicability of the method. In this paper, it put
forward the exploratory model for choosing the
best partner of the cloud service providers in
dynamic alliance. The model provide empirical
research foundation for this study.
ACKNOWLEDGEMENT
Fund project: The national natural science
fund projects (71172043 & 71072077); National
science and technology support
(2012BAH93F04&2013BAH13F01); The
Fundamental Research Funds for the central
university (2013-YB – 017 ).
REFERENCES
[1] L.M.Camarinha-Matos, “A fsarmanesh H.
Selection of partners for a virtual enterprise”.
Infrastructure for virtual enterprises :
networking industrial enterprises. Boston
(London):Kluwer Academic Publishers,
1999.PP.259- 278.
[2] S. Zhan, D. Poulin, “Partnership management
within the virtual enterprise in a network”,
International Conference on Engineering
Management and
Control(IEMC) ,August,1996,PP.645-650.
[3] S. Talluri, R. C. Baker, “A quantitative
framework for designing efficient business
process alliances”, Engineering and
Technology Management, August,1996,
PP.656-661.
[4] P. Korhonen,K. Huttunen,E. Eloranta,
Demand chain management in global
(A
234
enterprise-information management view.
Production Planning. Vol. 28,
No.7,1990,PP.1247-1296.
[5] F. Marco, J. Hendrix, T. Tobias, Optimizing the
selection of partners in production network.
Robotics and Computer-Integrated
Manufacturing,Vol.20, No. 6,2004,PP.593-601. [6]W.H.lp,K.L.Yung, D.W.Wang, A branch and
bound algorithm for sub-contractor selection in
agile manufacturing environment,International
Journal of Production Economics,Vol.2,No. 87,
2004, PP.195-205.
[7] J. Li, Y.C. Li, L. Ren, The algorithm on select
and evaluate suppliers by grey relational
theory,Journal of computer applications and
software, Vol.21, No.8,2004, PP.90-93.
[8] B. Su, L. Liu, F.T. Yang, The model of the
neural network based on grey correlation
analysis , Journal of systems engineering
theory and practice, NO.9,2008, PP.98-104. [9] W.B. Tu, L.X Zhang., Z.T. Fu ,The health
evaluation index selection model based on
multi-objective programming in rural
ecosystem, Journal of systems engineering
theory and practice, Vol.10, No.10,2012, PP.2229-2236.
[10] J. Yang, A research on virtual enterprise
partner selection based on group decision
model, Journal of statistics and decision,
NO.16,2011,PP.42-44.
[11] X.J. Liu, R.F. Zhang, A method of
determining the weight on multi-objective
decision-making,Journal of shanxi teachers
university (natural science edition),Vol.16,No.
09,2002,PP.20-22.
[12]Amazon Elastic Compute Cloud (Amazon
EC2)[OL].http://aws.amazon.com/ec2,2012
[13]W.Zhou, J.H.Wen, M.Gao, etal, A QoS
preference-based algorithm for service
composition in service-oriented network,Optik
- International Journal for Light and Electron Optics, Vol.124,No. 20,2013,PP.4439-4444.
[14]S.J.Qin, Y. Chen, X.W. Mu, An Optimal
Service Selection with Constraints Based on
QoS , Physics Procedia, Vol.25,2012,
PP.2050-2057.
[15] M.K. Jong, O.K. Chang, I.H.
Kwon,Quality-of-service oriented web
service composition algorithm and Planning
architecture. Journal of systems and Software,
APPENDIX:
Table 1: The Related Data Of The Candidate Partners [10]
(The source: the above data are for amazon,google,salesforce,Microsoft,oracle,xtools, The cloud of the West lake, sina. )
Table 2: The Table Of Calculating The Flow Cost The function of
Provide the
service
The Candidates for
the cloud service
provider partners
Annual
cost
(RMB)
Response time (s)
The quality of Service (Qos)
Availability
(%)
Reliability
(%)
Integration
(%)
scalability
(%)
The Computing
services
A1 7415.04 9 92 93 89 90
A2 8000 5 95 93 96 97
A3 8002.26 7 94 94 90 92
The Storage
service
B1 6136.32 3 98 99 97 96
B2 8149.12 4 97 98 95 94
B3 8688.46 6 96 95 92 96
The Software
services
C1 7800 8 95 96 94 93
C2 5280 14 93 92 88 90
C3 6400 10 96 97 98 95
C4 7200 12 94 95 92 91
C5 5460 11 95 94 93 94
The flow The cost
First a GB/month C1 Per GB
Next b GB/month C2 Per GB
Next c GB/month C3 Per GB
236
Table 3: The Attribute Value Table After The Weighted Qos
Table 4: The Tables Of Data Normalized
The function of
Provide service
The Candidates for the
cloud service provider
partners
The Annual cost
(RMB)
The Response time (s)
The quality of
Service
The Calculator Service
A1 0.0309 0.5455 0.0272
A2 0.1391 0.1818 0.6118
A3 0.0595 0.3636 0.2553
The Storage service
B1 1.0000 0 1.0000
B2 0.9364 0.0909 0.7855
B3 0.1446 0.2727 0.5770
C1 0.0020 0.4545 0.5468
The Software services
C2 0 1.0000 0
C3 0.0025 0.6364 0.8278
C4 0.0015 0.8182 0.3323
C5 0.0015 0.7273 0.4622
The function of
Provide service
The Candidates
for the cloud
service provider
partners
The attribute
values of
Service
quality
The Calculator
Service
A1 91.2100
A2 95.0800
A3 92.7200
B1 97.6500
The Storage
service
B2 96.2300
B3 94.8500
C1 94.6500
The Software
services
C2 91.0300
C3 96.5100
C4 93.2300
![Table 1: The Related Data Of The Candidate Partners [10]](https://thumb-us.123doks.com/thumbv2/123dok_us/8913488.960532/11.612.85.529.71.357/table-related-data-candidate-partners.webp)