www.ijraset.com Vol. 2 Issue VI, June 2014 ISSN: 2321-9653
I N T E R N A T I O N A L J O U R N A L F O R R E S E A R C H I N A P P L I E D S C I E N C E
AN D E N G I N E E R I N G T E C H N O L O G Y (I J R A S E T)
Page 383
Comparative Study on Email Spam
Classifier Using Feature Selection Techniques
Yukti Kesharwani, Shrikant Lade,Dayashakar Pandey
M.Tech. Scholor,H.O.D. of IT Deptt.,Asst.Prof. in I.T. Deptt. R.K.D.F College,R.K.D.F. College,RKDF College
Mandideep Road Bhopal,(M.P.)
Abstract— Now a days e-mail is very popular because the way of communication method is very easy and due to these reasons some advertisers and social networks sent messages,for advertising their product,that are unwanted for users and not requested by the users, these messages are called spam messages. Sometimes these spam messages are harmful for system after clicking the link which is sent by the spammer or advertisement companies. It takes lots of time for deleting and also occupy memory for storage. Due to these we need filtering the messages and this is the important task for separating the genuine messages from the junk messages. Even though number of researchers are uses different classification techniques for classify the spam, still 100% accuracy in spam classification are question mark, In this paper, we used spam data set which are collected from UCI repository. Initially, various classification algorithms are applied over this dataset using CLEMENTINE data mining tool. This data set is divided into two parts one is training data set and the other one is testing data set. After that most of the data is used for training and a smaller portion of the data is used for testing. After a model has been processed by using the training set, we test the model and identify the results. This process is done by different data set. Finally, best classifier for email spam i.e neural network is identified based on the Training and testing accuracy of various models. In this thesis we also use feature selection method selecting features of spam data set which removes the redundant , irrelevant and noisy data. It improves the data quality and also increase the accuracy of the resulting models.
Keywords—classifier, e-mail , spam , spam filters , datamining tool, feature selection techniques .
I. INTRODUCTION
Email has become an easy method to communicate with each other,because of its fast,effective and cheap communication way.This enables internet user to easily exchange their information from anywhere in the world.Nowadays it has widely adopted by both individuals and organizations and they faced with spam problem due to the increasing popularity of email. These email spam, also known as junk email or unsolicited bulk email (UBE), and it becomes more and more serious.Email spam has grown in the past few years. E-mail Spam is not requested by any internet users,it is send by spammer which are collected from different source like chatrooms,websites,customer list etc. and also they sold to other spammers.When network of virus infected computers,
are used then it send about 80% of spam.Spam email may also include malware , refers to software programs designed to damage or do other unwanted actions on a computer system when user clicking on the spam the malware silently get installed on the system. Therefore,classification of email is an important task to automatically classify original emails from spam emails using filtering technique.A filtering technique is an important reaserch area to detect unsolicited and unwanted email and prevent computer system from spam messages.
on various classification algorithm( i.e CART,QUEST,ANN,CHAID and SVM).After a model has been processed by using the training dataset a smaller portion of the testing dataset is used for testing the accuracy of various classification model and identify the best results.This process is done by different datasets and performed in no. of times until the best classifier for email spam is identified based on the accuracy.
The rest of this paper is organized as follows. Section 2 presents Related works on e-mail spam classification, section 3 presents Framework implementation of the proposed sysem, section 4 presents Study on classification algorithms , section 5 presents Experimental Results and Performance Evaluation, Finally section 6 presents conclusion.
II. RELATED WORK
Several attempts in the literature have been suggested for solving the problem of the
spam:-Nowadays e-mail spam problem is increasingly rapidly.These spam mails create many problems such as time and effort to deleting it after it is received,filling mailboxes,damaging financial information like bank account,spreading malware etc. In [1], the clustering of spammers considering them in groups is offered. A novel distributed data mining approach, called Symbiotic Data Mining (SDM) [2] that unifies Content-Based Filtering (CBF) with Collaborative Filtering (CF) is described. Paper [3] analyzes the computational complexity and scalability of the algorithm, and tests its performance on a number of data sets from various application domains. In [4], a neural network (NN) approach is applied to the classification of spam. They found out which NN configuration will have the best performance and least error to desired output. They considered that NN which was trained using 57 email parameters produced the lowest number of misclassifications.James Clark [5] proposed a neural network system meant for automated e-mail classification. He also presented an email classification NN-based system used for automated e-mail categorization problem. Kolter and Maloof [6] Malicious executable were detected by the use of data mining and n-gram analysis, sequences of bytes was extracted from the executable, and then is been transformed in to n-grams which are then treated as features. An anti-spam filtering technique was presented by [7]; His techniques are centered on artificial neural network (ANN) and Bayesian Networks. Algorithm that was created by levent is meant for
www.ijraset.com Vol. 2 Issue VI, June 2014 ISSN: 2321-9653
I N T E R N A T I O N A L J O U R N A L F O R R E S E A R C H I N A P P L I E D S C I E N C E
AN D E N G I N E E R I N G T E C H N O L O G Y (I J R A S E T)
Page 385 scoring measure was defined to express the degree of approximation of the FSA solution to the real solution. The final outcome of the experiments can be seen as an illustrative step towards gaining useful knowledge that enables to decide which algorithm to use in certain situations[29]. [30] deals with concrete spam filters and e-mail corpus, Analysis of Bayesian networks has provided a good basis for the creation of a meta spam filter. At the moment anti-spam filtering software seems to be the most viable solution to spam problem. Spam filtering methods are often classified as collaborative or content-based [32].
Regardless of the selected learning strategy, in order to train and test contentbased filters it is necessary to build a large corpus with spam and legitimate e-mails or use a publicly available corpus. Anyway, e-mails have to be preprocessed to extract their words (features) belonging to the message subject, the body and/or the attachments.
Also, since the number of features in a corpus can end up being very high, it is common to choose those features that better represent each message before carrying out the filter training to prevent the classifiers from over-fitting [33].
III. PROPOSED SYSTEM
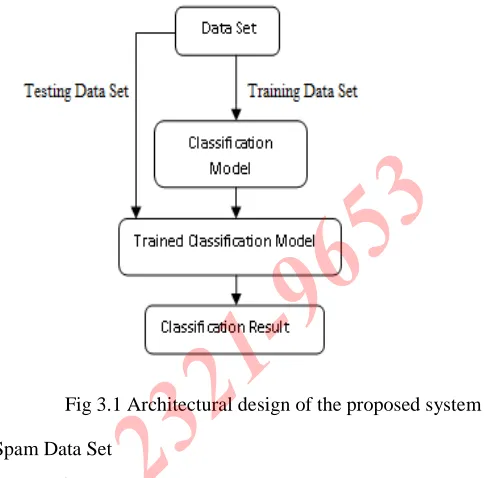
[image:4.612.298.542.110.349.2]Fig 3.1 illustrates the working of classification model for classification of data. First of all we collect the dataset from UCI repository.Then dataset is applied on classification model i.e Neural Network, Support Vector Machine, CHAID,QUEST and CART. Initially, the data set is divided into two parts one is training data set and the other one is testing data set. After that most of the data is used for training and a smaller portion of the data is used for testing. We then apply each classifier to construct a model from most of the data set and test it on the remaining partition of the data set. After that we identify the best result of the classification algorithm based on the accuracy and performance.
Fig 3.1 Architectural design of the proposed system
Spam Data Set
Spam dataset is a collection of spam and non-spam message. These dataset are collected from UCI repositoryand suitable for use in testing spam filtering system. This dataset contains 4601 instances and 58 attributes (57continuous input attribute and 1 nominal class label target attribute).
Training and Testing Data Set
In a dataset a training set is implemented to build up a model, while a test (or validation) set is to validate the model built. Data points in the training set are excluded from the test (validation) set .Usually a dataset is divided into a training set and validation set(test set) in each iteration[37].
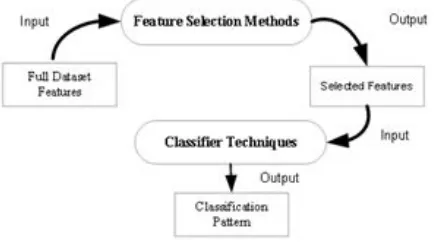
Feature Selection
After analyse the result of the best algorithm, based on the accuracy then we applied feature selection technique on that algorithm.
main advantages for using feature selection algorithms are the facts that it reduces the dimension of our data, it makes the training faster and it can improve accuracy by removing noisy features. As a consequence feature selection can help us to avoid overfitting.[35].
Fig 3.2 Feature Selection for Classification
IV. CLASSIFICATION MODEL
Biological neural network
It is estimated that the human brain contains over 100 billion neurons and synapsesin the human nervous system. Studies of brain anatomy of the neurons indicate more than 1000 synapses on the input and output of each neuron. Note that, although the neuron's switch time (a few miliseconds) is about a millionfold times slower than current computer elements, they have a thousandfold greater connectivity than today's supercomputers.
The main objective of biological-type neural nets is to develope a synthetic element for verifying hypotheses concerning biological systems.
[image:5.612.51.268.183.307.2]Neurons and the interconnections synapsesconstitute the key elements for neural information processing. See this figure.
Fig. 4.1 A biological neuron
Most neurons possess tree-like structures called dendrites wich receive income signals from other neurons across junction called synapses. Some neurons communicate with only a few nerby ones, whereas others make contact with thousands.
There are three parts in a neuron:
1. a neuron cell body,
2. branching extensions called dendrites for receiving input, and
3. an axon that carries the neuron's output to the dendrites of other neurons.
How two or more neurons interact is not already well known, is different for different neurons. Generally speaking, a neuron sends its output to other neurons via its axon. An axon carries information through a series of action potentials, or waves of current, that depends on the neuron's potential. This process is often modeled as a propagation rule represented by a net value u(.).
www.ijraset.com
I N T E R N A T I O N A L J O U R N
AN D E N G IN E E
threshold, in the general case the neuron value is given by an activation function f(.)[38].
Artificial Neural Network
Artificial neurons (or processing elements
simplified models of biological neurons. As in biological neurons, an artificial neuron has a number of inputs, a cell body(most often consisting of the summing node and the transfer function ), and an output which can be connected to number of other artificial neurons. Artificial neural network are densely interconnected networks of PEs,
rule(learning rule) to adjust the strength of the connections between the units in response to externally supplied data.
The evolution of neural network as a new computational model originates from the pioneering work of McCulloch and Pitts in 1943. They suggested a simple model of a neu
[image:6.612.325.511.117.268.2]commuted the weighted sum of the inputs to the neuron and an output of 1 or 0, according to whether the sum was over a threshold value or not. A 0 output would correspond to the inhibitory state of the neuron, while a 1 output would correspond to the excitatory state of the neuron
Fig 4.2 Artificial Neural Networks
Support Vector Machine
Support vector machine (SVM) are a set of related supervised learning methods that analyze data and recognize patterns ,used for classification and regression analysis. The original
SVM algorithm was invented by vladimir vapnik and the current standard incarnation(soft margin) was Vladimir vapnik.
Vol. 2 Issue VI,
ISSN: 2
N A L F O R R E S E A R C H I N A P P L I E
E R I N G T E C H N O L O GY (I J R A S E T
threshold, in the general case the neuron value is given by an
,PE)are highly al neurons. As in biological ron has a number of inputs, a cell body(most often consisting of the summing node and the transfer function ), and an output which can be connected to a rons. Artificial neural network together with a the strength of the connections between the units in response to externally supplied data.
The evolution of neural network as a new computational model originates from the pioneering work of McCulloch and uggested a simple model of a neuron that commuted the weighted sum of the inputs to the neuron and an output of 1 or 0, according to whether the sum was over a threshold value or not. A 0 output would correspond to the f the neuron, while a 1 output would
[25].
Artificial Neural Networks
Support vector machine (SVM) are a set of related supervised learning methods that analyze data and recognize patterns ,used for classification and regression analysis. The original
[image:6.612.51.260.395.565.2]SVM algorithm was invented by vladimir vapnik and the carnation(soft margin) was Vladimir
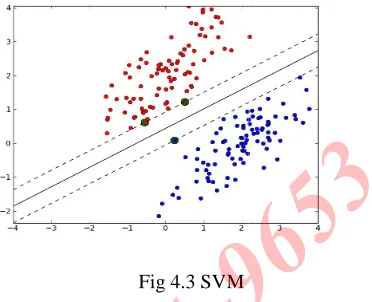
Fig 4.3 SVM
The standard SVM takes a set of input data and predicts, for each given input, which of two possible classes the input is a member of, which makes the SVM a non probabilistic binary linear classifier. Since an SVM is a classifier, then given a set of training examples, each marked as belonging to one of two categories, a SVM training algorithm builds a model that assigns new examples into one category or the other. Intuitively, an SVM model is a representation of the examples as point in space, mapped so that the examples of the separate categories are divided by a clear gap that is as wide as possible. New examples are then mapped into that same space and predicted to belong to category based on whic
gap they fall on[26].
CART
CART(Classification and Regression Tree)is one of the popular methods of building decision tree in the machine learning community. CART builds a binary decision tree by splitting the records at each node,according
single attribute.CART uses the gini index for determining the best split.CART follows the above principle of constructing the decision tree.We outline the method for the sake of completeness.
The initial split produces two nodes,each of
attempt to split in the same manner as the root node.Once again,we examine all the input fields to find the candidate splitters. If no split can be found that significantly decreases the diversity of a given node, we lable it as a leaf node. Eventually,only leaf nodes remain and we have grown the full decision tree. The full tree may generally not be the tree that does the best job of classifying a new set of records,because of overfitting.
ssue VI, June 2014
2321-9653
E D S C I E N C E
T)
The standard SVM takes a set of input data and predicts, for each given input, which of two possible classes the input is a member of, which makes the SVM a non probabilistic binary r. Since an SVM is a classifier, then given a set of training examples, each marked as belonging to one of two categories, a SVM training algorithm builds a model that assigns new examples into one category or the other. esentation of the examples as point in space, mapped so that the examples of the separate categories are divided by a clear gap that is as wide as possible. New examples are then mapped into that same space and predicted to belong to category based on which side of the
CART(Classification and Regression Tree)is one of the popular methods of building decision tree in the machine learning community. CART builds a binary decision tree by splitting the records at each node,according to a function of a single attribute.CART uses the gini index for determining the best split.CART follows the above principle of constructing the decision tree.We outline the method for the sake of
At the end of the tree-growing prosess,every record of the training set has been assigned to some leaf of the full decision tree. Each leaf can now be assigned a class and an error rate. The error rate of a leaf node is the percentage of incorrect classification at that node.The error rate of an entire decision tree is a weighted sum of the error ratesof all the leaves. Each leaves contribution to the total is the error rate at the leaf multiplied by the probability that a record will end up in there[25].
CHAID
CHAID, proposed by Kass in 1980, is a derivative if AID (Automatic Interaction Detection), proposed by Hartigan in 1975. CHAID attempts to stop growing the tree before overfitting occurs. In the standard manner, the decision tree is constructed by partitioning the data set into two or more subsets, based on the values of one of the non- class attributes. After the data set is partitioned according to the chosen attributes, each subset is considered for further partitioning using the same slgorithm. Each subset is partitioned without regard to any other subset. This process is repeated for each subset until some stopping criterion is met. In CHAID the number of subsets in partition can range from two up to the number of distinct values of the splitting attribute. In this regard, CHAID differs from CHART , which always forms binary splits, and from ID3 or C4.5, which forms a branch for every distinct value.
The splitting attribute is chosen as the one that is most significantly associated with the dependent attributes according to a chi-squared test is of independence in a contingency table(a cross-tabulation of the non-class and class attribute). The main stoping criterion used by such methods is the p-value from this chi-squared test. A small p-value indicates that the observed association between the splitting attribute and the dependent variable is unlikely to have occurred soley as the result of sampling variability.
If a splitting attribute has more than two possible values, then there may be a very large number of ways to partition the data set based on these values. A combinatorial search algorithm can be used to find a partition that has a small p-value for the chi-squared test. The p-values for each chi-squared test are adjusted for the multiplicity of partitions. A Bonferroni adjustment is used for the p-values computed from the contingency tables, relating the predictors to the dependent variable. The adjustment is conditional on the number of
branches(compound categories) in the partition , and thus does not take into account the fact that different numbers of branches are considered[25].
QUEST
QUEST is proposed by Loh and Shih (1997), and stands for Quick, Unbiased, Efficient, Statistical Tree[39].
It is a tree-structured classification algorithm that yields a binary decision tree. The QUEST tree growing process consists of the selection of a split predictor, selection of a split point for the selected predictor, and stopping[40]. QUEST [41] is a classification method. It avoids the selection bias and categorical variable computational problems of CART by first selecting the variable xi and then selecting its split point or split set. This saves a significant amount of computation, because the algorithm does not have to search for the split points or split sets of the other variables. QUEST uses hypothesis tests to choose the split variables, namely, analysis of variance F-tests for non-categorical variables and chi-squared tests for categorical variables. The variable with the smallest significance probability is selected to split a node. If the dataset has more than two classes, they are grouped into two superclasses prior to split point or split set selection[42].
V. EXPERIMENTAL RESULT AND
PERFORMANCE EVALUATION
A. Comaprative analysis of various Classification techniques for spam email
In this experiment, we have used data Pentium P-IV machine, 2 GB RAM, Microsoft window operating system and mining tools as Clementine for simulation. We have collected spam email data set from UCI- repository and this data set is applied on various classification techniques for classification of spam and non spam email data. We have used various classification techniques like CART,QUEST, ANN, CHAID and SVM as classier for classification of data as spam or non spam.
www.ijraset.com
I N T E R N A T I O N A L J O U R N
AN D E N G IN E E
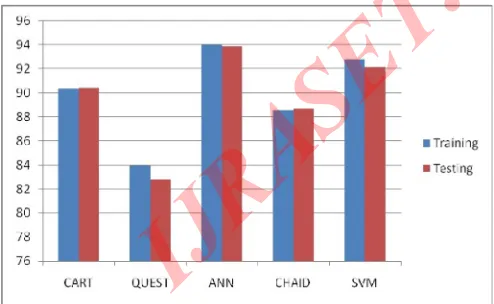
In first step, the data is partitioned into 75% as training and 25% as testing and training data is used for trained the model and testing data is used to test this trained model. In this piece of work we have applied different classification techniques like CART, QUEST, ANN, CHAID and SVM in spam email data set for classification of spam and non spam email. Table 5.1 shows that training and testing accuracy of different classification model. The accuracy of ANN is archived highest testing accuracy 99.86% among them. Another model SVM is also given better accuracy 99.16% as considerable for classification of attacks. We have proposed ANN as robust classifier for classification of attacks.
[image:8.612.31.278.461.613.2]Table5.1 Training and testing accuracy of various models (75 25%)
Figure 5.1 shows that training and testing accuracy of various models i.e Neural Network,SVM,CART,QUEST & CHAID.
Fig5.1 Comparative chart of various models Model Training Accuracy
Accuracy CART 90.29 QUEST 83.96 ANN 93.99 CHAID 88.56 SVM 92.77
Vol. 2 Issue VI,
ISSN: 2
N A L F O R R E S E A R C H I N A P P L I E
E R I N G T E C H N O L O GY (I J R A S E T
In first step, the data is partitioned into 75% as training and 25% as testing and training data is used for trained the model and testing data is used to test this trained model. In this piece of work we have applied different classification techniques ike CART, QUEST, ANN, CHAID and SVM in spam email data set for classification of spam and non spam email. Table 1 shows that training and testing accuracy of different classification model. The accuracy of ANN is archived highest among them. Another model SVM is also given better accuracy 99.16% as considerable for classification of attacks. We have proposed ANN as robust
Table5.1 Training and testing accuracy of various models
(75-Figure 5.1 shows that training and testing accuracy of various models i.e Neural Network,SVM,CART,QUEST & CHAID.
Comparative chart of various models
Confusion matrix
A confusion matrix, also known as a
error matrix , is a specific table layout that allows visualization of the performance of an algorithm, typically a supervised learning one (in unsupervised learning usually called a matching matrix). Each column of the matrix represents the instances in a predicted class, while each row represents the instances in an actual class.
confusion matrix of best model. Confusion matrix can be represented in form of false positive (FP), false negative (FN), true positive (TP) and true negative (TN).
Table5.2 Confusion matrix of Best model ANN
Classification accuracy = (TP+TN)/N
Sensitivity =TP/ (TP+FN)
Specificity =TN/ (TN +FP)
N=Total number of features.
Performance measure
The performance of each classification model is evaluated using three statistical measure;classification accuracy,sensitivity and specificity.These measures are defined using True positive(TP),True negative(TN),False positive(FP),False negative(FN).Table
performance measures like sensitivity, specificity and accuracy of best model.
Testing Accuracy 90.45 82.78 93.86 88.66 92.16 Actual Vs. Predicte d Training Non-Spam Spam Non-spam
1995 (TP) 99 (FN)
Spam 107 (FP) 1227 (TN)
ssue VI, June 2014
2321-9653
E D S C I E N C E
T)
contingency table or an , is a specific table layout that allows visualization of the performance of an algorithm, typically unsupervised learning it is ). Each column of the matrix represents the instances in a predicted class, while each row represents the instances in an actual class. Table 2 shows that del. Confusion matrix can be represented in form of false positive (FP), false negative (FN), true positive (TP) and true negative (TN).
2 Confusion matrix of Best model ANN
Classification accuracy = (TP+TN)/N …(1)
....(2)
Specificity =TN/ (TN +FP) ....(3)
The performance of each classification model is evaluated using three statistical measure;classification accuracy,sensitivity and specificity.These measures are defined using True positive(TP),True negative(TN),False positive(FP),False negative(FN).Table 5.3 shows that various performance measures like sensitivity, specificity and
Testing Non-Spam Spam 663 (TP) 31 (FN)
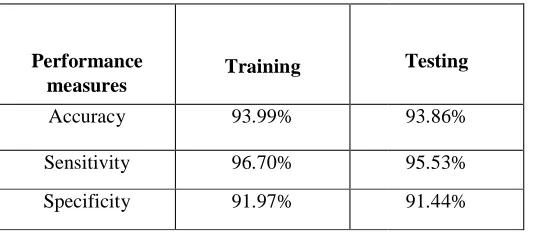
Table 5.3: Performance measures
Figure 5.2 shows that various performance measures of best
[image:9.612.63.554.316.690.2]model using pie chart.
Fig 5.2: Error measures of ANN models (a) Training
Fig 5.2: Error measures of ANN models (b) Testing
B. Feature Selection with best classification Performance
measures Training
Accuracy 93.99%
Sensitivity 96.70%
Specificity 91.97%
3: Performance measures
2 shows that various performance measures of best
2: Error measures of ANN models (a) Training
2: Error measures of ANN models (b) Testing
Feature Selection with best classification model
Due to high dimensionality of features, performance is decreasing of model. To computationally increase the performance of model, feature reduction is very important role. Actually feature selection technique that reduces irrelevant feature from data set. In this research work , we have applied ranking based feature selection technique which rank the features of data set based on its important. We have applied ranking based feature technique on best model as ANN model. Spam email data set consist 57 f
class label. Initially we rank the features from most important to less important and reduced less important features step by step shown in table 5.4. Table 5.4 shows that training and testing accuracy of best model with reduced number of features like 55, 53,51,49,47, etc. Table
initially we calculate the accuracy with all features(57) and reduced features step by step then check the accuracy of model. With high number of features, the accuracy is decreases and performance is also less. Our proposed model achieved high classification testing accuracy 94.29 in case of 33 features. Finally we can say that feature selection is very important role for our model which achieved high classification accuracy and computationally increase performance.
Table5.4 Feature Selection of best model ANN
Number of Features Training accuracy 57 93.99 55 93.90 53 93.76 51 93.29 49 93.44 47 93.70 45 93.49 43 93.41 41 93.49 39 93.58 37 93.12 35 93.38 33 93.52 31 93.26 29 93.06 27 92.94 25 92.97 23 92.47 21 91.57 19 92.18 Testing 93.86% 95.53% 91.44%
Due to high dimensionality of features, performance is decreasing of model. To computationally increase the performance of model, feature reduction is very important role. Actually feature selection technique that reduces set. In this research work , we have applied ranking based feature selection technique which rank the features of data set based on its important. We have applied ranking based feature technique on best model as ANN model. Spam email data set consist 57 features and 1 class label. Initially we rank the features from most important mportant features step by 4 shows that training and testing accuracy of best model with reduced number of features like 55, 53,51,49,47, etc. Table 5.4 shows that, initially we calculate the accuracy with all features(57) and reduced features step by step then check the accuracy of model. With high number of features, the accuracy is decreases and performance is also less. Our proposed model achieved high classification testing accuracy 94.29 in case of 33 features. Finally we can say that feature selection is very or our model which achieved high classification accuracy and computationally increase
Feature Selection of best model ANN
www.ijraset.com Vol. 2 Issue VI, June 2014 ISSN: 2321-9653
I N T E R N A T I O N A L J O U R N A L F O R R E S E A R C H I N A P P L I E D S C I E N C E
AN D E N G I N E E R I N G T E C H N O L O G Y (I J R A S E T)
Page 391
17 92.18 92.24
15 90.99 90.37
[image:10.612.24.279.244.352.2]After analyse that training and testing accuracy of best model with reduced number of features then we measure the performance of neural network. The performance of neural network is evaluated using three statistical measure; classification accuracy, sensitivity and specificity.
Table 5.5: Performance measures
The above table measure the performance of neural network and the below chart represent the accuracy , sensitivity and specificity of neural network with reduced number of features.
Figure 5.3: Various performance measures after feature selection
VI. CONCLUSION
In this study, I have used various datamining techniques for classification of spam mail filtering . In general,accuracy of training is higher than that of the testing,but in some cases opposite to this.This is possible due to sampling of training and testing dataset.We can conclude that the accuracy of model which is highly dependent upon the data sample prepared for training and testing,for any intelligence system. In this piece of research work it is a good indication that the difference between testing accuracy and training accuracy is minor. After analyse the result of the best algorithm, based on the accuracy then we applied feature selection technique on that algorithm.Feature selection algorithms are the facts that it reduces the dimension of data, it makes the training faster and it can improve accuracy by removing noisy features.
REFERENCES
[1] L. Fulu, H. Mo-Han, and G. Pawel, “The community behavior of spammers,” http://web.media.mit.edu/∼ fulu/ClusteringSpammers.pdf.
[2] C. Paulo, L. Clotilde, S. Pedro et al., “Symbiotic data mining for personalized spam filtering,” in Proceedings of the International Conference on Web Intelligence and Intelligent Agent Technology,(IEEE/WIC/ACM), pp. 149–156, 2009.
[3] X. Li and N. Ye, “A supervised clustering and classification algorithm for mining data with mixed variables,” IEEE Transactions on Systems, Man, and Cybernetics Part A, vol. 36, no. 2, pp. 396–406, 2006.
[4.] D. Puniškis, R. Laurutis, and R. Dirmeikis, “An Artificial Neural Nets for Spam e-mail Recognition,” Electronics and Electrical Engineering, Nr. 5 (69), 2006
[5]. James Clark, Irena Koprinska, Josiah Poon, A Neural Network Based Approach to Automated E-mail Classification.
[6]. Kolter, J. Zico, Maloof, Marcus A., learning to detect and classify malicious executables in the wild. J. Mach. Learn. Res., 7:2721–2744. 2006.
[7] L. Özgür, et al., "Adaptive anti-spam filtering for agglutinative languages: a special case for Turkish," Pattern Recognition Letters, vol.25, pp. 1819-1831, 2004.
[8] X. Li and N. Ye, “A supervised clustering and classification algorithm for mining data with mixed Performance
measures Training
Testing
Accuracy 93.52 94.29
Sensitivity 95.17 95.82
Specificity 90.92 92.06
88 90 92 94 96 98
Accuracy Sensitivity Specificity
Different measures
[image:10.612.27.279.419.603.2]variables,” IEEE Transactions on Systems, Man, and Cybernetics Part A, vol. 36, no. 2, pp. 396–406, 2006.
[9] Hu H., Li J., Plank A., Wang H. and Daggard G., “A Comparative Study of Classification Methods for Microarray Data Analysis”, In Proc. Fifth Australasian Data Mining Conference, Sydney, Australia (2006).
[10.] W.A. Awad, And S.M. Elseuofi, "Machine Learning Methods for Spam E-Mail Classification," International Journal of Computer Science & Information Technology (IJCSIT), Vol. 3, No. 1, Feb. 2011.
11. Sahami, M.; Dumais, S.; Heckerman, D. and Horvitz, E.: A Bayesian Approach to Filtering Junk E-Mail. In Learning for Text Categorization – Papers from the AAAI Workshop (Madison, Wisconsin, 1998) 55-62.
12. Hall, M. A., Smith, L. A., 1997, Feature Subset Selection: A Correlation Based Filter Approach, International Conference on Neural Information Processing and Intelligent Information Systems, Springer, p855-858.
[13] A. H. Mohammad and R. A. Zitar, "Application of genetic optimized artificial immune system and neural networks in spam detection," Applied Soft Computing, vol. 11,pp. 3827-3845, 2011.
[14] Lixin Fu and Geetha Gali, “Classification Algorithm for Filtering Email spam”, Recent Progress in Data Engineering and Internet Technology, 2012, Volume 157, 149-154, DOI: 10.1007/978-3-642-28798-5_21.
[15] N. Cristianini an d J. S. Taylor, An Introduction to Support Vector Machines and Other Kernel-based Learning
Methods, Cambridge University Press, 2000.
[16] V. vapnik. , The Nature of Statistical Learning Theory, Springer, New York, 1995.
[17] B.Cui, A.Mondal, J.Shen, G.Cong, and K.Tan, 2005. On effiective Email classification via Neural networks. In Proceedings of DEXA,, PP.85-94.
[18]Neeti Saxena1, Bharati Verma2, Nitin Shukla3” Online Email Classification Using Ant Clustering Algorithm” International Journal of Emerging Technology and Advanced Engineering
[19]R. Kishore Kumar, G. Poonkuzhali, P. Sudhakar, Member, IAENG ”Comparative Study on Email Spam Classifier using Data Mining Techniques”.
[20]Sarab M. Hameed1, Noor Alhuda J. Mohammed2 ”A Content based Spam Filtering Using Optical Back Propagation Technique”International Journal of Application or Innovation in Engineering & Management (IJAIEM).
[21] Ismaila Idris “E-mail Spam Classification With Artificial Neural Network and Negative Selection Algorithm“International Journal of Computer Science & Communication Networks,Vol 1(3), 227-231
[22]Ismaila Idris,,Ali Selamat”OPTIMIZED SPAM CLASSIFICATION APPROACH WITH NEGATIVE SELECTION ALGORITHM” Journal of Theoretical and Applied Information Technology 15 May 2012. Vol. 39 No.1
[23]R. Parimala, Dr. R. Nallaswamy”A Study of Spam E-mail classification using Feature Selection Package” Global Journal of Computer Science and Technology Volume 11 Issue 7 Version 1.0 May 2011
[24] Jose Norte Sosa”Spam Classification Using Machine Learning Techniques - Sinespam” August 2010.
[25]Arun K Pujari Department of computer and information sciences University of Hyderabad “Data mining Techniques” Second Edition.
[26]Rashmi Gupta”Data mining techniques for classification of data using Decision tree algorithm and rule generaation”.
[27] Lei Yu ,Huan Liu” Efficient Feature Selection via Analysis of Relevance and Redundancy” Journal of Machine Learning Research 5 (2004) 1205–1224.
[28] Yi-Wei Chen and Chih-Jen Lin” Combining SVMs with Various Feature Selection trategies” Department of Computer Science, National Taiwan University, Taipei 106, Taiwan.
[29] Luis Carlos Molina, Lluís Belanche, Àngela Nebot” Feature Selection Algorithms: A Survey and Experimental Evaluation”.
www.ijraset.com Vol. 2 Issue VI, June 2014 ISSN: 2321-9653
I N T E R N A T I O N A L J O U R N A L F O R R E S E A R C H I N A P P L I E D S C I E N C E
AN D E N G I N E E R I N G T E C H N O L O G Y (I J R A S E T)
Page 393 [31] Federal Trade Commission, USA: False Claims in Spam (2003).
[32] Oard, D.W.: The state of the art in text filtering. User Modeling and User-Adapted Interaction, Vol.7, (1997) 141– 178.
[33] Méndez J.R., Iglesias E.L., Fdez-Riverola, F., Díaz F., Corchado, J.M.: Analyzing the Impact of Corpus Preprocessing on Anti-Spam Filtering Software. Research on Computing Science, To appear. (2005).
[34] YongSeog Kim, W. Nick Street, and Filippo Menczer, University of Iowa, USA.
[35] Vasilis Vryniotis“Using Feature Selection Methods in Text Classification”
[36] Megha Mishra”Feature Selection technique for Classification of Data”.
[37] Ping-Chang Lin-Howqrd University Dec 3 2012,Google.
[38] Este tutorial se ha confeccionado en la universidad Politécnica de Madrid-UPM (España), bajo la dirección del Dr. Diego Andina de la Fuente del departamento de Señales, Sistemas y Radiocomunicaciones (SSR), Grupo de Circuitos (GC) y desarrollado con la participación del M. en I. Antonio Vega Coronade la Facultad de Ingeniería Mecánica, Eléctrica y Electrónica de la Universidad de Guanajuato dentro del Programa de Mejoramiento del Profesorado (PROMEP).
[39] Lim, T. S., Loh, W. Y. and Shih, Y. S., 2000. A Comparison of Prediction Accuracy,
Complexity, and Training Time of Thirty-three Old and New Classification Algorithms.Machine Learning, 40, 2000.
[40]Loh, W. Y. and Shih, Y. S., 1997. Split selection methods for classification trees. StatisticaSinica, Vol. 7, p. 815 - 840.
[41] W.-Y. Loh and Y.-S. Shih. Split selection methods for classification trees. Statistica Sinica, 7:815–840, 1997.