ELECTRICAL STIMULATION TO IMPROVE PROPRIOCEPTION IN THE NORMAL KNEE
Amber Taylor Collins
A thesis submitted to the faculty of the University of North Carolina at Chapel Hill in partial fulfillment of the requirements of the degree of Masters of Science in the Department of
Biomedical Engineering.
Chapel Hill 2007
Approved by
Advisor: Paul Weinhold
Reader: Jonathan Troy Blackburn
ABSTRACT
Amber Collins: Electrical Stimulation to Improve Proprioception in the Normal Knee (Under the direction of Paul Weinhold)
Proprioception is the conscious and unconscious perception of joint position and movement
in space. Deficits in knee proprioception are known to occur after specific knee injuries and
may increase the risk of acute knee injury. These deficits have also been shown to have a
role in the progression of knee osteoarthritis. Stochastic resonance electrical stimulation may
be a novel way of improving knee proprioception by increasing the output of sensory
systems. This study was designed to demonstrate whether any differences exist in
proprioception in the normal knee when subject to the combination of subthreshold electrical
stimulation and a neoprene knee sleeve. We found that joint position sense was best during
the sleeve/stimulation condition in the partial weight bearing task and best during the
sleeve/no stimulation condition in the nonweight bearing task. These results are promising
To my husband and family whose love, endless encouragement, and support made this
ACKNOWLEDGEMENTS
I would like to thank my research advisor, Paul Weinhold and my committee members Troy
Blackburn and Mark Tommerdahl for all of their advice and support throughout this project.
I would especially like to thank Troy Blackburn for the use of his Motor Control Lab and
equipment that made subject testing possible.
I would like to thank Afferent Corp. for the use of their equipment and donation of their
electrodes.
I would also like to thank all the subjects who volunteered to participate in this study.
And finally, I would like to thank the Orthopaedics department at UNC Chapel Hill and the
TABLE OF CONTENTS
Page
LIST OF TABLES... viii
LIST OF FIGURES ... ix
LIST OF ABBREVIATIONS AND SYMBOLS ... xi
1. Introduction... 1
1.1 Osteoarthritis... 1
1.2 Importance of Testing in Normals ... 3
1.3 Specific Aims and Hypothesis ... 4
2. Background ... 6
2.1 The Cycle of Osteoarthritis... 6
2.2 Functional Anatomy of the Knee... 8
2.3 Proprioception and Sensory Processing... 10
2.3.1 Important Sensory Receptors... 10
2.3.2 Vestibular and Vision ... 12
2.4 Techniques to Measure Proprioception ... 13
2.4.1 Measuring Proprioception... 13
2.4.2 Equipment Used to Measure Proprioception ... 14
2.4.3 Real and Absolute Error Measurements ... 16
2.5 Non-weight bearing vs. Weight-bearing... 17
2.6 Active vs. Passive Knee Positioning... 18
2.7 Knee Sleeve ... 19
2.8.1 Lasting Effects of Stochastic Resonance ... 23
2.8.2 Additional effects of Electrical Stimulation ... 24
2.9 Current Osteoarthritis Therapies... 25
3. Research Design and Methods... 26
3.1 Research Design Specific Aims and Hypothesis... 26
3.2 Institutional Review Board ... 27
3.3. Subject Information ... 27
3.3.1. Recruitment... 27
3.3.2. Exclusion Criteria ... 28
3.3.3. Study Questionnaire... 28
3.4. Study Design... 29
3.5. Study Procedure ... 32
3.5.1. PWB steps... 32
3.5.2. NWB steps ... 33
3.5.3. Stimulus Threshold to Detection ... 34
3.6. Equipment... 34
3.6.1. PWB setup ... 34
3.6.2. NWB setup... 36
3.6.3. Electrical Stimulation Setup ... 37
3.6.4. Electrogoniometer... 39
3.6.5. Electronic Trigger ... 41
3.6.6. Labview Software ... 42
3.6.7 Heel Wedge... 43
3.6.8 Blindfold/Headphones ... 44
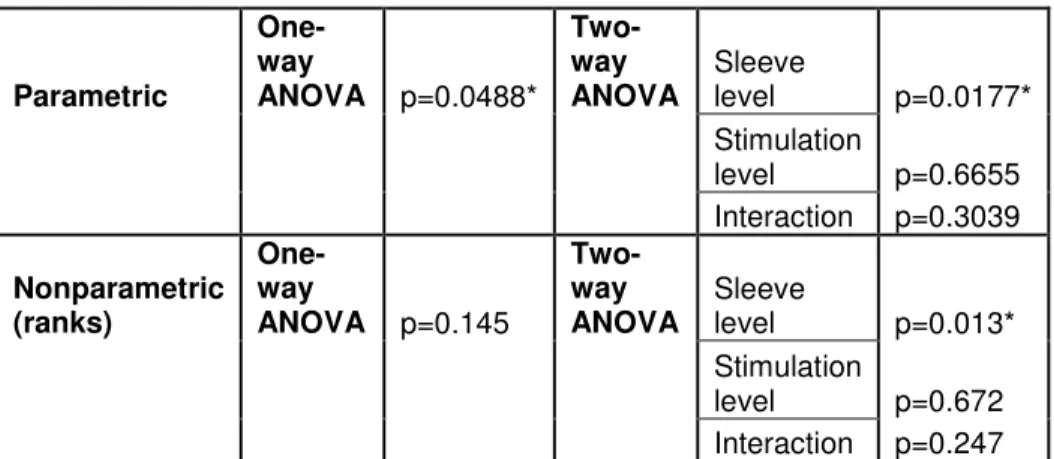
3.7 Statistics ... 44
4. Results... 46
4.1. Subject Demographics ... 46
4.2. Absolute Mean Error ... 46
4.2.1. NWB Absolute Mean Error ... 47
4.2.2. PWB Absolute Mean Error ... 51
4.3. Real Mean Error... 55
4.3.1. NWB Real Mean Error ... 56
4.4. Standard Deviation Error ... 59
4.4.1. NWB Standard Deviation Error... 59
4.4.2. PWB Standard Deviation Error ... 61
4.5. Regression Analysis... 63
4.5.1. NWB Absolute Mean Error Regression Analysis ... 63
4.5.2. PWB Absolute Mean Error Regression Analysis ... 66
4.6. Exclusion of 6 subjects ... 68
4.6.1. Exclusion of 6 subjects (PWB data) ... 68
4.7. Effects of Testing Conditions for Each Gender... 69
4.7.1. NWB Error Gender Based Differences... 69
4.7.2. PWB Instantaneous Error Gender Based Differences ... 71
4.8. Electrical Stimulation Lasting Effects ... 74
5. Discussion ... 75
5.1. Analysis of Results ... 76
5.1.1. Absolute Mean Error... 76
5.1.2. Regression Analysis... 77
5.1.3. Additional Results... 78
5.2. Study Limitations... 80
5.3. Clinical Relevance ... 81
5.4. Future Research ... 82
5.5. Conclusions... 83
APPENDIX A: Subject Questionnaire ... 85
APPENDIX B: Subject recruitment announcement ... 86
APPENDIX C: IRB application... 87
APPENDIX D: Subject Consent Form ... 96
LIST OF TABLES
Table 1. Listing of the 8 test sequences combining the 4 test conditions. A-D
represent different stages of the test sequence. Note: +E=electrical stimulation,
-E=no electrical stimulation, +S=sleeve on, -S=sleeve off... 30
Table 2. Listing of the 24 total test sequences that incorporate the dummy target angles for the PWB and NWB tasks. A-F represent different stages of the test sequence. ... 31
Table 3. Potentiometer block calibration data for the three trials performed. ... 40
Table 4. Mean (+SD) values for subject characteristics ... 46
Table 5. NWB Absolute Mean Errors with Standard Deviation by condition ... 48
Table 6. NWB Absolute Mean Error Statistical p values (* indicates significance) ... 48
Table 7. PWB Absolute Mean Errors with Standard Deviation by condition ... 52
Table 8. PWB Absolute Mean Error Statistical p values (* indicates significance)... 52
Table 9. NWB Real Mean Errors with Standard Deviation by condition ... 56
Table 10. NWB Real Mean Error Statistical p values. (* indicates significance) ... 57
Table 11. PWB Real Mean Errors with Standard Deviation by Condition ... 58
Table 12. PWB Real Mean Error Statistical p values (*indicates significance)... 59
Table 13. NWB SD Mean Errors with Standard Deviations by condition ... 60
Table 14. PWB SD Mean Error with Standard Deviation by condition... 62
Table 15. PWB SD Error Statistical p values (*indicates significance) ... 63
Table 16. PWB Absolute Mean Error with Standard Deviation (Exclusion of 6 subjects).... 69
Table 17. PWB Absolute Mean Error Statistical p values (Exclusion of 6 subjects, * indicates significant differences) ... 69
Table 18. NWB Gender Based Differences in Mean and Standard Deviation... 70
Table 19. NWB Gender Based Difference Statistical p values (*indicates significance) ... 71
Table 20. PWB Gender Based Differences in Means and Standard Deviation ... 72
LIST OF FIGURES
Figure 1. The osteoarthritis cycle theory [4]... 7
Figure 2. Anatomy of the knee (frontal view)[18]... 9
Figure 3. Knee Flexometer used in a partial weight bearing task... 15
Figure 4. One elecrogoniometer configuration which measures joint angle with the strain gauge located in the connecting spring... 15
Figure 5. The reduction of postural sway with the application of a vibratory noise signal in a study by Priplata et al. investigating diabetic and elderly patients (left)[13]. Gravelle et al. investigated stochastic electrical stimulation applied at the knee(right)[7]. ... 21
Figure 6. Increased cutaneous detection with the application of subthreshold noise.[31] .... 22
Figure 7. Increased relative muscle spindle output with the application of subthreshold tendon vibration. [6]... 22
Figure 8. Partial weight bearing setup ... 35
Figure 9. Nonweight bearing setup ... 36
Figure 10. Electrical Stimulus equipment setup ... 37
Figure 11. (Left) Lateral placement of the superior and inferior electrodes. (Right) Medial placement of the superior and inferior electrodes. ... 38
Figure 12. Frontal view of superior and inferior electrodes. ... 38
Figure 13. Placement of the electrogoniometer about the knee joint in the NWB task... 39
Figure 14. Labview front panel illustrating the electrogoniometer and trigger waveforms for a subject during the PWB task. ... 41
Figure 15. Labview front panel which illustrates "drifting" during a PWB task... 43
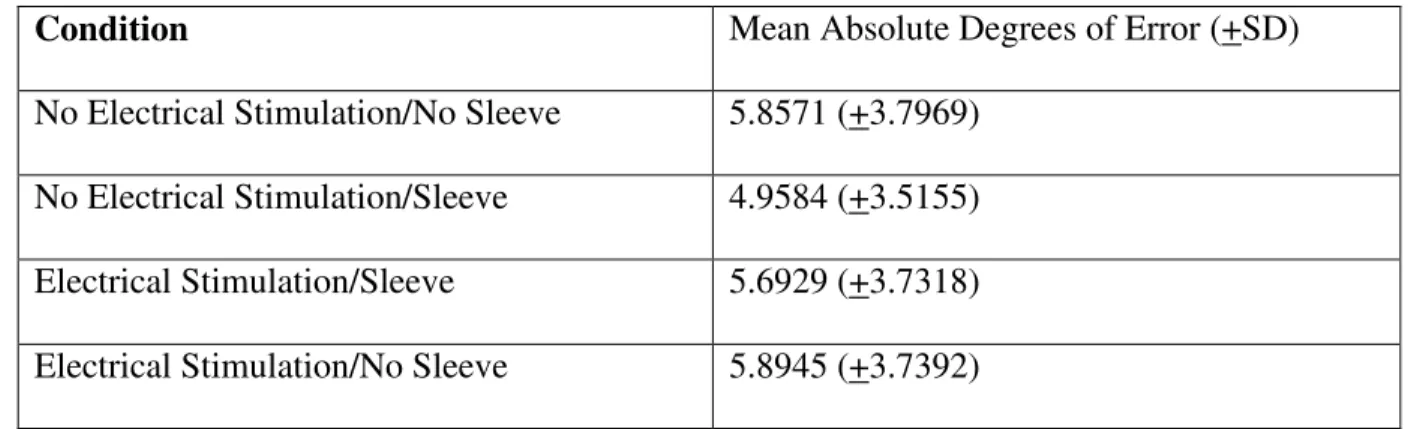
Figure 16. NWB Absolute Mean Errors (+/- SD) by Condition (NE=No Electrical Stimulation, E=Electrical Stimulation, NS=No Sleeve, S=Sleeve)... 47
Figure 17. NWB NE/NS Condition Histogram. Skewness=1.78, Kurtosis=2.47 ... 49
Figure 18. NWB NS/S Condition Histogram. Skewness=1.72, Kurtosis=3.87... 49
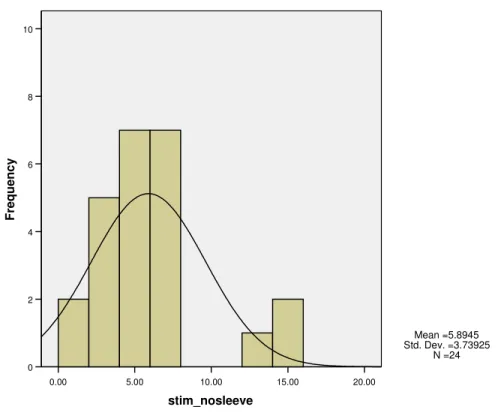
Figure 20. NWB E/NS Condition Histogram. Skewness=1.41, Kurtosis 1.83... 50
Figure 21. PWB Absolute Mean Error by condition (* indicates multiple comparison significant differences)... 51
Figure 22. PWB NE/NS Condition Histogram. Skewness=0.75, Kurtosis=-.11... 53
Figure 23. PWB NE/S Condition Histogram. Skewness=1.13, Kurtosis=2.98 ... 54
Figure 24. PWB E/S Condition Histogram. Skewness=0.68, Kurtosis=-0.23... 54
Figure 25. PWB E/NS Condition Histogram. Skewness=0.25, Kurtosis=0.29 ... 55
Figure 26. NWB Real Mean Error by condition... 56
Figure 27. PWB Real Mean Errors with Standard Deviation... 58
Figure 28. NWB Standard Deviation Mean Error by condition (* indicates significance between groups) ... 60
Figure 29. NWB SD Mean Error Statistical p values (* indicates significance) ... 61
Figure 30. PWB SD Mean Error by condition (* indicates significance between groups) ... 62
Figure 31. NWB Regression Analysis of NE:NS vs. NE:NS-NE:S (p=0.142, R=0.309) ... 64
Figure 32. NWB Regression Analysis of NE:NS vs. NE:NS-E:S (p=0.006*, R=0.540) ... 65
Figure 33. NWB Regression Analysis of NE:NS vs. NE:NS-E:NS (p=0.499, R=0.145) ... 65
Figure 34. PWB Regression Analysis of NE:NS vs. NE:NS-NE:S (p=0.001*, R=0.618).... 66
Figure 35. PWB Regression Analysis of NE:NS vs. NE:NS-E:S (p<0.001*, R=0.780)... 67
Figure 36. PWB Regression Analysis of NE:NS vs. NE:NS-E:NS (p=0.480, R=0.151)... 67
Figure 37. PWB Absolute Mean Error (Exclusion of 6 subjects, * indicates significance between groups) ... 68
Figure 38. NWB Error Means (+/- SD) Gender Based Differences by condition... 70
Figure 39. PWB Gender Based Differences ... 72
LIST OF ABBREVIATIONS AND SYMBOLS
CNS Central Nervous System
-E/-S No Electrical Stimulation and No Sleeve
+E/-S Electrical Stimulation and No Sleeve
-E/+S No Electrical Stimulation and Sleeve
+E/+S Electrical Stimulation and Sleeve
FWB Full Weight Bearing
ICC Intraclass Correlation Coefficient
IRB Institutional Review Board
IPRC Injury Prevention Research Center
JPS Joint Position Sense
MCL Motor Control Lab
NWB Non Weight Bearing
mA milliamp
µA microAmp
PES Pulsed Electrical Stimulation
PWB Partial Weight Bearing
OA Osteoarthritis
1. Introduction 1.1 Osteoarthritis
It is estimated that by the year 2030, 20 percent of Americans--about 70 million
people--will have passed their 65th birthday, and people--will be at risk for osteoarthritis. Osteoarthritis (OA)
is the most common joint disorder throughout the United States, with OA of the knee being
especially common and debilitating. The exact cause of osteoarthritis is not known, but it is
thought that it may result from a combination of several factors such as age, excessive
weight, joint injury, and joint stress. A study by Felson et al.[1] stated that men whose jobs
required knee bending and at least medium physical demands had higher rates of knee OA
(43.4%) versus those men whose jobs required neither (26.8%). Several studies have shown
that OA patients in comparison to age-matched controls have a deficit in proprioception,
which is the conscious and unconscious awareness of body limb position and movement in
space[2-5]. A study by Sharma et al.[4] looked at proprioception in patients who were
affected by OA in only one knee and compared it to the contralateral unaffected knee. They
found proprioceptive deficits in the contralateral knee of equivalent magnitude to that of the
affected limb, which suggests a role for impaired proprioception in the development of OA.
Abnormal proprioception may result in impairment of neuromuscular responses which can
expose joints to improper loading during the gait cycle. This improper loading may cause
abnormal wear of the joint and may initiate or accelerate the disease process of osteoarthritis.
If impaired proprioception contributes to osteoarthritis, then a possible means to slow the
Stochastic resonance is a phenomenon in which low levels of random noise stimulation
(electrical/mechanical) have been shown to enhance the detection and transmission of weak
signals in sensory systems such as muscle spindles or cutaneous sensory receptors[6]. The
concept of stochastic resonance has been applied clinically at the knee with success in
improving balance control in older adults[7]. While this particular study did not directly
measure knee proprioception, it did suggest the potential for electrical noise stimulation to
improve knee joint proprioception, as previous studies have demonstrated a correlation
between balance ability and knee joint proprioception in older adults[8].
In considering the use of noise stimulation for improving knee proprioception, a practical
consideration is how the electrical stimulation will be applied. A simple means of applying
the stimulation electrodes would undoubtedly be by incorporating them into a soft or hard
knee brace. As studies have documented the ability of braces or sleeves to improve joint
proprioception, an additional question this study attempted to answer was if electrical
stimulation can improve proprioception beyond the tactile stimulation provided by a brace
alone[9-12]. This research idea can be explored in different patient populations, one of
which is previously described, OA patients. With success in improving the proprioception of
OA patients, electrical stimulation could be used to slow the progression of the many other
diseases and injuries affected by proprioceptive deficits or possibly prevent their onset in
people susceptible to these diseases or prone to injury. Examples of this may include
improving balance in stroke patients, reducing the occurrence of ulcers in diabetic patients by
improving their loading patterns through enhanced proprioception, improving joint loading
after intraarticular fracture by improving proprioception and facilitating more effective joint
loading.
The elderly population could potentially benefit from this research idea as well. Balance,
which is linked to proprioception, is altered in elderly people and this can lead to falls.
Previous studies have looked at stimulation to improve balance in the elderly and diabetic
patients but there has been no research which looks at the use of electrical stimulation to
specifically improve proprioception in these populations[7, 13, 14].
1.2 Importance of Testing in Normals
Before looking for proprioceptive improvements with electrical stimulation in OA patients
for which recruitment efforts would be more complex, we believed it would be most
worthwhile to conduct initial work in normal uninjured subjects. This was done in order to
evaluate the ability of electrical stimulation to improve proprioception as compared to other
methods (knee brace or sleeve) that are known to improve proprioception in normals and in
populations with proprioceptive deficits. Proprioception in nondiseased subjects is assumed
normal, and therefore, any improvements seen in normal subjects who are not afflicted with
proprioceptive deficits may be assumed to be more substantial in a patient population whose
proprioception is abnormal such as OA patients. By successfully showing an improvement
in proprioception in normal subjects, we believed this would better demonstrate the potential
for utilizing this method in a number of clinical populations with proprioceptive deficits
including the OA patient population that we wish to target next.
It is our hope that the success of this project will lead to the evaluation of the method of
subthreshold electrical stimulation to improve proprioception in the clinical populations
1.3 Specific Aims and Hypothesis
The objective of this project is to evaluate proprioception in the normal knee under various
combinations of sleeve and electrical stimulation conditions.
AIM 1: To determine whether random subthreshold electrical stimulation applied at the normal knee will improve proprioception. Previous studies have examined the effects of
stimulation in improving balance in the elderly and diabetic patients but have not yet looked
at improving proprioception through subthreshold electrical stimulation.
Hypothesis 1: We hypothesize that proprioception will be more accurate during the sleeve/stimulation condition compared to the no sleeve/no stimulation control condition.
AIM 2: To determine whether the application of electrical stimulation improves proprioception beyond that seen by a neoprene knee sleeve alone.
Hypothesis 2: We hypothesize that proprioception will improve with the application of electrical stimulation and sleeve beyond the improvement seen with the sleeve alone.
AIM 3: To characterize how improvements in proprioception with the combinations of sleeve/no sleeve and stimulation/no stimulation conditions differ with a partial weight
bearing and a nonweight bearing task.
Hypothesis 3.1: We hypothesize that proprioception will be more accurate during the sleeve/stimulation condition than the no sleeve/no stimulation control condition in the partial
Hypothesis 3.2: We also hypothesize that proprioception will be more accurate during the sleeve/no stimulation condition than the no sleeve/no stimulation control condition in the
2. Background
2.1 The Cycle of Osteoarthritis
Osteoarthritis is the most common form of arthritis and it affects millions of people in the
United States. Since the prevalence of this disease increases with age, it is becoming more
and more important to find solutions as the baby boomer generation grows older. The exact
mechanism by which age predisposes individuals to osteoarthritis is unclear. It is speculated
that biochemical changes in aging cartilage make it more susceptible to damage and
degradation[15]. The specific cause of Osteoarthritis (OA) is not known but it is thought to
be caused by a combination of biomechanical and biochemical factors. The amount of
research performed to determine the causes continues to grow. Currently, possible causes
include genetics, dietary intake, low bone density, obesity, muscle weakness, and joint laxity
among others. Additionally, some cases of OA have arisen from joint injury. All of these
risk factors are especially important in weight bearing joints, particularly the knee. Of
particular importance to the onset and progression of OA is the concept of proprioception,
the process of presenting the central nervous system with data relating to joint position, force,
and motion. These data are processed at conscious and unconscious levels in order to initiate
motor responses. OA leads to altered proprioception, which may lead to abnormal joint
wear, causing disease progression. In one study which examined whether proprioception is
worse in the arthritic knee versus the contralateral unaffected knee, Sharma et al. discuss
potential directions in the relationship between impaired proprioception and knee
established OA may have contributed to and/or resulted from the disease itself. They
speculate that disruption of components located along the afferent pathways may lead to
repetitive, abnormal loading across the articular surface of the knee which would result in
OA. Alternatively, impairment of knee joint position sense might result from the
pathological changes that arise from OA such as the destruction or disturbance of capsule,
ligament, muscle, and tendon mechanoreceptor function. In summary, there are two main
pathways which are illustrated in figure 1: A. OA results from proprioceptive deficits or B.
Proprioceptive deficits result from the pathological factors of the disease. Pathological
factors are likely to exert their effects in knee OA progression by affecting the material
properties of the knee and thus changing the ability to bear load.
Figure 1. The osteoarthritis cycle theory [4]
of articular cartilage. Although biomechanical factors are likely to contribute to the
pathogenesis of knee OA, their exact mechanism of altering joint morphology is not known.
Studies have shown a strong significant association between both the degree of foot rotation
during gait and the line of progression and the magnitude of knee adduction moment [16,
17]. Further studies involving knee adduction moment are required to better understand the
biomechanical pathogenesis of OA.
When clinically pronounced, OA is characterized by joint pain, tenderness, limitation of
movement, crepitus, and variable degrees of inflammation. The thought that OA may result
from proprioceptive deficits is a clinically relevant idea, because treatment of the
proprioceptive impairment may result in a disease-modifying effect rather than simply
treating the symptoms of the condition. Thus, the electrical stimulation method being
investigated in this thesis for its ability to improve proprioception has the potential to be a
disease-modifying treatment for OA. While this research does not focus on OA specifically,
it does set out to determine if improvements in proprioception can be made at the normal
knee with the stochastic resonance electrical stimulation technique.
2.2 Functional Anatomy of the Knee
Before beginning a discussion regarding proprioception of the knee and possible
mechanisms of action of electrical stimulation, it is important to review the functional
Figure 2. Anatomy of the knee (frontal view)[18]
The knee is made up of four joints: patellofemoral (where the femur connects with the knee
cap), tibio fibular (where the tibia connects with the fibula), lateral tibio femoral, and medial
tibio femoral. Bones of these joints are held in place primarily by passive restraints, or
ligaments. The joints themselves are further supported by dynamic restraints, or muscles.
Located between the femur and the tibia are the menisci (pads of cartilage) which serve to
absorb shock transmitted from the bones upon impact. The knee moves primarily in
extension and flexion with slight secondary movements of translation and rotation. Knee
flexion and extension are achieved through contributions of several major muscle groups
spanning the joint. The quadriceps muscle group on the anterior portion of the upper leg
helps to straighten the knee from a bent position while the hamstring muscle group located at
the posterior of the upper leg work to bend the knee from extension to flexion. Below the
patella are two important muscles, the gastrocnemius and soleus which are responsible for
2.3 Proprioception and Sensory Processing
It is important to understand the basics of sensory information processing when dealing
with the concept of proprioception. Limb position and movement are the products of
multisite sensory input which is received and processed by the central nervous system (CNS).
The CNS receives information from three main systems: somatosensory, vestibular, and the
visual systems. This research is geared primarily towards somatosensation which is often
referred to as proprioception. The somatosensory system’s main function is to process
information regarding touch, pressure, joint displacement, and movement. In addition to
detecting postural sway, the somatosensory system has been suggested to trigger
coordination of postural responses through neuromuscular pathways that are organized with
mechanoreceptors of various types [19]. Feedback from the system is thought to allow
adjustment of motor programs during tasks such as walking on irregular ground. Peripheral
afferents such as those sensory receptors contained in muscle, skin or in the joints, visual
receptors, and vestibular receptors provide the central nervous system with information
regarding their environmental conditions.
2.3.1 Important Sensory Receptors
Knowledge of position, both static and dynamic, depends on knowing the degrees of
angulation of all joints in all planes and their rates of change. Therefore, multiple types of
receptors, including skin tactile receptors and deep tissue receptors, help to determine joint
angulation and are used in combination to determine joint position sense [20]. While it has
long been debated as to whether cutaneous, joint, or muscle receptors are most important to
the maintenance of balance, contemporary belief is that all receptors contribute. Specifically,
joint which include: Pacinian corpuscles, Golgi joint receptors, Golgi tendon receptors,
Ruffini endings, and muscle spindles.
Pacinian corpuscles detect pressure changes and they function to communicate information
with the brain about limb movement. The pacinian corpuscles are fast adapting
mechanoreceptors, which means they are very sensitive to small deformations caused by
pressure and initiate discharge of electrical potentials only during the application or removal
of a stimulus, or during acceleration or deceleration of a moving joint. With regard to
vibration, pacinian corpuscles can detect signal vibrations from 30 to 800 cycles per second
because they are fast adapting. At joint angulation extremes, stretching of the ligaments and
deep tissues around the joints is important for determining position. Pacinian corpuscles, as
well as Ruffini endings, detect these types of changes.
However, unlike pacinian corpuscles, Ruffini endings are slow adapting which means they
may detect changes in tissue stresses and strains as well as continue to signal for prolonged
periods of time. In addition, Ruffini endings register both static and dynamic factors. Both
Pacinian corpuscles and Ruffini endings are found cutaneously as well as in the ligaments,
joint capsule and menisci.
Golgi receptors are found in the muscle tendons, menisci, and collateral and cruciate
ligaments. There are two main types: Golgi tendon receptors and Golgi joint receptors which
indicate their location by their name. Both Golgi receptors are slow adapting and have a high
threshold for detection of mechanical deformation, and may continue to signal about the new
tissue state for prolonged periods of time. They are responsible for sending information to
For determining joint angulation in mid ranges of motion, muscle spindles are among the
most important. Like the Pacinian corpuscles, muscle spindles are adapted for detecting
rapid rates of change [20]. Muscle spindles contain both afferent and efferent innervation
and they consist of short muscle fibers attached in series with a normal muscle fiber. Of
particular importance to this research is the fact that muscle spindles are sensitive to weak
movement signals, but this sensitivity can be enhanced by the introduction of noise through
the tendon of the parent muscle[6]. Additionally, the information that emerges from the
muscle spindle is not perceived by the sensory cortex, thus showing its role in the
subconscious regulation of motion.
Cutaneous (skin) afferents are also thought to contribute somewhat to joint proprioception,
but joint and muscle afferents are thought to have a much greater affect on proprioception.
One possible explanation for this is that the cutaneous afferents play more of a role during
the NWB task than they do during the PWB task where functional proprioception is
determined by joint and muscle afferents. This idea will be discussed in more detail in
section 2.6 which discusses the role of the neoprene knee sleeve.
2.3.2 Vestibular and Vision
The vestibular and vision systems also play a role in maintaining the body’s awareness of
position and movement. The orientation of a person’s eyes and head relative to their
surroundings contribute to body awareness. One study tested the visual threshold for
perception of sway during standing in humans and found that the eyes were the only
contributing modality, demonstrating that visual input provides a sensitive means of
gravitational, linear, and angular accelerations of the head relative to surrounding space [19].
Once received by the central nervous system, the information is processed and motor control
arises by way of spinal reflexes and information is transferred directly to specific muscle
groups which contract accordingly to generate body movement. Visual input is not relevant
to this study as the use of a blindfold during all testing eliminates their contributions. The
use of headphones works to eliminate any auditory cues which would allow the subject to
determine their relative position. Despite the use of headphones, there are other parts of the
vestibular system which could contribute to detection of position sense.
2.4 Techniques to Measure Proprioception
2.4.1 Measuring Proprioception
Proprioception is divided into two categories and is traditionally measured by analyzing
one of the two: the sense of static position (joint position sense) which is used in this study
and the sense of dynamic motion (kinesthesia). Kinesthesia is determined by looking at the
threshold to detection of passive motion, while joint position sense is measured by looking at
the reproduction of specific joint angles. Both are measured in terms of angles, with large
variations existing with each approach. Because of the amount of variation with each
technique, comparison between studies is difficult. Presently, there are a variety of different
ways to measure proprioception, but no consensus has been reached as to the best method. A
study by Beynnon et al. compared joint kinesthesia and joint position sense as methods to
measure knee proprioception[22]. Joint kinesthesia is typically measured by passive motion
of the knee by the investigator at a fixed rate. With this method, the subject’s legs are
magnitude of flexion (or extension) that the leg has moved when the subject detects motion
of that leg. Joint position sense, however, does not rely on detection of motion, but rather the
subject’s ability to accurately reproduce predetermined joint angles. The joint position sense
technique most commonly used in the orthopaedic literature involves passively setting the
knee index angle with movement of the leg into extension from flexion followed by active
reproduction of the angle by the subject [22]. The difference in set index angle and
reproduced angle is measured. Differences in data analysis also exist and include the
measurement of real mean error or absolute mean error, where the absolute value of the real
error is taken.
2.4.2 Equipment Used to Measure Proprioception
Differences also exist in the equipment used to measure joint angles. Such equipment
includes flexometers, electromagnetic tracking systems, and electrogoniometers.
Flexometers such as the one seen in figure 3 utilize a gravity needle within the device to
determine degree of motion of major segments [23]. The instrument is fastened to the lateral
side of the upper leg (approximately 20 cm proximal to the knee joint) and the center of the
dial aligned with the tip of the greater trochanter of the femur. While the subject moves into
knee flexion, the movement of the gravity needle within the flexometer provides an estimate
Figure 3. Knee Flexometer used in a partial weight bearing task
The electromagnetic tracking system is used to measure relative motion of limb segments
in real time without requiring a line of sight. While there may be benefits to using this
system, its use was not feasible in this study as the metal of the PWB setup would interfere
with the electromagnetic tracking system causing it to work improperly.
Electrogoniometers are designed in various forms. One form involves two adherent
pieces, one that adheres to the femur and the other that adheres to the tibia along the limb line
and are connected by a spring which contains a strain gauge (see figure 4).
Figure 4. One elecrogoniometer configuration which measures joint angle with the strain gauge located in the connecting spring
While this setup would prevent problems due to constant removal and placement of the
interference with the neoprene sleeve, as the sleeve would interfere with joint angle
measurements by the spring if the sleeve were to be placed on top of the electrogoniometer.
This study instead utilizes an electrogoniometer with a potentiometer center piece and two
linkages that are placed along the femur and tibial lines. The apparatus lies on top of the
neoprene sleeve once it is applied and is rigid enough that the sleeve does not affect its
ability to accurately measure joint angles (see Figure 12).
2.4.3 Real and Absolute Error Measurements
Additionally, the method of data analysis can vary. Some studies compare real errors,
while others compare absolute errors. While real error calculations consider both direction
and magnitude, absolute errors consider only magnitude because the absolute value of the
real error is taken, and the concept of overshooting or undershooting target angles is not
relevant. The error term variations are what provide information about the precision of angle
reproduction, and this precision can be described in terms of error standard deviations.
Several approaches have been used to match the target angle: active matching with the same
leg, active matching with the contralateral leg, representation of the perceived angle on a
visual analogue model, active tracking with the contralateral limb, and passive matching with
the same leg in which case the subject indicates when they have reached the index angle by
depressing a switch or providing verbal cues[2, 3, 9-12, 24-27].
As a result of differences in experimental techniques and methods of data analysis, it is
difficult to compare joint position sense across various studies. One study by Beynnon et al.
tested several combinations of joint position sense techniques and analyzed both the real and
provide precise and repeatable results, this analysis technique may fail to find differences that
exist when the absolute error score is used instead.
2.5 Non-weight bearing vs. Weight-bearing
Another concern for investigators is whether their desired method of proprioception
measurement should be performed under non weight-bearing or weight-bearing conditions.
Researchers in recent years have begun to increasingly recommend weight bearing over
nonweight bearing tasks during joint position sense testing[25]. The argument is that weight
bearing tasks involve more cutaneous, muscular and articular mechanoreceptors than the
alternative nonweight bearing tasks. Several studies have looked at the significance of
weight bearing during static and dynamic joint position sense testing [24-26]. However,
most studies will also evaluate the nonweight bearing task because some lower limb
functions such as the swing phase of walking are nonweight bearing [24, 26]. One study by
Stillman et al found position sense to be significantly more accurate in the weight bearing
task than in the nonweight bearing [26]. This particular study found a significant difference
in the accuracy of angular repositioning between weight bearing and nonweight bearing with
less deviation from the predetermined angle during the weight bearing task. One possible
explanation is that while bearing weight, muscular and articular proprioceptors within the
joint itself provide feedback regarding position and motion unlike the nonweight bearing
task, where cutaneous receptors play the major role with interjoint receptors having little to
no affect on proprioception. Specifically, Golgi tendon organs are excited due to muscle
activation and receptors in the articular cartilage and menisci are excited by joint
Additionally, some studies prefer to test in a full weight bearing (FWB) position rather
than in a PWB position because of the increased accuracy of joint position sense. A study
by Bullock-Saxton set out to identify the influence of age on knee joint position sense
accuracy and compare this accuracy during full and partial weight bearing conditions [25].
Subjects were divided into three age groups and it was determined that subjects in all three
groups performed better in the full weight bearing (FWB) than in the partial weight bearing
(PWB). While a FWB condition may have produced more accurate results than the partial
weight bearing condition, we elected to utilize the PWB condition in our study because
patient populations that may be tested in the future may experience less pain in the PWB
condition.
2.6 Active vs. Passive Knee Positioning
Various approaches to the assessment of joint position sense have been used which include
the degree of joint loading, how the subject indicates knowledge of the position, initial joint
movement to the target angle, and lastly how the joint is repositioned (active or passive).
Each of these approaches could influence the degree of sensory input provided when the
subject is required to make a judgment about joint position sense. Many experiments
involving joint position sense have used NWB conditions and reproduction of a passively
attained index angle. Additionally, functional weight bearing tests in which active
reproduction of an actively attained criterion angle have also been used to determine joint
position sense. A study by Beynnon et al. tested seven different joint position sense
techniques for knee flexion and extension in four different groups of subjects [22]. The
seven different techniques were combinations of passive or active positioning into flexion or
or standing subject position. The investigators found that the combination of passive
positioning from flexion into extension followed by active extension while seated was the
most accurate and repeatable.
It is thought that with active reproduction increased motor units are recruited causing
increased activation of the muscle spindles, thereby possibly enhancing joint position acuity
further. As a result, this study will utilize active reproduction of both an actively produced
criterion angle (PWB) and a passively produced criterion angle (NWB).
2.7 Knee Sleeve
An additional component of this study is determining the effect of wearing a neoprene
knee sleeve on proprioception, as numerous studies have shown proprioception improves
through its use [9-12, 27, 28]. One study in particular demonstrated an improvement in joint
position sense in the active, nonweight bearing task, but not in the active, weight bearing task
when wearing a knee sleeve [10]. These results agreed with those from a previous study by
Birmingham and may be related to an increase in muscle activity and joint compression
resulting from increased signals of sensory receptors demonstrated during weight bearing
activities [27]. It is likely that improved proprioception during weight bearing results more
from deep tissue receptors as they contribute a greater percentage of overall proprioceptive
input during weight bearing than NWB. Most of the current research focuses on the ability
of knee braces to improve proprioception in the anterior cruciate deficient or impaired knee.
Studies have suggested that the true benefits of knee functional braces are not through
2.8 Stochastic Resonance
Stochastic resonance is an idea in which nonlinear system responses to weak input signals
are optimized with the presence of a specific non-zero level of noise(mechanical or
electrical). It is thought to work by altering the transmembrane potential of neurons, causing
a depolarization of the cell. This depolarization lowers the threshold, making it more likely
that an action potential will result. Somatosensation is responsible for providing feedback
regarding position and movement and deficits in somatosensation can lead to postural
instability. Recently, the idea of stochastic resonance has been tested as a means of
enhancing somatosensory function. In a study by Cordo, muscle-spindle receptor sensitivity
to weak movement signals was enhanced by the introduction of noise through the tendon of
the parent muscle [6]. The idea of enhanced somatosensory function through the use of
stochastic resonance has been tested in various subject populations including diabetics, stroke
patients, the elderly, patients with Parkinson’s disease, and patients with functional ankle
instability[7, 13, 29, 30].
Priplata et al. found that postural sway was reduced with the application of mechanical
noise in stroke, diabetic and elderly subjects (figure 5). They also reported that higher levels
of baseline postural sway were correlated with greater improvements in balance control with
the applied noise [13]. A study by Ross et al. concluded that stochastic resonance stimulation
might be an alternative therapy for functionally instable ankles since this stimulation may
improve dynamic stability quicker than coordination training alone [29]. Haas, on the other
hand, found no significant improvements in leg proprioception with the application of
Figure 5. The reduction of postural sway with the application of a vibratory noise signal in a study by Priplata et al. investigating diabetic and elderly patients (left)[13]. Gravelle et al. investigated stochastic
electrical stimulation applied at the knee (right)[7].
Additionally, Gravelle et al. investigated the effects of stochastic electrical stimulation
signals specifically applied at the knee and found a reduction in center of pressure trajectory
[7]. Specifically, the medial-lateral and anterior-posterior centers of pressure were reduced.
A reasonable question may be how stochastic resonance works to improve balance since
balanced is linked with proprioception. The relationship of balance and proprioception is
that balance involves both proprioception (afferent) and a motor output (efferent) component.
Reduced sway is believed to be due to enhanced proprioception which could be due to
stochastic resonance. Stochastic resonance is thought to cause small changes in receptor
transmembrane potentials which depolarize the nerve cells, bringing them closer to threshold
and making it more likely than an action potential will result. A study by Collins et al.
found increased cutaneous detection of subthreshold indentation while subthreshold vibration
was applied [31]. In this study, indentations were made to the tip of each subject’s right
stimulus plus noise. The subjects were instructed to indicate when they detected the
stimulus. The investigators quantified the percentage of trials for which a subject correctly
identified the presentation of stimulus or no stimulus and this was taken as % correct. The dashed line in Figure 6 indicates a significance level which shows that up to a certain input
noise level, accuracy of detection is significant but then significance is lost if excessive noise
is applied.
Figure 6. Increased cutaneous detection with the application of subthreshold noise. [31]
Another study by Cordo et al. supports this concept by showing increased relative muscle
spindle output with the application of subthreshold tendon vibration [6].
The investigators of this study recorded the firing activity of individual muscle-spindle
afferents from both the wrist and hand extensor muscles from the radial nerve in healthy
human subjects. Random noise was applied by a tendon stimulator to stretch the muscle.
Noise intensity was varied between trials. The signal-to-noise ratio (SNR) was calculated
and defined as the ratio of the strength (area) of the signal peak to the mean amplitude of the
background noise at the specific input noise frequency. The output signal-to-noise assesses
the coherence of the system response. Figure 7 indicates that as input noise intensity
increased, the output SNR rapidly increased to a peak and then slowly decreased. Therefore,
in the presence of a specific non-zero level of noise, the sensitivity of muscle spindle
receptors to weak input signals is optimized.
Additionally, the exact placement of the electrodes which deliver the electrical stimulation
is important. To date, no research has been done on the optimal placement of stimulus
electrodes. However, acupuncture therapy as a treatment for symptomatic knee OA can be
referenced for location of optimal treatment of pain. Three points around the knee joint were
indicated as electroacupuncture points for indications of knee pain or motor impairment of
the knee [32]. They are yanglinquan, yinlinquan, and dubi which are the inferior-lateral,
inferior-medial, and superior-lateral areas of the knee joint, respectively. A fourth point, the
superior-medial was added by the investigators to complete the paired orientation of the two
electrode pairs.
2.8.1 Lasting Effects of Stochastic Resonance
While the immediate efficacy of stochastic resonance has been explored in multiple
studies, there has not been an investigation into the potential long term effects of this therapy.
hope to determine if there is any indication of sustained effects of the stimulation.
Presumably, if there are lasting effects one would expect errors to decrease for the control
condition when the control condition is later in the sequence of conditions presented to the
subject.
2.8.2 Additional effects of Electrical Stimulation
In addition to improving proprioception, there may be other effects of this therapy. One
study which used an electrically coupled knee brace looked at pulsed electrical stimulation
(PES) to treat general knee OA [33]. Before beginning the 3 month study, the investigators
looked at a 1 month randomized, double-blind, placebo-controlled trial which showed that a
prototype device for delivering the PES to the knee improved symptomatic OA pain,
physician global evaluation, and patient knee function assessment. Unfortunately, the precise
method of action of PES in human knee OA has yet to be determined, but it is believed to be
by way of influencing cartilage metabolism.
Electrical stimulation may also prove beneficial in other applications that suffer from
abnormal proprioception besides OA. One study indicated Parkinson’s patients suffered
from proprioceptive deficits [30]. Additionally, patients who have had a total joint
replacement as well as patients who have had intraarticular fracture may suffer from
proprioceptive deficits if neurological pathways are affected. Also, one study demonstrated
less accurate and less consistent knee joint position sense in people suffering from
patellofemoral pain syndrome compared to control subjects [34]. There are many injured
populations, including the ones previously mentioned, which could possibly benefit from
2.9 Current Osteoarthritis Therapies
Currently, there are several options for treating osteoarthritis. Acetaminophen is the initial
drug of choice for systemic treatment of symptomatic OA of the knee. Also, the use of
topical analgesics is an option. Capsaicin cream or methylsalicylate are appropriate either
together or as separate remedies. If pain does not subside with the above mentioned
treatments, the use of nonsteroidal antiinflammatory drugs (NSAIDS) is an option.
However, the use of NSAIDS can lead to gastric complications.
Other treatment options include physical therapy exercises and treatment programs,
cortisone injections, and the most extreme option is total joint replacement [35, 36].
Additionally, acupuncture is a current symptomatic treatment for OA in Asian countries and
increasingly in western countries [32]. Research into the mechanism of acupuncture pain
relief has produced two widely accepted theories: 1. activation of the gate control system
and 2. stimulation of the neurochemical release in the central nervous system. Acupuncture
treatment has been shown to increase endorphin production which is why it is deemed an
effective treatment for symptomatic OA.
While physical therapy programs have been shown to improve function and cortisone and
acupuncture treat one of the disease symptoms by reducing pain, none of these options treat
the disease itself. If abnormal loading of the knee joint is a key contributor to the progression
of disease with OA, then improving proprioception through electrical stimulation may be an
effective disease modifying therapy. If proprioception is improved, this may lead to more
normal joint loading and less wear of the knee joint.
3. Research Design and Methods
3.1 Research Design Specific Aims and Hypothesis
The objective of this project is to evaluate proprioception in the normal knee under various
combinations of sleeve and electrical stimulation conditions.
AIM 1: To determine whether random subthreshold electrical stimulation applied at the normal knee will improve proprioception. Previous studies have examined the effects of
stimulation in improving balance in the elderly and diabetic patients but have not yet looked
at improving proprioception through subthreshold electrical stimulation.
Hypothesis 1: We hypothesize that proprioception will be more accurate during the sleeve/stimulation condition compared to the no sleeve/no stimulation control condition.
AIM 2: To determine whether the application of electrical stimulation improves proprioception beyond that seen by a neoprene knee sleeve alone.
Hypothesis 2: We hypothesize that proprioception will improve with the application of electrical stimulation and sleeve beyond the improvement seen with the sleeve alone.
AIM 3: To characterize how improvements in proprioception with the combinations of sleeve/no sleeve and stimulation/no stimulation conditions differ with a partial weight
Hypothesis 3.1: We hypothesize that proprioception will be more accurate during the sleeve/stimulation condition than the no sleeve/no stimulation control condition in the partial
weight bearing task.
Hypothesis 3.2: We also hypothesize that proprioception will be more accurate during the sleeve/no stimulation condition than the no sleeve/no stimulation control condition in the
nonweight bearing task.
3.2 Institutional Review Board
This study was approved by The University of North Carolina at Chapel Hill’s
Institutional Review Board. An initial application for approval was submitted January 8,
2007 and was reviewed by the board February 5, 2007. After reviewing the application, the
IRB stated there were a few minor contingencies to be addressed prior to full approval.
These concerns were addressed, changes were made to the application and full approval was
granted on February 26, 2007 with expiration set for February 26, 2008.
3.3. Subject Information
3.3.1. Recruitment
Subjects were recruited from the student body population at UNC Chapel Hill. Upon
completion of a statistical power analysis, we determined that testing 24 subjects would be
sufficient to yield an angle reproduction improvement of 30% with a standard deviation of
the absolute error of angle reproduction of 50% of the mean. A power of 0.8 and
with regard to gender, 12 males and 12 females were recruited for participation. Before
beginning the study, four subjects were tested in order for the investigator to finalize the
equipment setup as well as steps for each task. The data acquired from these four “practice”
subjects was not used for any statistical calculations nor is it included in the results of this
study.
3.3.2. Exclusion Criteria
A mass email was sent out to the UNC Chapel Hill student body seeking participation of
subjects meeting the following criteria:
1. No history of functional instability of the knee joint
2. No current knee injuries or functional instability that limits knee function 3. Subjects were physically active (At least 1.5 hours/week of cardiovascular or
resistance training).
4. Subjects were between the ages of 18-35 years old.
5. No signs or symptoms of knee injury (swelling, loss of function)
6. No known neurological conditions which may prevent the subject from sensing
motion or feeling pain
7. No previous knee surgery
8. Subjects were required to not be pregnant
9. No history of cardiac arrhythmia
10.No history of gait or postural disorders, seizures, diabetes, fainting, peripheral neuropathy, stroke or motion sickness
11.Subjects were required to not have a cardiac pacemaker or drug delivery pump
Exclusion of subjects older than 35 years was necessary because of the amount of age-related
joint degeneration in a subject at this age. Even in a subject with no previous injuries, a
subject greater than 35 years of age may have a preexisting proprioceptive deficit without
their knowledge. This study focused on normal subjects with no proprioceptive deficits.
3.3.3. Study Questionnaire
Each subject was asked to complete a questionnaire prior to the start of the study (see
the amount of physical activity per week (in hours), as well as questions regarding the
exclusion criteria previously mentioned. Collection of subject information such as age,
weight, etc. allows the investigator to form further conclusions regarding proprioceptive
acuity in relation to subject demographics. It also opens the door for future determinations
about gender based differences in relation to similar studies.
3.4. Study Design
Subjects had their proprioception evaluated while performing both a partial weight bearing
(PWB) and a nonweight bearing (NWB) task. A PWB task was used instead of a full weight
bearing task, as during future studies with an OA population, the subjects may not tolerate
full weight bearing because of knee pain. Testing was performed on the subject’s dominant
knee, where dominance was defined as the limb used to kick a soccer ball. During all tasks,
the subject was either actively or passively moved to a target angle of 30 degrees for the
“teaching” task. Upon reaching this position, the subject was asked to actively reproduce this
angle. Similar studies have used target angles in the range of 20 to 40 degrees because this
range simulates stance phase flexion during walking, and is reported to be strongly associated
with proprioceptive feedback during normal walking [3]. To prevent any memorization
effect of the target angle, a “dummy” 60 degree target angle was also incorporated into the
PWB test sequences and a “dummy” 50 degree target angle was incorporated into the NWB
test sequences using 3 different staging patterns yielding 24 testing sequences (see Table 2).
Both proprioceptive tests were carried out under the following four conditions: no electrical
stimulation/no sleeve, electrical stimulation/no sleeve, no electrical stimulation/sleeve, and
using a counterbalance design. Table 1 shows the 8 test sequences that were used for the
four conditions.
A B C D
1 +E/-S -E/-S -E/+S +E/+S
2 -E/+S +E/+S -E/-S +E/-S
3 -E/-S +E/-S +E/+S -E/+S
4 +E/+S -E/+S +E/-S -E/-S
5 +E/-S -E/-S +E/+S -E/+S
6 +E/+S -E/+S -E/-S +E/-S
7 -E/+S +E/+S +E/-S -E/-S
8 -E/-S +E/-S -E/+S +E/+S
Table 1. Listing of the 8 test sequences combining the 4 test conditions. A-D represent different stages of the test sequence. Note: +E=electrical stimulation, -E=no electrical stimulation, +S=sleeve on, -S=sleeve off
These sequences were designed to allow for the sleeve to remain on the subject once put in
place in order to minimize the times the sleeve was placed and removed. In addition, these
test sequences assured that each testing condition occurred with equal incidence at all stages
of the sequence (i.e. elimination of the potential for an order effect). Also, by
PWB/ 1st Task 2nd Task
Sex NWB Sequence A B C D E F Sequence
M PWB 1 1 +E/-S 60deg -E/-S 60deg -E/+S +E/+S 23 M PWB 2 2 -E/+S 60deg +E/+S 60deg -E/-S +E/-S 21 M PWB 3 3 -E/-S 60deg +E/-S 60deg +E/+S -E/+S 22 M PWB 4 4 +E/+S 60deg -E/+S 60deg +E/-S -E/-S 24 M PWB 5 5 +E/-S 60deg -E/-S +E/+S 60deg -E/+S 19 M PWB 6 6 +E/+S 60deg -E/+S -E/-S 60deg +E/-S 20 M NWB 7 7 -E/+S 50deg +E/+S +E/-S 50deg -E/-S 17 M NWB 8 8 -E/-S 50deg +E/-S -E/+S 50deg +E/+S 18 M NWB 9 1 +E/-S -E/-S 50deg -E/+S 50deg +E/+S 14 M NWB 10 2 -E/+S +E/+S 50deg -E/-S 50deg +E/-S 13 M NWB 11 3 -E/-S +E/-S 50deg +E/+S 50deg -E/+S 16 M NWB 12 4 +E/+S -E/+S 50deg +E/-S 50deg -E/-S 15 F PWB 13 1 +E/-S 60deg -E/-S -E/+S 60deg +E/+S 10 F PWB 14 2 -E/+S 60deg +E/+S -E/-S 60deg +E/-S 9 F PWB 15 3 -E/-S 60deg +E/-S +E/+S 60deg -E/+S 12 F PWB 16 4 +E/+S 60deg -E/+S +E/-S 60deg -E/-S 11 F PWB 17 5 +E/-S 60deg -E/-S 60deg +E/+S -E/+S 7 F PWB 18 6 +E/+S 60deg -E/+S 60deg -E/-S +E/-S 8 F NWB 19 7 -E/+S 50deg +E/+S 50deg +E/-S -E/-S 5 F NWB 20 8 -E/-S 50deg +E/-S 50deg -E/+S +E/+S 6 F NWB 21 5 +E/-S -E/-S 50deg +E/+S 50deg -E/+S 2 F NWB 22 6 +E/+S -E/+S 50deg -E/-S 50deg +E/-S 3 F NWB 23 7 -E/+S +E/+S 50deg +E/-S 50deg -E/-S 1 F NWB 24 8 -E/-S +E/-S 50deg -E/+S 50deg +E/+S 4
Table 2. Listing of the 24 total test sequences that incorporate the dummy target angles for the PWB and NWB tasks. A-F represent different stages of the test sequence.
The dummy target angle stages used the electrical stimulation and sleeve condition of the
previous stage of the test sequence. One sequence was assigned to each subject for his/her
first task (PWB or NWB). The second task was then completed with the sequence number
shown in Table 2 above. To illustrate this point, Male #1 performed the following test order
for the first task sequence: +E/-S, 60deg., -E/-S, 60deg., -E/+S, +E/+S, and the following test
order for the second task sequence: -E/+S, +E/+S, 50deg, +E/-S, 50deg, -E/-S. This 2nd task
sequence was designed such that the first test condition was the exact opposite of the
condition used in the first stage of the 1st task sequence. Half of the subjects (both male and
female) performed the PWB task first, while the other half performed the NWB task first.
gender that each testing condition occurred with equal incidence in each of the stages of the
testing sequence. Each subject performed 3 trials at each testing condition for each task,
PWB or NWB for a total of 36 trials.
3.5. Study Procedure
Upon recruitment of each subject, the investigator determined whether the subject met the
inclusion criteria. The subject then completed the study questionnaire and signed their
informed consent (Appendix A, D). The subject then began the testing steps.
3.5.1. PWB steps
1. The PWB steps were demonstrated by the investigator while seated
on the sliding platform and the subject was instructed on what will follow.
2. The subject was then seated on the sliding platform in a partial weight bearing position, the investigator found the lateral and medial knee joint space, 2cm above and below, and placed the electrodes. The electrodes were not removed between tasks. 3. The subject was positioned on the sliding platform and the foot of
the dominant limb was placed on the heel wedge.
4. The neoprene knee sleeve was placed over the knee (if applicable
for the first task condition).
6. Once the sleeve was in place and the subject was comfortable, the
electrogoniometer was positioned (potentiometer was aligned with the lateral femoral condyle), and the straps were adjusted.
7. The investigator ensured all equipment was connected and reading
correctly.
8. The subject was positioned with his/her limb that was not being
tested tucked and resting on the metal extension to the platform.
9. The headphones and blindfold were then placed on the subject and
the electronic switch was handed to them.
10.Practice runs were performed until the subject was comfortable with the procedure.
11.Once comfortable with the procedure, the subject was then actively moved into flexion until instructed to stop by the investigator.
12.The subject then depressed the electronic switch and maintained
this position for 5 seconds.
14.White noise in the headphones was started after 5 seconds of the subject resting at full extension.
15.The investigator then tapped the subject on their nontest knee and this instructed the subject to reproduce the position.
16.Once the subject reached what they perceived to be the target angle, he/she depressed the switch and maintained the position for 5 seconds.
17.After 5 seconds, the subject then returned to full extension. 18.Steps 11 through 17 were repeated three times for each of the
conditions.
19.If the PWB task was the last task, the investigator determined the threshold level of stimulus by increasing the stimulus level and having the subject tell the investigator at which point they felt the stimulus.
3.5.2. NWB steps
1. The investigator ensured the electrodes, electrogoniometer, and knee sleeve (if applicable) were in place.
2. The subject was positioned on the bench seated upright with
his/her legs hanging over the edge of the bench and their knee popliteal space a few centimeters off the bench edge to eliminate tension cues.
3. The investigator ensured all electronic equipment was reading
properly and that the angle of knee flexion at rest was within 70 to 80 degrees.
4. The subject was instructed on the steps that were to follow.
5. A practice trial was performed by passive movement of the
subject’s knee by the investigator into extension to a certain angle. 6. The subject was instructed to depress the time switch once the
target angle was reached and the investigator said “OK”.
7. Upon depression of the switch, the knee was held in place by the
investigator for 5 seconds and was then brought back to the original, resting position.
8. After 5 seconds in the resting position, the investigator began the headphone noise and tapped the subject on their nontest knee to signal them to begin the reproduction part of the trial.
9. Once the subject was tapped, they actively moved to the flexion
angle which they perceived to be the same as the target angle and depressed the electronic switch once they were in that position. 10.The subject maintained the position for 5 seconds and then
returned to the relaxed position to end the practice trial.
11.The investigator ensured the subject understood the task, at which point testing began.
20.If the NWB task was the last task, the investigator determined the subject’s threshold level of stimulus by increasing the stimulus level and having the subject tell the investigator at which point he/she detect the stimulus.
3.5.3. Stimulus Threshold to Detection
Upon completion of all study tasks, the stimulus threshold to detection was determined for
each subject using a component of the Labview VI designed by Afferent, Inc. The purpose
of determining the subject’s threshold for stimulus detection was to ensure their detection
level was higher than the 50 µA test level. Initially, the subject’s threshold for detection was
to be determined before the study began, but we felt this would provide the subject with false
sensations of detecting the stimulus during the test. The stimulus was administered at
0.1milliAmps/Volt within the “Test Stimulus” program and each electrode pair, inferior and
superior, was tested separately. Once the program was set to run, the investigator would
enter an electrical stimulus amplitude which would provide a threshold value in microAmps.
For example, a stimulus amplitude of 0.50 would correlate to a threshold value of 50
microAmps. The stimulus amplitude was continually ramped up by 0.10 until the subject
could detect the stimulus or until the value reached 150 microAmps, whichever came first.
All but 2 of the 26 subjects had detection levels higher than the test stimulus level. These 2
subjects were excluded from the study because they could detect the 50 µA test level.
3.6. Equipment
3.6.1. PWB setup
Both the PWB and NWB joint proprioceptive tests evaluated the subjects’ joint position
As previously mentioned, a PWB task was preferred over a FWB task because future studies
may involve OA patients, and FWB tasks could be painful in this population. During the
PWB task, each subject was positioned on a sliding, relatively frictionless platform that was
reclined approximately 20 degrees relative to the horizontal. Similar to other studies, a
supporting foam heel wedge was placed under the heel of the test limb, placing the heel in
slight plantar flexion in order to decrease tension cues generated by the triceps surae during
the knee flexion tests [3, 25]. The non-test limb was flexed at the hip and knee, allowing the
foot to rest upon the sliding platform. As a result, the subject simulated single leg stance in a
partial weight bearing condition (see figure 8).
Figure 8. Partial weight bearing setup
During the knee flexion tests, the target angle of 30 degrees was chosen with a 60 degree
“dummy” angle incorporated into the sequence. This target angle was chosen to simulate the
starting position was in full knee extension in single leg stance, and the subjects moved into
flexion during each trial.
3.6.2. NWB setup
Unlike the PWB setup, during the NWB setup the subject was seated on an upright bench
and the knee was tested moving from a starting position of approximately 70o- 80o flexion
into extension (Figure 9). This test simulated the positioning of the knee during the swing
phase of gait prior to foot contact on the ground. The target angle for this task was also
chosen to be 30 degrees but a 50 degree “dummy” angle was incorporated into these
sequences rather than the 60 degree angle previously mentioned for the PWB task. The 50
degree dummy angle was chosen because during the NWB task, the subjects’ joint angle at
rest was approximately between 70 and 80 degrees rather than 90 degrees.
![Figure 1. The osteoarthritis cycle theory [4]](https://thumb-us.123doks.com/thumbv2/123dok_us/8215003.2177949/18.918.142.789.539.969/figure-the-osteoarthritis-cycle-theory.webp)