Available online throug
ISSN 2229 – 5046
MAXIMIZING NETWORKS LIFE TIME USING ENERGY EFFICIENT ENHANCING
FORWARD AWARE FACTOR ROUTING PROTOCOL ON COOPERATIVE
AND NON-COOPERATIVE FOR WIRELESS SENSOR NETWORKS
SRIDEVI. S*
Research Scholar, Department of Mathematics,
K. N. Government Arts College, Thanjavur, India.
VINOBA. V
Research Adviser, Department of Mathematics,
K. N. Government Arts College, Thanjavur, India.
(Received On: 06-08-17; Revised & Accepted On: 31-08-17)
ABSTRACT
T
he most interesting and challenging research areas in WSNs is maximizing networks lifetime using energy efficient enhancing forward aware routing on cooperative and non-cooperative or wireless sensor networks. Energy conservation is the primary challenge for WSNs and utilizing the energy efficiently during routing is an essential requirement and is a demanding task for all other research areas in WSNs. maximizing the Energy consumption and enhancing the lifetime of the network depending on routing protocols on cooperative and non-cooperative or wireless sensor networks are the main objectives in designing WSNs since the sensor nodes are battery operated and cannot be replenished or recharged frequently. Here A Routing Protocol (ACORP) is proposed for increasing the Wireless Sensor Network lifetime using Ant Colony Optimization meta heuristics.Key words: cooperative and non-cooperative game theory. Energy efficient routing protocol, wireless sensor networks.
1. INTRODUCTION
Aiming at the limited energy physical characteristics of wireless sensor networks, we apply cooperative and non-cooperative game theory to solve the power control problem to reduce energy feeding in wireless sensor networks. In this paper a distributed cooperative and non-cooperative game theory power control set of rules based on cooperative and non-cooperative game theory under incomplete information is proposed which adopts signal-to-interference noise ratio (SNIR) as utility function. The purpose of cooperative and non-cooperative game theory power control set of rules for cooperative and non-cooperative game theory is to achieve the largest utility by optimal power control scheme, thus improve the total network energy efficiency. Moreover, Bayesian Nash equilibrium theorem is introduced to study the existence and uniqueness proof of Nash equilibrium set of rules simulation results show that there exist points for each of the cost functions considered which give the maximum net utility given the strategies taken by all other nodes as fixed. And the proposed set of rules efficient and achieve better performance.
2. COOPERATIVE AND NON-COOPERATIVE GAME THEORY ROUTING PROTOCOLS IN WSNS
In this section, we survey the state-of-the-art routing protocols for WSNs. In general, routing in WSNs can be divided into °at-based routing, hierarchical-based routing, and location-based routing depending on the network structure. In °at-based routing, all nodes are typically assigned equal roles or functionality. In hierarchical-based routing, however, nodes will play different roles in the network. In location-based routing, sensor nodes' positions are exploited to route data in the network. A routing protocol is considered adaptive if certain system parameters can be controlled in order to adapt to the current network conditions and available energy levels. Furthermore, these protocols can be classified into multipath-based, query-based, negotiation-based, QoS-based, or coherent-based routing techniques depending on the protocol operation. In addition to the above, cooperative and non-cooperative game theory routing protocols can be classified into three categories, namely, proactive, reactive, and hybrid protocols depending on how the source ends a route to the destination. In proactive cooperative and non-cooperative game theory protocols, all routes are computed before they are really needed, while in reactive protocols, routes are computed on demand. Hybrid protocols use a
Corresponding Author: Sridevi. S*
combination of these two ideas. When sensor nodes are static, it is preferable to have table driven cooperative and non-cooperative game theory routing protocols rather than using reactive protocols. A significant amount of energy is used in route discovery and setup of reactive protocols. Another class of routing protocols is called the cooperative and non-cooperative game theory routing protocols. In cooperative and non-cooperative game theory routing, nodes send data to a central node where data can be aggregated and may be subject to further processing, hence reducing route cost in terms of energy use. Many other protocols rely on timing and position information. We also shed some light on these types of protocols in this paper. In order to streamline this survey, we use a classification according to the network structure and protocol operation (routing criteria). The Figure.3.1: Classification of WSN routing protocols.
Figure-3.1: cooperative and non-cooperative game theory Classification of Wireless Sensor Networks routing protocols.
In the rest of this section, we present a detailed overview of the main routing paradigms in WSNs. We start with network structure based protocols.
3. COOPERATIVE AND NON-COOPERATIVE GAME THEORY ENERGY AWARE ROUTING
The objective of energy-aware routing protocol, a destination initiated reactive protocol, is to increase the network lifetime. Although this protocol i; is similar to directed diffusion, it differs in the sense that it maintains a set of paths instead of maintaining or enforcing one optimal path at higher rates. These paths are maintained and chosen by means of a certain probability. The value of this probability depends on how low the energy consumption of each path can be achieved. By having paths chosen at different times, the energy of any single path will not deplete quickly. This can achieve longer network lifetime as energy is dissipated more equally among all nodes. Network survivability is the main metric of this protocol. The protocol assumes that each node is addressable through a class-based addressing which includes the location and types of the nodes. The protocol initiates a connection through localized flooding, which is used to discover all routes between source/destination pair and their costs; thus building up the routing tables. The high-cost paths are discarded and a forwarding table is built by choosing neighboring nodes in a manner that is proportional to their cost. Then, forwarding tables are used to send data to the destination with a probability that is inversely proportional to the node cost. Localized flooding is performed by the destination node to keep the paths alive. When compared to directed diffusion, this protocol provides an overall improvement of 25% energy saving and a 50% increase in network lifetime. However, the approach requires gathering the location information and setting up the addressing mechanism for the nodes, which complicate route setup compared to the directed diffusion.
3.1. Cooperative and Non-Cooperative Game Theory Power-Efficient Gathering in Sensor Information Systems (PEGASIS)
The aggregated form of the data will be sent to the base-station by any node in the chain and the nodes in the chain will take turns in sending to the base-station. The chain construction is performed in a greedy fashion. Simulation results showed that PEGASIS is able to increase the lifetime of the network twice as much the lifetime of the network under the LEACH protocol. Such performance gain is achieved through the elimination of the overhead caused by dynamic cluster formation in LEACH and through decreasing the number of transmissions and reception by using data aggregation. Although the clustering overhead is avoided, PEGASIS still requires cooperative and non-cooperative game theory adjustment since a sensor node needs to know about energy status of its neighbors in order to know where to route its data. In practical cases, sensor nodes use multichip communication to reach the base-station. Also, PEGASIS assumes that all nodes maintain a complete database about the location of all other nodes in the network. The method of which the node locations are obtained is not outlined. In addition, PEGASIS assumes that all sensor nodes have the same level of energy and they are likely to die at the same time. Note also that PEGASIS introduces excessive delay for distant node on the chain. In addition, the single leader can become a bottleneck. Finally, although in most scenarios, sensors will be fixed or immobile as assumed in PEGASIS, some sensors may be allowed to move and hence arrest the protocol functionality. An extension to PEGASIS, called Hierarchical-PEGASIS was introduced with the objective of decreasing the delay incurred for packets during transmission to the BS. For this purpose, simultaneous transmissions of data are studied in order to avoid collisions through approaches that incorporate signal coding and spatial transmissions. In the later, only spatially separated nodes are allowed to transmit at the same time. The chain-based protocol with CDMA capable nodes, constructs a chain of nodes, that forms a tree like hierarchy, and each selected node in a particular level transmits data to the node in the upper level of the hierarchy. This method ensures data transmitting in parallel and reduces the delay significantly. Such hierarchical extension has been shown to perform better than the regular PEGASIS scheme by a factor of about 60.
3.2. Cooperative and Non-cooperative Power Control Game
We formulate the users’ selfish behavior with a cooperative and non-cooperative game framework. Let G = [N, (Pi), {(ui)(. )}] denote the cooperative and non-cooperative power control (CANPC) game where N= {1,2,…N} is the index set for active users currently in power control networks, Pi is the strategy set, and {(ui)(. )} is the utility function of user i. each users selects a power level pi ε Pi. Let the power vector p = p1, p2,……….pN ε p denote the outcome of the cooperative and Non-cooperative Power Control Game in terms of selected power levels of all the users, where P is the set of all power vectors. The utility function demonstrates the strategic interdependence among users. The level of utility each user gets depends on its own power level and also on the choice of other players’ strategies, through the SINR of that user. We assume that each user’s strategy is rational, that is, each user maximizes its own utility in a distributed fashion. Formally, the CANPC game G is expressed as
maxpiεPi.ui( Pi, P−i), for all iεN, (1)
Where ui is given in (1) and 𝑃𝑖= {𝑝𝑖𝑚𝑖𝑛𝑝𝑖𝑚𝑎𝑥} is the strategy space of user i. In this game p is the strategy profile, and the strategy profile of i’s opponents is defined to be (P−i= P1, Pi−1, Pi+1, … … … P𝑁), so that P=( Pi, P−i). A similar notification will be used for other quantities.
Users i’s best response is Ɓ𝑖(P−i) = arg maxp
iεPi.ui( Pi, P−i), i.e., the Pi that maxui( Pi, P−i) given a fixedP−i. With the
best response concept, we can present the following definition for the Nash Equilibrium (NE) of CANPC game G.
Definition 1:Nash Equilibrium (NE) of CANPC game G
A strategy profile𝑝∗ is a Nash Equilibrium (NE) of CANPC game G if it is a fixed point response,
ui(𝑝𝑖∗,𝑝−𝑖∗ )≥ 𝑢𝑖(𝑝𝑖′,𝑝−𝑖∗ ) for any 𝑝𝑖′𝜀𝑃𝑖 and any user i.
The NE concept offers a predictable, stable outcome of a game where multiple agent with conflicting interests complete through self- optimization and reach a point where no player wishes to deviate. However, such a point does not necessarily exist.
Definition 2: Cooperative and Non-Cooperative Game Theory Energy efficiency
Sensor nodes are equipped with small non-rechargeable batteries (usually less than 0.5 A h and 1.2 V). Therefore, the efficient battery utilization of a sensor node is a critical aspect to support the extended operational lifetime of the individual nodes and of the whole network. A WSN routing protocol is expected to: (i) minimize the total number of communications involved in route discovery and data delivery, and (ii) distribute the forwarding of the data packets across multiple paths, so that all nodes can deplete their batteries at a comparable rate. This will result in the overall increase of the network lifetime.
3.3. Cooperative and Non-Cooperative Game Theory Best-effort and QoS-aware routing
3.4. Cooperative and Non-Cooperative Power Control Game Theory
A cooperative and Non-Cooperative Game Theory is based on the absence of coalitions in that it is assumed that each participant acts independently, without collaboration or communication without any of the others. Because transmission cooperative and non-cooperative power choice of transmission in wireless sensor networks in the problem of cooperative and non-cooperative power control game theory with incomplete information, we can have following result by using Bayesian Nash Equilibrium method.
Theorem 1: Nash Equilibrium exists and is unique in cooperative and non-cooperative power control game with incomplete information of transmission power control.
Proof: Let 𝑓𝑠𝑖(x) as the probability density function of 𝑠𝑖, assuming that node can carry out data transfer under any
large cooperative and non-cooperative power condition, that is when 𝑠𝑖→∞,node transmission probability is 1,so we
can have ∫ 𝑓𝑠
𝑖(x)
∞
0 dx = 1.
But cooperative and non-cooperative power control game theory in the real world, in order to reduce the payments as well as reduce cooperative and non-cooperative power costs, does not allow the node forward at any big cooperative and non-cooperative power value. So we should let transmission cooperative and non-cooperative power within a
certain range, we can assume that when cooperative and non-cooperative transmission power as 𝑠𝑖∈ [0,𝑝𝑖], the 𝑛𝑖 will
get the largest cooperative and non-cooperative networks utility. 𝑝𝑡 is the maximum power when a node transmits can
be given by
P (𝑝𝑡) = ∫ 𝑓𝑠
𝑖 𝑝𝑡
0 (x) dx (2)
The probability of no transmission is 1- P (𝑝𝑡). So the probability that any k nodes out of N nodes are active is given by
𝑝𝑛 = ∑ �𝑘 𝑛𝑘�(p (𝑝𝑡)𝑘) (1- 𝑝(𝑝𝑡)𝑁−𝑘) (3)
Then the expected cooperative and non-cooperative networks utility of the 𝑖𝑡ℎ node transmitting is given by
E[𝑈𝑖𝑛𝑒𝑡] = ∑𝑁𝑘=𝑜(𝑢𝑖(𝑠𝑖,𝑠−𝑖)− 𝐴(𝑠𝑖)) 𝑝𝑘 (4)
If the node is transmitting expected cooperative and non-cooperative networks utility is equation (5). If the node dose not transmit the expected cooperative and cooperative networks utility is 0. The expected cooperative and non-cooperative networks utility of any node is given by
𝐺𝑖(𝑝𝑡) = ∫ [𝑈𝑖(𝑝𝑡)− 𝑐(𝑥)]𝑓𝑠𝑖(𝑥) 𝑑𝑥 𝑝𝑡
𝑧𝑖
= 𝑈𝑖(𝑝𝑡) p(𝑝𝑡)∫ 𝑐𝑧𝑝𝑡 (𝑥)]𝑓𝑠𝑖(𝑥) 𝑑𝑥
𝑖 (5)
Let B ( 𝑝𝑡) =∫ 𝑐𝑧𝑝𝑡 (𝑥)𝑓𝑠𝑖(𝑥)𝑑𝑥,
𝑖 then the equation (8) can be written as
𝐺𝑖(𝑝𝑡) =𝑈𝑖(𝑝𝑡) p(𝑝𝑡)−B (𝑝𝑡) (6)
From the equation (9) we can see that when the actual transmission power reach the value of upper bound, we get same
expected utility, i.e., 𝑠𝑖= 𝑝𝑖. Thus 𝑝𝑖 is the power upper bound of nodes transmitting when the whole network can
achieve maximum utility? That is 𝑝𝑡 is the solution to following equation
𝑈𝑖(𝑝𝑡)−c(𝑝𝑡) = 0 (7)
Theorem 2: Nash equilibrium exists is unique in cooperative and non-cooperative game with incomplete information of transmission power control.
Proof: Let us suppose(𝑇1),(𝑇2) be transmission cooperative and non-cooperative game power of each node, of which
(𝑇1) is the solution to equation (10), (𝑇2) is any cooperative and non-cooperative game power, and (𝑇1)≠(𝑇2), then
the average cooperative and non-cooperative game power utility of the node when (𝑠𝑖) = (𝑇1) and (𝑠𝑖) = (𝑇2) as follows,
(𝐺𝑖)(𝑇1) = ∫ [𝑈𝑖(𝑇1)− 𝑐(𝑥)]𝑓𝑠𝑖(𝑥) 𝑑𝑥 𝑇1
𝑧𝑖 = [𝑈𝑖(𝑇1) 𝑃(𝑇1)− 𝐵(𝑇1)
(𝐺𝑖)(𝑇2) = ∫ [𝑈𝑖(𝑇2)− 𝑐(𝑥)]𝑓𝑠𝑖(𝑥) 𝑑𝑥 𝑇2
𝑧𝑖
= [𝑈𝑖(𝑇1) 𝑃(𝑇2)− 𝐵(𝑇2)
We can get the following equation
(𝐺𝑖)(𝑇1)−(𝐺𝑖)(𝑇2) = {[𝐶(𝑇1) 𝑃(𝑇2) − 𝐵(𝑇1)]−[𝐶(𝑇1) 𝑃(𝑇2)− 𝐵(𝑇2)]} (8)
(1) When (𝑇1)> (𝑇2) equation (11) can be written as
(𝐺𝑖)(𝑇1)−(𝐺𝑖)(𝑇2) =∫ [𝑈𝑖(𝑇1)− 𝑐(𝑥)]𝑓𝑠𝑖(𝑥) 𝑑𝑥 𝑇1
𝑧𝑖 − ∫ [𝑈𝑖(𝑇2)− 𝑐(𝑥)]𝑓𝑠𝑖(𝑥) 𝑑𝑥
𝑇2
𝑧𝑖
=∫ 𝐶𝑇𝑇1 (𝑇1)− 𝑐(𝑥)]𝑓𝑠𝑖(𝑥) 𝑑𝑥
2
Because C (𝑠𝑖) is monotone increasing function of power𝑠𝑖, when for all x< (𝑇1), we get c(x)<𝑐(𝑇1). Therefore
(𝐺𝑖)(𝑇1)−(𝐺𝑖)(𝑇2) > 0 When (𝑇1) <(𝑇2) equation (11) can be written as (𝐺𝑖)(𝑇1)−(𝐺𝑖)(𝑇2) =∫ [𝑈𝑖(𝑇1)− 𝑐(𝑥)]𝑓𝑠𝑖(𝑥) 𝑑𝑥
𝑇1
𝑧𝑖 − ∫ [𝑈𝑖(𝑇2)− 𝑐(𝑥)]𝑓𝑠𝑖(𝑥) 𝑑𝑥
𝑇2
𝑧𝑖
=∫ 𝐶𝑇1 (𝑇1)− 𝑐(𝑥)]𝑓𝑠𝑖(𝑥) 𝑑𝑥
𝑇2
Then (𝑇1) <𝑥<(𝑇2), we get C (𝑇1) < C(𝑥). Therefore (𝐺𝑖)(𝑇1)−(𝐺𝑖)(𝑇2) >0
Based on the above two cases, we can see that for any power (𝑇2), if for all (𝑇2)≠(𝑇1), then (𝐺𝑖)(𝑇1) > (𝐺𝑖)(𝑇2), so
(𝑇1) is the selected cooperative and non-cooperative power when the network achieve the maximum net utility, no
cooperative and non-cooperative power expect for (𝑇1) can provide expected utility. That is (𝑇1) is the solution of
incomplete information cooperative and non-cooperative power control of Nash equilibrium as well as the unique solution.
4. SIMULATION AND PERFORMANCE ANALYSIS
The proposed algorithm has been simulated and validated through simulation. The sensor nodes are deployed randomly
in a 100 ×100 meters square and sink node deploy at the point of (50, 50), the maximum transmitting radius of each
node is 80m; other simulation parameters are displayed in Table.1. In this section, we first discuss utility factor and
pricing factor’s influences on transmitting power, then evaluate the algorithm of NGLE algorithm and compare it with other existing algorithm.
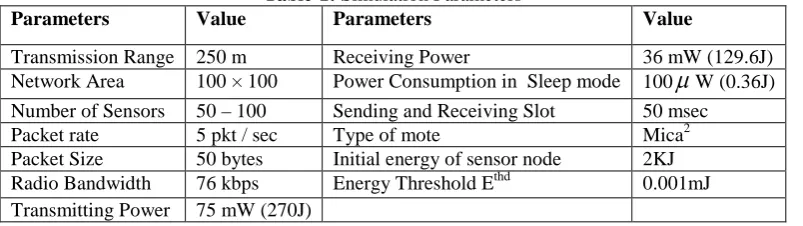
Table-1: Simulation Parameters
Parameters Value Parameters Value
Transmission Range 250 m Receiving Power 36 mW (129.6J)
Network Area 100 × 100 Power Consumption in Sleep mode 100
µ
W (0.36J)Number of Sensors 50 – 100 Sending and Receiving Slot 50 msec
Packet rate 5 pkt / sec Type of mote Mica2
Packet Size 50 bytes Initial energy of sensor node 2KJ
Radio Bandwidth 76 kbps Energy Threshold Ethd 0.001mJ
Transmitting Power 75 mW (270J)
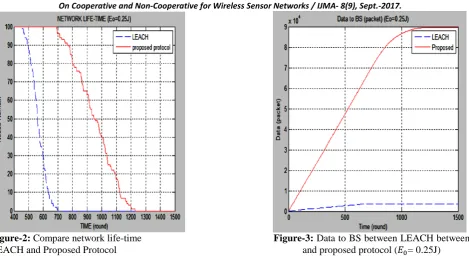
The Network Lifetime for each simulation is showed in Figure 1. These curves are showing that lifetime of network
for various routing protocols after 500 rounds, about 30% of nodes in the network are alive in the proposed REER routing protocol, but 1%, 7%, and 10% of nodes are alive in existing protocols LEACH, LEACH-M and HEED respectively. So the network lifetime is increasing about 80% with using of our model and algorithm.
Figure 2 shows the average delivery delay with increasing transmission rate. The average delivery delay means the average time delay between the instant the source sends a packet and moment the destination receives this packet.
Table-1: Comparison LEACH protocol and Proposed protocol with𝐸0 = 0.25J
Protocol Stability Network Instability
LEACH 440 700 250
Figure-2: Compare network life-time Figure-3: Data to BS between LEACH between
LEACH and Proposed Protocol and proposed protocol (𝐸0= 0.25J)
When the transmission rate is 1 packet per second, we can see that the average delivery delay of LEACH, LEACH-M is lower than the proposed REER protocol and HEED. This is because LEACH is always tries to discover a high speed path for forwarding packets. Since the transmission rate increases, the average delivery delay of LEACH increases significantly. This is because congestions occur at the intermediate nodes in LEACH. In the proposed protocol, when the packets reaches at destination, the relay or intermediate nodes have a lower forwarding probability than normal nodes by using multiple strategy. In the forwarding node selection game, the probability that a great amount of packets are forwarded by the same node is relatively low. Thus, the average delivery delay of our protocol does not significantly increase with an increase in transmission rate.
Figure 3 shows the Energy Consumption of the four protocols. For LEACH, LEACH-M and HEED protocols, the source always selects the node closest to the destination in the neighbor set. However, normally the closest node is the local superior decision, not the global optimal decision. For our protocol, in the forwarding node selection game, if some node has a lesser angle with the line formed by source and destination, it has the high probability to be the forwarding node. Thus, the proposed REER protocol consumes less node energy for transmitting data between the nodes.
Figure 4 shows the Packet Delivery ratio of proposed protocol is compared with existing protocols. The plot infers that the proposed REER protocol has better performance than LEACH, LEACH-M and HEED. With the increase of transmission rate, LEACH, LEACH-M and HEED always forward packets along the relay nodes by perimeter approach. This leads to a high probability of packet congestion around the relay node. In REER protocol, since the process of forwarding node selection is a game process, the source has lower probability to make the same candidate gain too much benefit from the game process. This is the reason the packet delivery ratio of our protocol does not significantly decrease with the increase of transmission rate.
Figure-6: Energy Consumption With various Figure-7: Packet Delivery rat is with various
Transmission Rate Transmission Rate
Figure 5 and Figure.6,shows the Energy Consumption with various transmissions. This is one of the major parameter to be considered in case of wireless sensor networks as the sensors sense information throughout the day the energy saving is very important, retransmission of each and every sensor should be reduced to make the power consumption will be low which is not fair in case of tiny sensor nodes. Remote application sensors are to charge through environment, like solar cells. Packet Delivery Ratio with various transmissions Rate is a very important metric for evaluating the network performance of the reliability mechanism of routing protocols. This makes the ratio of the total number of packets received by each subscriber node, up to the total number of packets generated by all nodes of the events to which the transmitter node has transmitted. It won’t consider duplicated or repeatedly transmitted packets received by transmitter nodes.
Figure.7, Figure.8, and Figure.9, shows the Energy Balance Factor with various transmissions. Energy Balanced Factor (EBF) of FAF increase slowly with light variation at first and keep a stability, then increase a little time, and return to 0 as the energy of the entire network is using up. In this network first death of node occur at the stage of 300 rounds. EBF is defined as the average of all nodes standard deviation based on residual energy. It’s the average value of the residual energy of all of the nodes. The result of simulation show that, proposed protocol in creed network life-time up 75% compared with LEACH protocol. To evaluate the effect of the proposed protocol, we use some following parameter to measure simulation results. Those are 10% Node Dead (TND), Haft Node Dead (HND) and Full Nodes Dead (FND).
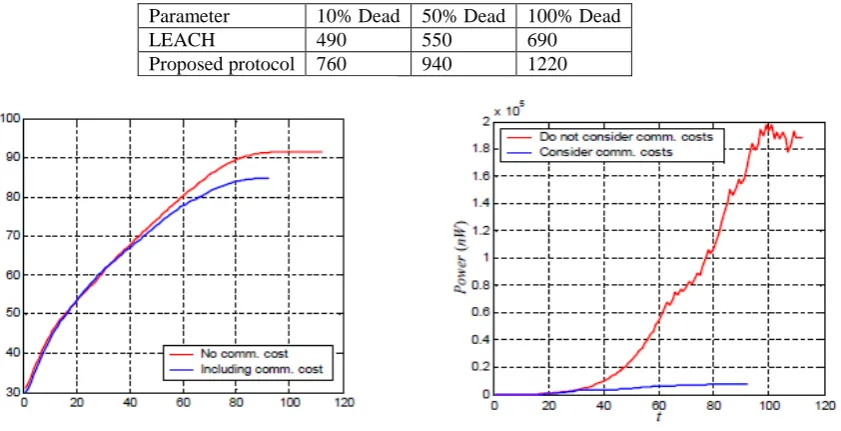
Table-3: Compare TND, HND and FND between LEACH and Proposed protocol with 𝑬𝟎= 0.25J
Parameter 10% Dead 50% Dead 100% Dead
LEACH 490 550 690
Proposed protocol 760 940 1220
Figure-8: Comparison of sensing coverage Figure-9: Comparison of communication costs
Table-4: Compare TND, HND and FND between LEACH and Proposed protocol with 𝑬𝟎 = 0.5J
Parameter 10% Dead 50% Dead 100% Dead
LEACH 960 1111 1280
Proposed protocol 1250 1600 2290
With initial energy 𝑬𝟎= 0.5J, the proposed protocol can make network lifetime increase, respectively 35%, 44% and
80%. We see that the proposed protocols perform better than LEACH protocol.
CONCLUTION
In this chapter, we introduce a Cooperative and Non-Cooperative Game Theory for extending sensor network lifetime. This approach improves the transmission success rate and decreases the transmission delays of packets. In the aspect of setting up the routing path, we consider the residual energy. We conclude the forwarding probability and payoff function of forwarding participants. We proposed a new routing protocol in order to enlarge the life-time of sensor networks. This protocol developed from LEACH protocol by considering energy and distance of nodes in WSN in CHs election. However, this protocol is only applied in the case of BS in the sensor area. But with BS is far from sensor area, we cannot apply this protocol. In the future, we will study the energy distribution of node in the case BS is far from the sensor area to improve the lifetime of the whole network. Finally, the Nash Equilibrium exists when it is assumed for minimum and maximum threshold for channel condition and power level. By using Non-Cooperative and cooperative Game Theory, the network lifetime is extended, that is after 500 rounds, 27% of nodes are alive where as 1%, 5% and 7% of nodes are alive in existing protocols LEACH, LEACH-M and HEED respectively. So the network lifetime is found to be increasing about 83% with the applications of our model and algorithm.
REFERANCES
1. Jamal N. Al-Karaki Ahmed E. Kamal, “Routing Techniques in Wireless Sensor Networks: A Survey” This
research was supported in part by the ICUBE initiative of Iowa State University, Ames, IA 50011, 2004.
2. I.F. Akyildiz, W. Su, Y. Sankara subramaniam, and E. Cayirci “Wireless sensor networks: a survey”, elseiver
publications : Computer networks, vol.38, no.4, pp.393–422, 2002.
3. Kemal Akkaya and Mohamed Younis, “A Survey on Routing Protocols for Wireless Sensor Networks”,
Adhoc Networks, Volume 3, issue 3, pp.325-349, May 2005,.
4. H.Deepa and Avan Kumar Das, “A Study on Routing Protocols in Wireless Sensor Network”, International
Journal of Computer Applications, Vol.72, No.8, pp.35-39, June.2013.
5. Christian Blum and Xiaodong Li, “Swarm Intelligence in Optimization”, swarm intelligence, Springer Berlin,
pp 43- 85, 2008.
6. F. Çelik, A. Zengin, and S. Tuncel, “A survey on swarm intelligence based routing protocols in wireless
sensor networks”, International Journal of the Physical Sciences, vol. 5(14), pp. 2118-2126, 2010.
7. Rune Hylsberg Jacobsen, Qi Zhang, and Thomas Skjodeberg Toftegaard, “Bioinspired Principles for Large-
Scale networked Sensor Systems: An Overview”, Journal of Sensors, vol.11 No.4, pp.4137-4151, April, 2011.
8. ] R.Geetha,G.umarani and srikanth, “Ant Colony optimization based Routing in various Networking Domains
– A Survey”, International Research Journal of Mobile and Wireless Communications – IRJMWC Vol 03, Issue 01, pp.115-120, 2012.
9. Xiaodong Liu, Songyang Li, Miao Wang, “An Ant Colony based Routing Algorithm for Wireless Sensor
Network”, International Journal of Future Generation Communication and Networking, Vol. 9, No. 6, pp. 75-86, 2016.
10. ParulKhurana and InderdeepAulakh, “Wireless Sensor Network Routing Protocols: A Survey”, International
Journal of Computer Applications, Vol.75,No.15, pp.17-25, August, 2013.
11. Shio Kumar Singh, M P Singh and D K Singh, “Routing Protocols in Wireless Sensor Networks –A Survey”
International Journal of Computer Science & Engineering Survey (IJCSES) Vol.1, No.2, pp.63-83, November 2010.
12. Dorigo, M.; Birattari, M.; Stutzle, T.;, "Ant colony optimization," Computational Intelligence Magazine,
IEEE, vol.1, no.4, pp.28-39, Nov. 2006 .
Source of support: Nil, Conflict of interest: None Declared.