RACE AND SUBTYPE DIFFERENCES IN THE REPLICATION OF PREVIOUSLY IDENTIFIED BREAST CANCER SUSCEPTIBILITY LOCI: A BAYESIAN
APPROACH
Katie M. O’Brien
A dissertation submitted to the faculty of the University of North Carolina at Chapel Hill in partial fulfillment of the requirements for the degree of Doctor of Philosophy in the
Department of Epidemiology.
Chapel Hill 2013
Abstract
KATIE M. O’BRIEN: Race and subtype differences in the replication of previously identified breast cancer susceptibility loci: A Bayesian approach
(Under the direction of Robert C. Millikan and Stephen R. Cole)
Over the last twenty-five years, researchers have identified several dozen genetic polymorphisms associated with breast cancer susceptibility. While many of these loci are now considered well-established risk factors for the disease, previous attempts to replicate variant-disease associations in African Americans or to identify subtype-specific risk variants have been imprecise and inconsistent.
I examined the association between breast cancer subtypes and previously established candidate gene and genome-wide association study “hits” among white and African
American women in the Carolina Breast Cancer Study. Maximum likelihood and Bayesian methods were used to estimate race and subtype-specific odds ratios (ORs) for each of 83 candidate single nucleotide polymorphisms (SNPs). Selected SNPs included several previous GWAS hits (n=22), near-GWAS hits (n=19), otherwise well-established risk loci (n=5), or SNPs in the same gene as another selected variant (n=37). Subtypes were defined using 5 immunohistochemical markers: estrogen receptors (ER), progesterone receptors (PR), human epidermal growth factor receptors 1 and 2 (HER1/2) and cytokeratin (CK) 5/6.
Eighteen identified SNPs successfully replicated in whites and ten GWAS-identified SNPs successfully replicated in African Americans. SNPs in FGFR2 and
associated with breast cancer in whites and SNPs in TLR1, ESR1, and H19 were associated with breast cancer in African Americans. Several SNPs in TNRC9/TOX3 were associated with luminal A (ER/PR+, HER2-) or basal-like disease (ER-, PR-, HER2-, HER1 or CK 5/6+), and one SNP (rs3104746) was associated with both. SNPs in FGFR2 were associated with luminal A, luminal B (ER/PR+, HER2+), and HER2+/ER-, but not basal-like disease. There were also subtype differences in the effects of SNPs in 2q35, 4p, TLR1, MAP3K1, ESR1, CDKN2A/B, ANKRD16, and ZM1Z1.
Dedicated to Robert C. Millikan, an extraordinary teacher, mentor and friend
“Remember that when you leave this earth, you can take with you nothing that you have received –
only what you have given: a full heart,
Acknowledgements
I would first like to thank my committee members, for their advice and
encouragement throughout this dissertation process. In particular, I would like to thank my chair, Dr. Stephen Cole, for his steadfast support and mentorship, and Dr. Lawrence Engel, for his willingness to join my committee belatedly and for his continued guidance and backing. I would also like to thank the staff of the Carolina Breast Cancer Study, as well as Nancy Colvin, Carmen Woody, Andy Olshan, and other members of the Epidemiology department who have provided the emotional and academic support I needed to complete this dissertation. I am also grateful to the participants of the Carolina Breast Cancer Study, who gave us their time and personal information in hopes of making a difference for future generations.
Additionally, I would like to thank my husband, Alexander Keil, for his love, patience, and commiseration during the last 6 years of graduate school. His programming, editing, and methodology skills are also much appreciated. I am also indebted to my fellow epidemiology students and unofficial support group members, including Cassidy Henegar, Pamela Klein, Jennifer Lund, Peter Samai, Leila Family, Jess Edwards, Christina Ludema, and Annah Wyss. A final thank you goes to my parents, who have done everything in their power to ensure that their daughters are happy and successful women. I am truly grateful for everything they have given me.
Table of Contents
List of Tables ... xii!
List of Figures ... xiv!
List of Abbreviations and Symbols ... xvi!
1. Specific Aims ... 2!
Specific aim 1: Estimate associations between identified genetic risk variants and overall breast cancer in whites and African Americans using Bayesian and frequentist methods. ... 2
Specific aim 2: Estimate effects between the candidate SNPs and each breast cancer subtype. ... 3!
2. Review of the Literature ... 4!
2.1 Public health impact of breast cancer ... 4!
2.2 Race and age disparities in incidence and mortality ... 4!
2.3 Breast cancer histology ... 5!
2.4 Breast cancer and hormone receptors ... 6!
2.5 Breast cancer intrinsic subtypes ... 6!
2.5.1 Intrinsic subtypes and race ... 8!
2.5.2 Intrinsic subtypes and prognosis ... 9!
2.6 Non-genetic risk factors for breast cancer ... 10!
2.6.1 Non-genetic risk factors by estrogen receptor (ER) status ... 11!
2.6.2 Non-genetic risk factors by subtype ... 12!
2.7.1 BRCA1 and BRCA2 ... 25!
2.7.2 Candidate genes ... 26!
2.7.3 Genome-wide association studies ... 30!
2.7.4 Summary of genetic risk factors ... 46!
3. Methods ... 81!
3.1 Study population ... 81!
3.1.1 Case and control ascertainment ... 81!
3.1.2 Data collection ... 82!
3.1.3 SNP selection ... 84!
3.1.4 Ancestry informative markers (AIMs) ... 85!
3.1.5 Genotype analysis ... 85!
3.1.6 IHC analysis ... 89!
3.2 Other covariates ... 91!
3.2.1 Race and age ... 91!
3.2.2 Stage at diagnosis ... 92!
3.2.3 African and European ancestry ... 92!
3.3 Statistical methods ... 94!
3.3.1 Descriptive statistics ... 94!
3.3.2 Hardy-Weinberg equilibrium ... 94!
3.3.3 Linkage disequilibrium ... 96!
3.3.4 Confounding and other adjustment factors ... 96!
3.3.5 Frequentist analysis ... 98!
4. Replication of Breast Cancer Susceptibility Loci in Whites and African
Americans Using a Bayesian Approach ... 118!
4.1 Overview ... 118!
4.2 Introduction ... 119!
4.3 Methods... 120!
4.3.1 Study population ... 120!
4.3.2 SNP selection ... 122!
4.3.3 Genotype analysis ... 122!
4.3.3 Statistical methods ... 123!
4.3.4 Bayesian analysis ... 124!
4.4 Results ... 127!
4.5 Discussion ... 130!
5. Breast Cancer Subtypes and Previously Established Genetic Risk Factors: A Bayesian Approach ... 171!
5.1 Overview ... 171!
5.2 Introduction ... 172!
5.3 Methods... 175!
5.3.1 Study population ... 175!
5.3.2 IHC analysis ... 176!
5.3.3 SNP selection ... 177!
5.3.4 Genotype analysis ... 178!
5.3.5 Statistical methods ... 179!
5.4 Results ... 181!
6. Discussion ... 209!
6.1 Summary of findings ... 209!
6.1.1 Racial differences in breast cancer susceptibility loci ... 209!
6.1.2 Subtype differences in breast cancer susceptibility loci ... 212!
6.2 Strengths and limitations ... 215!
6.3 Public health implications ... 219!
6.4 Future research ... 220!
Appendix 1: SAS code ... 230
Appendix 2: Extra figures, overall breast cancer analysis………...233
List of Tables
Table 1: Summary of risk factors by breast cancer subtype: Subtype vs. control ... 67!
Table 2: Summary of risk factors by breast cancer subtype: Subtype vs. luminal A ... 69!
Table 3: Summary of candidate genes by breast cancer subtype ... 71!
Table 4: Breast cancer genome-wide association studies (GWAS) ... 72!
Table 5: Summary of effect estimates for GWAS-identified and other selected breast cancer SNPs among women of European (EA) and African American (AA) ancestry ... 77
Table 6: Included SNPs ... 115!
Table 7: Selection of risk variants among women of European (EA) and African American (AA) ancestry* ... 116
Table 8: Descriptive statistics for Whites and African Americans in the Carolina Breast Cancer Study (1993-2001) ... 134
Table 9: Risk allele frequencies (RAF) by race and case status, whites and African Americans in the Carolina Breast Cancer Study ... 135
Table 10: SNP genotype distributions and associations with incident breast cancer for White women in the Carolina Breast Cancer Study (1993-2000) ... 138
Table 11: SNP genotype distributions and associations with incident breast cancer for African American women in the Carolina Breast Cancer Study (1993-2000) ... 147
Table 12: Comparison of odds ratios (ORs) and confidence limit ratios (CLRs) or posterior limit ratios (PLRs) for MLE, Bayesian and hierarchical regression models among white ... 156
Table 13: Comparison of odds ratios (ORs) and confidence limit ratios (CLRs) or posterior limit ratios (PLRs) for frequentist, basic hierarchical and Bayesian regression models among African American women in the Carolina Breast Cancer Study ... 159
Table 15: Comparison of posterior limit ratios (PLRs) for hierarchical regression models among African American women in the Carolina Breast
Cancer Study ... 170 Table 16: Descriptive statistics for Carolina Breast Cancer Study participants
included in subtype analysis ... 188! Table 17: Risk allele frequencies (RAF) by race and case status, African Americans
and non African Americans in the Carolina Breast Cancer Study ... 189! Table 18: Odds ratios and 95% posterior intervals for the association between
the selected single nucleotide polymorphisms (SNPs) and each breast cancer subtype, relative to controls [SNP log OR~N(0,τ2), τ2 ~ Γ-1(4, 0.5)
with mode=0.10] ... 192 Table 19: Odds ratios and 95% posterior intervals for SNP-subtype associations
in Carolina Breast Cancer Study whites, [SNP log OR~N(0,τ2),
τ2 ~ Γ-1(4, 0.5) with mode=0.10] ... 196 Table 20: Odds ratios and 95% posterior intervals for SNP-subtype associations
in Carolina Breast Cancer Study African Americans [SNP log OR~N(0,τ2),
τ2 ~ Γ-1(4, 0.5) with mode=0.10] ... 199 Table 21: Maximum likelihood odds ratios and 95% confidence intervals for the
association between the selected single nucleotide polymorphisms
(SNPs) and each breast cancer subtype, relative to controls ... 203 Table 22: Odds ratios and 95% posterior intervals for the association between the
selected single nucleotide polymorphisms (SNPs) and each breast cancer subtype, relative to controls [SNP log OR~N(0,τ2), τ2 ~ Γ-1(3, 0.2) with
mode=0.05] ... 206 Table 23: Summary of replication results and subtype-specific findings for
GWAS-identified and candidate gene SNP hits ... 223 Table 24: Comparison of previous findings and CBCS results for less established
List of Figures
Figure 1: US breast cancer mortality rate by race, age group, and year ... 48!
Figure 2: ATM linkage disequilibrium map for HapMap CEU ... 49!
Figure 3: ATM linkage disequilibrium map for HapMap YRI ... 50!
Figure 4: CASP8 linkage disequilibrium map for HapMap CEU ... 51!
Figure 5: CASP8 linkage disequilibrium map for HapMap YRI ... 52!
Figure 6: TP53 linkage disequilibrium map for HapMap CEU ... 53!
Figure 7: TP53 linkage disequilibrium map for HapMap YRI ... 54!
Figure 8: CYP19A1 linkage disequilibrium map for HapMap CEU ... 55!
Figure 9: CYP19A1 linkage disequilibrium map for HapMap YRI ... 56!
Figure 10: PALB2 linkage disequilibrium map for HapMap CEU ... 57!
Figure 11: PALB2 linkage disequilibrium map for HapMap YRI ... 58!
Figure 12: ESR1 linkage disequilibrium map for HapMap CEU ... 59!
Figure 13: ESR1 linkage disequilibrium map for HapMap YRI ... 60!
Figure 14: CDKN2A/CDKN2B linkage disequilibrium map for HapMap CEU ... 61!
Figure 15: CDKN2A/CDKN2B linkage disequilibrium map for HapMap YRI ... 62!
Figure 16: FGFR2 linkage disequilibrium map for HapMap CEU ... 63!
Figure 17: FGFR2 linkage disequilibrium map for HapMap YRI ... 64!
Figure 18: TNRC9/TOX3 linkage disequilibrium map for HapMap CEU ... 65!
Figure 19: TNRC9/TOX3 linkage disequilibrium map for HapMap YRI ... 66!
Figure 20: Carolina Breast Cancer Study (CBCS) Study area ... 112!
Figure 21: Flow chart for Carolina Breast Cancer Study participants ... 113!
Figure 24: ATM linkage disequilibrium (LD) patterns, CBCS whites (A) and
African Americans (B) ... 163!
Figure 25: TP53 linkage disequilibrium (LD) patterns, CBCS whites (A) and African Americans (B) ... 164!
Figure 26: CDNK2A/B linkage disequilibrium (LD) patterns, CBCS whites (A) and African Americans (B) ... 165!
Figure 27: TNRC9/TOX3 linkage disequilibrium (LD) patterns, CBCS whites (A) and African Americans (B) ... 166!
Figure 28: Comparison of point estimates and 95% PIs for hierarchical models with investigator specified covariance matrices, CBCS whites ... 167!
Figure 29: Comparison of point estimates and 95% PIs for hierarchical models with investigator specified covariance matrices, CBCS African Americans ... 168!
Figure 30: Odds ratios and 95% posterior intervals for FGFR2 and TNRC9/TOX3 SNPs, All CBCS participants ... 195!
Figure 31: Odds ratios and 95% posterior intervals for FGFR2 and TNRC9/TOX3 SNPs for CBCS whites (left) and African Americans (right) ... 202!
Figure A2.1 Comparison of MLE and Bayes ORs, CBCS whites... 233!
Figure A2.2 Comparison of MLE and Bayes ORs, CBCS African Americans ... 234!
Figure A2.3 Comparison of MLE and hierarchical ORs, CBCS Whites ... 235!
List of Abbreviations and Symbols AIMs = Ancestry Informative Markers
ASW= HapMap population of African Americans living in the Southwest USA BMI = Body Mass Index
BRCA1 = Breast Cancer Gene 1 BRCA2= Breast Cancer Gene 2 CBCS= Carolina Breast Cancer Study ccOR = Case-case Odds Ratio
CEU = HapMap population of Utah residents with ancestry from northern and western Europe
CI = Confidence Interval CK 5/6 = Cytokeratin 5/6 DAG= Directed Acyclic Graph Df = Degree of Freedom DNA = Deoxyribonucleic Acid ER= Estrogen Receptor
HER1= Human Epidermal Growth Factor Receptor-1 HER2= Human Epidermal Growth Factor Receptor-2 HR= Hazard Ratio
HRT = Hormone Replacement Therapy HWE = Hardy-Weinberg Equilibrium IHC= Immunohistochemical
LD = Linkage Disequilibrium MAF= Minor Allele Frequency MCMC = Markov-Chain Monte Carlo MLE = Maximum Likelihood Estimate mRNA = Messenger Ribonucleic Acid NC= North Carolina
OR = Odds Ratio
PBCS= Polish Breast Cancer Study PCR = Polymerase Chain Reaction PI = Posterior Interval
PR = Progesterone Receptor RAF = Risk Allele Frequency
SEER = Surveillance Epidemiology and End Results SNP= Single Nucleotide Polymorphism
UNC = University of North Carolina US = United States
WHR = Waist to Hip Ratio
1. Specific Aims
Although advances in breast cancer detection, prevention and treatment have helped reduce incidence and mortality over the last decade, breast cancer still afflicts nearly one in every eight US women and kills one in 36 [1, 2]. A crucial next step in reducing the public health burden of breast cancer is to identify and better characterize genetic mutations
affecting breast tumorigenesis. By examining these mutations we can better understand how the disease develops and progresses, identify individuals at higher risk of developing the disease, and locate targets for further research on directed therapies. We can gain additional insights by investigating these genetic mutations within strata of disease subtype and race, as there is strong evidence that breast cancer is a heterogeneous disease with several distinct etiologies and that subtypes and risk variants are not evenly distributed across race or age groups [3-12].
Aside from a few highly influential genetic variants identified through linkage or candidate gene analyses, most of the known genetic risk factors for breast cancer were first detected in genome-wide association studies (GWAS). With so much about breast cancer etiology and the human genome still unknown, GWAS have been invaluable discovery tools. Yet, the expansiveness of these studies also limits their precision and thus their ability to identify causal variants or discern subtype-specific risk profiles.
and the risk of breast cancer. In this analysis, I used Bayesian statistical methods to
incorporate information on the linkage disequilibrium of the variants within the gene and the likely magnitude of the association to better inform statistical models. These theoretically sound but computationally challenging methods are expected to produce more precise and informative effect estimates than traditional statistical techniques [13-17]. I conducted this research using data from the Carolina Breast Cancer Study (CBCS), a population-based, case-control study with large samples of both white (n= 1247 cases, 1105 controls) and African American women (n=766 cases, n=681 controls). The specific aims of this study are as follows.
Specific aim 1: Estimate associations between identified genetic risk variants and overall breast cancer in whites and African Americans using Bayesian and frequentist methods.
a) Describe the application of Bayesian methods, including hierarchical modeling and full Bayes regression analysis
b)Generate race-specific effect estimates for the association between invasive and in situ breast cancer and 83 candidate polymorphisms from 28 well-established breast cancer-related genes or gene regions [18-20]
i. Estimate individual SNP effects using frequentist logistic regression models and full Bayes logistic regression models with informative priors
Specific aim 2: Estimate effects between the candidate SNPs and each breast cancer subtype.
a) Estimate the effect of each candidate gene on each breast cancer subtype, relative to controls, using frequentist and Bayesian methods
b)Estimate race-stratified effects for each candidate gene on each breast cancer subtype, relative to controls, using frequentist and Bayesian methods
2. Review of the Literature 2.1 Public health impact of breast cancer
Despite recent advances in detection and prevention, breast cancer remains the most common female cancer in the United States (US) and worldwide [21]. In 2012, an estimated 226,870 US women were diagnosed with the disease [22], which corresponds to an average lifetime risk of 12%, or one in eight, for US women [23].
With a 5-year relative survival rate of nearly 90% in the US [23], deaths due to breast cancer are fairly rare, with approximately 1 in 35 women dying annually from the disease [2]. However, breast cancer is the second most common cause of cancer death in the US, claiming the lives of nearly 40,000 US women in 2012 [23], and remains the leading cause of cancer death in females worldwide [21].
Age-adjusted incidence rates for the state of North Carolina (NC) are slightly above the US average, with 127.5 NC cases versus 123.1 US cases per 100,000 women per year in 2009 [24]. Breast cancer mortality rates in NC are slightly lower than the US average, with 21.4 NC deaths and 22.2 US deaths per 100,000 in 2009 [24].
2.2 Race and age disparities in incidence and mortality
more common among White women aged 50 or older than African American women of the same age group (360.9 versus 344.8 cases per 100,000 women) [1]. In contrast, mortality statistics from 2009 indicate much higher rates for African Americans than Whites in both age groups (8.1 versus 4.5 deaths per 100,000 women aged <50; 89.1 versus 66.6 deaths per 100,000 women aged 50 or older) [2]. As shown in Figure 1, a plot of race and age-group specific mortality rates from 1969-2009, racial differences in mortality in the 50 or older age group have not shown a meaningful decrease since reaching a peak in 1997, at which point there were approximately 23 more deaths per 100,000 per year in African Americans than Whites [2]. All rates have been decreasing over time since the mid-1990s.
2.3 Breast cancer histology
The National Cancer Institute defines breast cancer as “cancer that forms in the tissues of the breast, usually the ducts and lobules” [22]. More specifically, invasive breast cancer develops when abnormal cells multiply without constraint, forming a tumor within one part of the breast that eventually penetrates the basement membrane and infiltrates adjacent tissues. These tumors can be classified based on their histological subtype, which describes the anatomical structure in which the malignant cells originate [25].
carcinoma and Paget’s disease, with each accounting for less than 2% of all invasive cases. Ductal carcinoma in situ and lobular carcinoma in situ are non-invasive breast tumors that have not spread beyond their point of origin [25]. These malignant cells may grow into invasive tumors if left untreated.
2.4 Breast cancer and hormone receptors
The presence or absence of specific hormone receptors within the breast tumor can also be used to classify breast tumors. Hormone receptor expression is determined using immunohistochemical (IHC) analysis and may be an important indicator of where and how the malignant cells first arose [28-30].
Estrogen receptors (ER) and progesterone receptors (PR) are the most common types of hormone receptor in breast tumor cells, with approximately 80% and 60-70% of all US breast cancers arising from ER positive cells and PR positive cells, respectively [7, 26, 31-33]. ER and PR status are highly correlated, with concordance estimated at 85% [34-37]. A third commonly evaluated hormone receptor is human epidermal growth factor receptor-2 (HER2), which appears in 12-20% of breast tumors collected from US population-based samples [7, 33, 38].
2.5 Breast cancer intrinsic subtypes
analyses of breast tissue, Perou et al. [39] identified 496 genes that sufficiently captured the variation between tumor cells. When these 496 genes were analyzed using a hierarchical clustering method to group tumors with similar expression patterns, the investigators observed interesting parallels with the traditional IHC markers of ER and HER2. For example, tumor samples that over-expressed the estrogen receptor-α gene and several other transcription factors were also ER positive. Similarly, HER2+ tumor samples were the only ones that expressed high levels of genes from a small region on chromosome 17. The remaining gene expression-derived subgroups could be differentiated based on the presence or absence of expression of cytokeratin 5/6 (CK 5/6), a protein found in basal epithelial cells but not in the more differentiated luminal epithelial cells.
Based on these findings and more refined analyses [40-42], breast cancer researchers created a classification system for breast cancer tumors based on five IHC tumor markers (ER, PR, HER2, CK 5/6, and human epidermal growth factor receptor-1 [HER1]) that serve as adequate, inexpensive surrogates for more complex gene expression profiles. Based on these IHC markers, breast cancer can be classified into four subtypes with unique biological characteristics: luminal A (ER+ and/or PR+, HER2-), luminal B (ER+ and/or PR+, HER2+), HER2+/ER- (ER-, PR-, HER2+), and basal-like (ER-, PR-, HER2-, HER1+ and/or CK 5/6+). Despite evidence that the gene expression of tumors negative for these five IHC markers is still rather varied, claudin-low, HER2-enriched, apocrine expressing, normal-like, and other potentially unique subtypes are generally lumped together as ‘unclassified’ due to their rarity and complicated features [43-46].
cancer etiology and uncovered topics in need of further research. In particular, this subtype classification system has lead to insights in racial differences in the incidence of each breast cancer subtype, furthered explorations of how genetic and behavioral risk factors vary by subtype, and motivated development of targeted therapies.
2.5.1 Intrinsic subtypes and race
Luminal A is the most common subtype, but the proportion of tumors of each subtype varies widely depending on the age and race of the population [3, 5, 6, 48-59]. This
phenomenon was first observed by Carey et al. [3] in the Carolina Breast Cancer Study (CBCS), a population-based, case-control study of breast cancer in North Carolina with approximately equal proportions of white and African American women, and pre and postmenopausal women. In this population, luminal A was the most common subtype in postmenopausal African Americans (59%), premenopausal non-African Americans (51%) and postmenopausal non-African Americans (58%), but not premenopausal African
Americans, who had a higher proportion of basal-like breast cancer (39% basal-like vs. 36% luminal A). In contrast, postmenopausal African Americans, premenopausal non-African Americans and postmenopausal non-African Americans had 14%, 16%, and 16% basal-like breast cancer, respectively. Premenopausal African Americans also had slightly higher proportions of HER2+/ER- tumors than the other subgroups (9% vs. 6-7%) and lower proportions of luminal B tumors (9% vs. 16-18%). These results were replicated in later analyses of an expanded CBCS population [4].
negative’ tumors (ER-, PR- and HER2-) [7, 8, 60-67] relative to other racial groups. Additionally, several studies of breast cancer subtype distributions in African populations have observed proportions of basal-like breast cancer [50, 68, 69] or triple negative breast cancer [64] that are equal to, if not greater than those found in US African American populations.
Asians and Europeans seem to have similar subtype distributions as white Americans, with studies reporting approximately 50-60% luminal A tumors and 10-20% basal-like tumors [7, 33, 48, 52, 53, 55, 56, 58-60, 62, 63, 70-83]. The only study to analyze basal markers in Hispanic individuals found a low prevalence of basal-like breast cancer (5%) [49], but the prevalence of triple negative disease was consistent with that of white Americans, Europeans, and Asians [7, 60, 62, 65, 67, 84, 85].
2.5.2 Intrinsic subtypes and prognosis
Carey et al. [3] was also the first study to examine whether intrinsic subtypes affect survival, though an update from O’Brien et al. [86] in 2010 examined an expanded study population and longer follow-up period. Here, 26% of CBCS participants with the HER2+/ER- subtype and 24% of those with basal-like breast cancer died of their disease within 5 years of their diagnosis, compared to only 9% of those with luminal A tumors. These breast cancer specific mortality rates corresponded to hazard ratios of 2.3 (95% confidence interval [CI]: 1.5- 3.6) and 1.7 (95% CI: 1.2- 2.4) for women with HER2+/ER- and basal-like tumors, respectively, relative to women with luminal A tumors.
diseases with diverse prognoses. As breast cancer specific survival was worse for basal-like tumors than tumors negative for all 5 IHC markers in most of these studies [5, 51, 53, 56, 58, 86-88], these analyses provide further evidence that combining these two diseases into a single ‘triple-negative’ subtype limits our ability to study their divergent outcomes and possibly unique etiologic origins [28, 29, 41, 89-91].
Of note, while these prognostic discrepancies do provide evidence of distinct subtype etiologies, the availability and effectiveness of subtype-targeted treatments also plays a substantial role in subtype-specific mortality rates. Anti-estrogen drugs, such as tamoxifen or raloxifen, can bind to the estrogen receptors in ER positive tumors, thereby inhibiting
growth-stimulating estrogen molecules from binding to the receptors [92]. Similarly,
aromatase inhibitors such as letrozole (Femara®) decrease the amount of estrogen a woman produces [93]. Although the development and FDA approval of trastuzumab (brand name Herceptin®) is too recent to affect survival statistics in any long-term observational studies, the HER2 protein binding anti-body is now used to treat HER2 positive tumors [94, 95]. To date, there is no FDA approved targeted therapy for women with triple negative disease, though additional research on gene expression patterns among triple negative tumors has identified some potential therapeutic markers [44, 45, 96].
2.6 Non-genetic risk factors for breast cancer
including early age at menarche, older age at first birth, low parity (especially nulliparity), lack of breast-feeding, and late age at menopause have all been linked to higher disease rates as well [100]. Other well-established factors associated with increased disease risk are use of hormone replacement therapy (HRT), previous chest radiation, radiation treatment for lymphoma and other cancers, high alcohol consumption, being overweight or obese after menopause, lack of physical activity, having dense breasts, and a history of benign breast disease. Tobacco smoke, exposure to certain environmental chemicals, oral contraceptive (OC) use, and certain dietary patterns may also increase breast cancer risk, but the results from studies on these topics have been inconsistent [97-99].
2.6.1 Non-genetic risk factors by estrogen receptor (ER) status
Once researchers realized how strongly hormone receptors influence patients’
responses to specific treatments and overall prognoses, they began to question whether breast cancer subtypes had unique etiologies and, accordingly, unique risk factors. In their earliest and most basic approach to this question, epidemiologists examined traditional risk factors in ER+ and ER- tumors separately, accounting for PR status if available. These studies revealed some noteworthy discrepancies.
though early menarche is also a risk factor for ER- disease. However, these authors also found that breastfeeding was associated with a reduced risk of both disease types, and that HRT and OC use did not meaningfully affect the risk of either. Studies of other established risk factors indicated that postmenopausal obesity is probably associated with ER+ but not ER- disease [101, 104], and that family history, smoking, and alcohol are associated with comparable increases in risk for both subgroups [101, 105, 106]. Consideration of PR status did not lead to any additional insights [103, 104, 106].
2.6.2 Non-genetic risk factors by subtype
Testing for HER2 status became more common after the development of Herceptin, and the identification of intrinsic subtypes prompted some researchers to assess basal-marker status as well. This allowed researchers to conduct more etiologically relevant risk factor analyses for each ER/PR/HER2 or intrinsic subtype separately. Although these studies were often small and not representative of all cases, they have contributed greatly to our
understanding of what causes specific breast cancer subtypes and aided in the development of new treatment and prevention strategies.
To date, three research groups have published analyses of breast cancer risk factors by intrinsic subtype. This includes the Carolina Breast Cancer Study (CBCS) [4], the Nurses’ Health Study (NHS) [83], and the Poland Breast Cancer Study (PBCS) [82]. Some effect estimates for basal-like breast cancer are also available from the pooled analysis by Yang and colleagues [103], which includes PBCS and 33 other studies.
basal-like breast cancer, the discrepancy is minimal if most triple-negative tumors are basal-basal-like, as is usually the case [45], and relative risks for luminal A, luminal B, and HER2+/ER- breast cancers are the same for either classification system. In the following risk factor summary, conclusions are based on confounder-adjusted ORs comparing cases to non-cases, or confounder-adjusted case-case odds ratios (ccORs) comparing one subtype directly to another referent subtype, usually luminal A. The results are further summarized in Table 1 (case-control comparisons) and Table 2 (case-case comparisons).
2.6.2.1 Age
Millikan et al. [4] found that younger age was a stronger risk factor for luminal B, HER2+/ER-, basal-like, and unclassified breast cancers than for luminal A breast cancers. Studies without basal marker data found similar trends for all subtypes relative to luminal A [62, 66, 78, 107], for triple-negative relative to luminal A [108], or for triple-negative relative to non-triple negative [65].
2.6.2.2 Race
As expected based on previous comparisons of subtype prevalence by race, effect estimates from all studies reporting race-stratified analyses indicated that African Americans had a greater risk of basal-like, unclassified or triple-negative breast cancer than luminal A [4, 62, 66] or non triple-negative breast cancer [65, 108]. African Americans also had an elevated risk of HER2+/ER- breast cancer versus Luminal A breast cancer [4, 62, 66]. Hispanics had a higher risk of HER2+ than Luminal A disease when compared to non-Hispanic whites, but the relative risk of triple-negative disease was unclear [62, 65, 78]. Women of Asian descent also appeared to get HER2+ disease more often than non-Hispanic whites, but had a reduced risk of triple-negative disease [62, 78, 108]. In the only study to examine whether African American race was a risk factor for breast cancer subtypes relative to controls, Trivers et al. [66] reported an inverse association for luminal A, a null association for luminal B, and positive associations for HER2+/ER- and triple negative.
2.6.2.3 Family history
Most studies reported a positive association between family history and each subtype, relative to non-cases [79, 82, 83, 110-113], with a slightly weaker or null effect for luminal B, HER2+/ER-, basal-like, or triple-negative disease relative to luminal A [4, 62]. The only exception to this was the pooled analysis, which exhibited a positive OR for the effect of first degree family history on basal-like breast cancer relative to luminal A [103].
2.6.2.4 Menopause
luminal A breast cancer, but did not affect the risk of luminal B, HER2+/ER-, basal-like or unclassified disease [4]. One other study identified a slight increase in luminal B versus luminal A breast cancer in premenopausal women [62], and a third study found that being premenopausal increased the risk of luminal A or B breast cancer, relative to controls [79].
The Nurses’ Health Study [83], PBCS [82], a registry-based, US case-control study [114], the Women’s Health Initiative [115] and a Chinese case-control study [79] all found evidence that increasing age at menopause was positively associated with risk of luminal A disease relative to non-cases. Both the Nurses’ Health Study and the US case-control study also reported a non-null association between age at menopause and Luminal B or
HER2+/ER- disease. As for basal-like and triple-negative breast cancers, effect estimates from the Nurses’ Health Study, the US case-control study, the Women’s Health Initiative and a Japanese case-control study supported a null association [83, 113-115], while a Chinese case-control studies reported slightly increased risk for triple-negative disease among women with late onset menopause [79], and PBCS reported an increased risk for unclassified, but not basal-like tumors [82]. No studies estimated ccORs.
2.6.2.5 Age at menarche
al. [66] was the only study to observe an increased risk for HER2+/ER- versus luminal A among women with early age at menarche, and all luminal B versus luminal A ccORs were near-null.
2.6.2.6 Parity and lactation
Giving birth to one or more children had an inverse association with luminal A breast cancer in all eleven case-control comparisons [4, 66, 79, 82, 83, 110, 114-118]. Most studies that evaluated the effect of parity on luminal B breast cancer also found a reduced risk [66, 79, 82, 110], and case-case analyses indicated that the effect was roughly equivalent for the luminal B versus luminal A subtype [4, 62, 66, 103]. Whether compared to controls or luminal A cases, most studies found no evidence of an association between parity and HER2+/ER- breast cancer. The two exceptions to this were Trivers et al. [66], who reported an increased risk of HER2+/ER- disease among women with higher parity, relative to either controls or luminal A cases, and Xing et al. [79], who identified a substantially reduced risk for HER2+/ER- disease among women with one child, relative to controls.
The effect of parity on basal-like or triple-negative breast cancer was less clear. While only two of the twelve case-control comparisons detected a positive association between any parity and risk of either basal-like or triple-negative breast cancer relative to controls [4, 115], parity was associated with an increased risk of triple-negative, basal-like or unclassified breast cancer relative to luminal A in several investigations [4, 62, 66, 103, 108].
Breastfeeding, regardless of duration, had an inverse association with each breast cancer subtype in most case-control comparisons [4, 66, 79, 83, 109, 110, 113-116].
Estimated ccORs less than 1 for luminal B and triple-negative breast cancer suggest that lack of breast-feeding is a particularly important risk factor for these two subtypes [4, 62, 66, 108].
Interestingly, when Millikan et al. [4] examined the joint effects of parity and
lactation in women with basal-like breast tumors, they found that parity was only associated with an increased risk of cancer in women who did not breastfeed. Similarly, Kwan et al. [62] found that higher parity was associated with greater odds of having luminal B,
HER2+/ER- or triple-negative versus luminal A breast cancer in women who did not lactate, but not in women who did.
2.6.2.7 Age at first full term pregnancy
Subtype-specific effect estimates for late age at first full term pregnancy were inconsistent and difficult to separate out from the effect of parity in general. Lack of a common referent group made comparisons across studies especially difficult.
Four studies used nulliparous women as the referent group [4, 66, 109, 115] when comparing subtypes to non-cases. Accordingly, all effect estimates for luminal A cancers were less than 1, but were higher for women in older age categories than younger age categories. The same was true for luminal B cancers in the one study with estimated effects [66]. The reported findings for HER2+/ER- and basal-like or unclassified breast cancers were too inconsistent to draw conclusions.
every 1-5 year increase in age at first full term pregnancy was associated with an increased risk of luminal A breast cancer. The pattern held for luminal A in four of six studies [79, 113-117] comparing relative risks for older versus younger mothers.
The results from case-case comparison studies reported positive associations between parity and luminal B, HER2+/ER-, basal-like or unclassified breast cancer relative to luminal A in younger mothers, but noted attenuated effects as maternal age increased [4, 62, 66, 103]. 2.6.2.8 Other reproductive risk factors
Subtype-stratified analyses of less established reproductive risk factors for breast cancer, such as OC use, HRT use, time since last full term pregnancy, and abortion also revealed some interesting results.
When OC use was limited to an ever versus never comparison, most subtype-specific estimates for non-luminal A breast cancer were null, though the luminal B estimates
demonstrated some striking inconsistencies [4, 62, 110, 117]. Dolle et al. [109] identified statistically significant increases in the risk of triple-negative disease, relative to controls, with long term OC use, especially if women were under the age of 40 when they initiated use. Gaudet et al. [110] also found an elevated risk of triple-negative breast cancer for ever versus never OC use in a similar age group, as well as an inverse association between ever OC use and luminal A breast cancer.
basal-like and unclassified breast cancer, relative to non-cases, particularly if progestin was also included [83, 114, 119].
Three studies examined the association between subtype and time since last
pregnancy [66, 116, 120]. In two of these three studies, cancers diagnosed soon after giving birth were more likely to be HER2+ than hormone receptor positive cases, HER2- cases or controls. Trivers et al. [66] and Li et al. [116] both found that women who were more
recently pregnant had reduced risk of luminal A or B disease, but only Trivers et al. observed a similar protective effect for recent pregnancy and triple-negative disease.
Lastly, in the only two studies to examine whether spontaneous or induced abortions were related to subtype-specific breast cancer risk, one found a non-significant, positive association between abortion and triple-negative breast cancer, relative to controls [109], and another found an increased risk of luminal A or HER2+/ER- breast cancer with induced abortions, but a decreased risk for all four subtypes for spontaneous abortions [79]. 2.6.2.9 Body size
Because postmenopausal adiposity is a known risk factor for breast cancer, most subtype analyses of body size are stratified by menopausal status. Body mass index (BMI) is the most common measure of body size, and is usually categorized according to the World Health Organization criteria: underweight (<18.5), normal (18.5-24.99), overweight (25.0-29.99) or obese (≥30.00) [121]. Based on these criteria, Millikan et al. [4] found an inverse association between higher category of BMI and postmenopausal luminal A and
studies of BMI in postmenopausal women, Phipps et al., Gaudet et al., and Yang et al. [82, 110, 123] reported only near-null findings. All case-case comparisons were also near-null [4, 103, 110].
In a pooled analysis, Pierobon et al. [124] found a positive association between obesity (BMI >30) and triple-negative breast cancer. The association was particularly strong among premenopausal women. Effect estimates for premenopausal BMI and breast cancer subtype revealed a possible negative association between high BMI and luminal A breast cancer, as found in three studies [4, 66, 82], but not two others [109, 110]. The relationship between high BMI and premenopausal luminal B cancer was inconsistent in these studies, with Trivers et al. [66] reporting an inverse association, Gaudet et al. [110] reporting a positive association and Yang et al. observing no effect [82]. Effect estimates from case-control comparisons of premenopausal HER2+/ER breast cancer were mostly null, though results from case-case comparisons indicated that women with larger body size had a higher risk of HER2+/ER- relative to luminal A [4, 62, 66, 103].
breast cancer again had the highest increase in risk associated with high WHR, while luminal B, HER2+/ER-, and unclassified tumors all had null effects relative to luminal A tumors [4].
Additionally, Tamimi et al. [83] found that higher BMI at age 18 was associated with a reduced risk in luminal A and basal-like breast cancer, and that weight gain since age 18 was positively associated with unclassified, but not basal-like breast cancer. Phipps et al. [122] reported positive effect estimates for the association of weight gain, waist
circumference, and hip circumference with luminal A breast cancer, and negative effect estimates for the association of waist circumference and triple-negative breast cancer. These findings were inconsistent with an earlier paper by Phipps et al. [123], which reported predominantly null subtype-specific effect estimates for BMI at age 30 and weight gain or loss. Corresponding analyses for luminal B and HER2+/ER- subtypes were also mostly null, with the exception of a negative association between higher BMI at age 18 and HER2+/ER- breast cancer identified by Tamimi et al [83]. No case-case analyses of these alternative body size measures were conducted.
2.6.2.10 Physical activity
Increased physical activity was associated with a reduced risk of luminal A,
2.6.2.11 Alcohol and smoking
The luminal A subtype has a strong positive association with high alcohol and
cigarette consumption and the HER2+/ER- subtype may be associated with increased alcohol consumption and a history of smoking. Luminal B, basal-like, and triple-negative breast cancers are probably not associated with alcohol consumption, but former smoking may affect the risk of these subtypes.
Compared to never drinkers, women with increasingly higher alcohol consumption had greater relative risks of developing luminal A breast cancer than non-cases [66, 83, 113, 125]. Despite some evidence of a negative association between increased alcohol
consumption and triple-negative breast cancer in the Women’s Health Initiative [125] and an Atlanta-based case-control study [66], the Nurses’ Health Study [83], and a SEER registry study [109] reported null effects, and a Japanese case-control study [113] reported a positive trend. Alcohol consumption was positively associated with HER2+/ER- breast cancer in both the Atlanta-based case-control study [66] and the Nurses’ Health study [83], but not with luminal B breast cancer in either study. Relative to luminal A breast cancer, the effect of alcohol on luminal B, HER2+/ER- or triple-negative disease was either null or inconsistent [4, 62, 66].
and duration on triple-negative tumors were mostly null and the effect of former or current smoking status was inconsistent [66, 109, 125]. In case-case comparisons, former smoking was associated with an increased risk of luminal B relative to luminal A, and current smoking was associated with an increased risk of HER2+/ER- relative to luminal A [66]. Subtype-specific ccORs for smoking intensity and duration were null for luminal B and HER2+/ER- and inconsistent for triple-negative tumors [4, 62, 113, 125].
2.6.2.12 Benign breast disease and breast density
Subtype-specific estimates for the effects of high breast density and previous benign breast disease were provided in one and two studies, respectively. Ma et al. [126] observed a positive association between high breast density and risk of both luminal A and basal-like breast tumors. The effect was roughly equivalent for both subtypes, as indicated by a null ccOR.
The Nurses’ Health Study [66] and the Cancer and Steroid Hormone study [110] both reported a positive association between benign breast disease and luminal A breast cancer. The Nurses’ Health Study also observed positive associations between benign breast disease and luminal B, basal-like and unclassified breast cancer, while the Cancer and Steroid Hormone study estimated a positive but imprecise association between benign breast disease and luminal B breast cancer and null effects for the remaining subtypes.
2.6.2.13 Summary of risk factors by subtype
Luminal A is the most common subtype and is associated with most previously established breast cancer risk factors, such as family history of breast cancer, later age at menopause, early age at menarche, nulliparity, lack of breastfeeding, later age at first full term pregnancy, decreased physical activity, increased alcohol consumption, history of benign breast disease and high breast density. The risk factors for luminal B breast cancer are fairly similar to those for luminal A, with the exception of older age at diagnosis, which is negatively associated with luminal B and positively associated with luminal A. Several other luminal A risk factors had null or inconsistent associations with luminal B disease, including race, age at menopause, age at menarche, lack of physical activity, and alcohol consumption. Only a few of the established risk factors are associated with HER2+/ER- disease, including younger age at diagnosis, African American race, family history of breast cancer, lack of breastfeeding, recent pregnancy, and high alcohol consumption. Lastly, triple-negative breast cancer is associated with several of the well-established risk factors, but its risk factor profile still varies quite a bit from that of luminal A. When compared directly to luminal A, triple negative tumors are more strongly associated with younger age at diagnosis, African
American race, family history of breast cancer, early age at menarche, higher parity, lack of breastfeeding and high premenopausal BMI than luminal A tumors.
2.7 Genetic risk factors for breast cancer
the disease and offered new targets for screening or therapeutic intervention. Furthermore, the ever-growing body of literature on variability in genetic risk factors by breast cancer subtype provides additional evidence that these subtypes have unique etiologies.
2.7.1 BRCA1 and BRCA2
The first high penetrance breast cancer susceptibility genes identified were aptly named Breast Cancer Gene 1 (BRCA1) and Breast Cancer Gene 2 (BRCA2) [130-132]. Both genes were discovered through linkage analysis, a technique that uses genetic markers to identify chromosomal regions disproportionately shared by diseased family members. Due to linkage disequilibrium (LD), proximal chromosomal regions are not randomly distributed during gametogenesis. Therefore, a marker strongly associated with disease incidence is likely physically near a causal locus, even if it does not tag the causal mutation. Family-based linkage analyses are particularly powerful for identifying susceptibility genes with high penetrance.
BRCA1 and BRCA2 are both DNA repair genes and tumor suppressor genes. Although their specific mechanisms are slightly different, the proteins encoded by these genes help activate DNA double strand break repair mechanisms and initiate homologous recombination to replace damaged sequences [133, 134]. Individuals born with mutations in BRCA1 or BRCA2 may be less equipped to fix or suppress cells with damaged DNA, thereby increasing the likelihood that these damaged cells proliferate and form tumors.
ethnicity, with around 8% of all Ashkenazi Jewish cases exhibiting a mutation in BRCA1, but only 0.5% of Asian-Americans [137]. Compared to white women with breast cancer, African American cases are less likely to have a BRCA1 mutation and more likely to have a BRCA2 mutation [10, 135], although one study reported a BRCA1 mutation prevalence of 17% (95% CI: 7%, 34%) in African Americans diagnosed before age 35 [137]. In terms of penetrance, around 60% of BRCA1 mutation carriers will develop breast cancer by age 70, as will approximately 50% of BRCA2 mutations carriers [127, 138].
Cases with BRCA1 mutations are much more likely to have triple-negative disease than cases with wild type BRCA1 [41, 139-147]. The association is particularly strong in young women [147]. BRCA1 mutations are also associated with increased basal-marker expression [41, 148]. There is no consistent association between BRCA2 and any breast cancer subtype.
2.7.2 Candidate genes
As noted previously, family-based linkage studies can effectively identify
In a comprehensive review and meta-analysis published in 2011, Zhang et al. [20] summarized the findings of more than 1000 breast cancer candidate gene studies. Overall, they examined 521 candidate genes or chromosomal regions and conducted meta-analyses of 279 variants. Twenty-nine variants had statistically significant associations in meta-analyses, but only 10 variants in 6 genes met the authors’ criteria for strong evidence of association, which required replication and protection from bias in addition to statistical significance. These 6 genes were: ATM, CASP8, CHEK2, CTLA4, NBN, and TP53. The authors considered three additional genes, CYP19A, TERT and XRCC3, to have moderate evidence of
association. Though purposefully excluded from this review, PTEN, BRIP1, and PALB2 were also mentioned as well-established, highly penetrant susceptibility genes. Variants identified in genome-wide association studies (GWAS) were also excluded.
Results from less comprehensive reviews of breast cancer candidate gene association studies are generally consistent with the findings of Zhang at el. For example, Antoniou and Easton [149] state that BRCA1, BRCA2, TP53, PTEN, ATM, and CHEK2 are well-established breast cancer susceptibility genes, though they also mention LKB1 (also known as STK11). Freisinger and Domchek [150] and Hirschfield et al. [151] consider BRCA1, BRCA2, TP53, PTEN, and STK11 to be well-established, highly penetrant genes and CHEK2,ATM, BRIP1 and PALB2 to be uncommon, but well-established susceptibility genes of low to moderate penetrance.
differentially related to the expression of hormone receptors in female breast tumors. A summary of the existing evidence is provided in Table 3.
The best-studied example of subtype differentiation by candidate gene status is CHEK2, located on chromosome 22. Of the four specific mutations Zhang et al. [20] deemed strongly associated with breast cancer, three (1100delC, IVS2+1G>A, and I157T) have been assessed within strata of ER, PR or intrinsic subtype. A base pair deletion in exon 10 of the gene (1100delC) showed evidence of an association with ER+ breast cancer in four studies [152-155], while a fifth showed no association [156] and a sixth observed a stronger association with ER- than ER+ tumors [157]. The 1100delC mutation was also associated with ER- tumors in Cybulski et al. [153], though to a lesser degree than ER+ tumors. The same was true for a similar mutation involving deletions in exon 9 and 10 (del5395). In a gene-expression analysis, all CHEK2 1100delC tumors clustered with the luminal A and luminal B tumors [158].
The two other CHEK2 mutations identified by Zhang et al. in their meta-analysis were not associated with ER status in Meyer et al. [156], though Cybulski et al. [153] found a strong association between ER+ breast cancer and IVS2+1G>A substitution, and Domagala et al. [159] observed a positive association between the I157T/ rs17879961 polymorphism and luminal A and B breast cancer, and an inverse association between I157T and basal-like and triple-negative breast cancer. The pattern held when Domagala et al. examined whether having any CHEK2 mutation affected intrinsic subtype, but Cybulski observed statistically significant, positive associations between CHEK2 mutations and both ER+ and ER- disease.
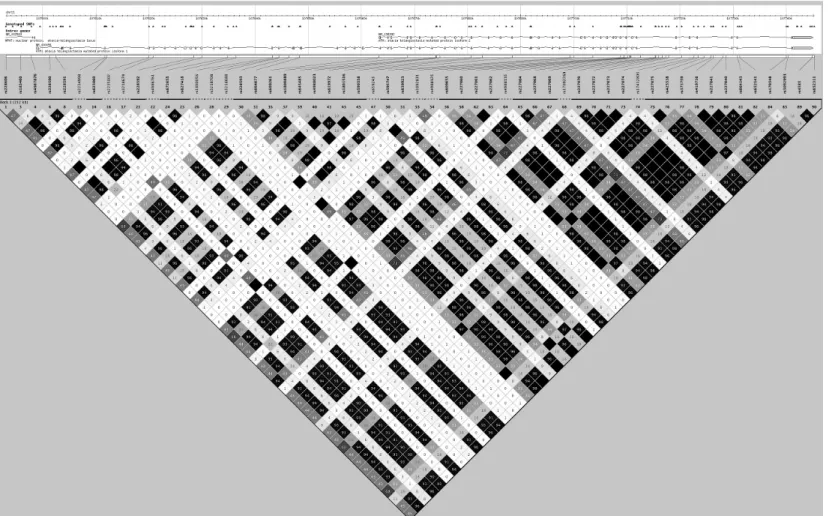
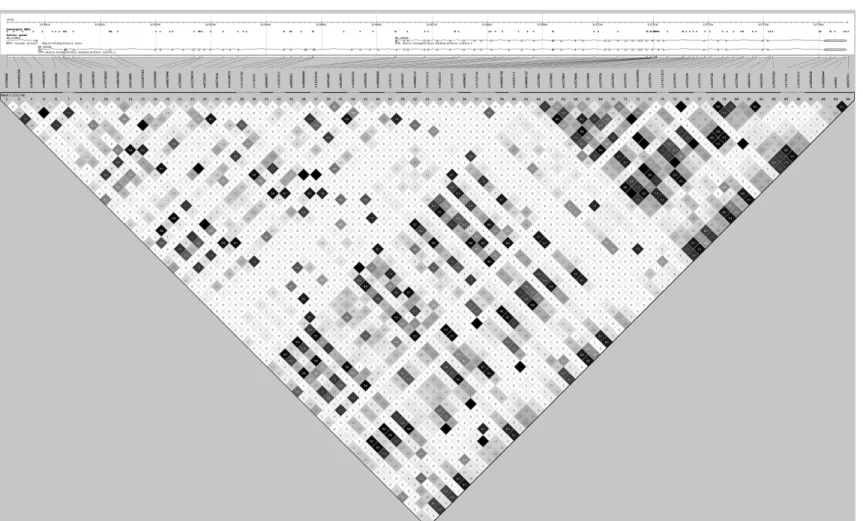
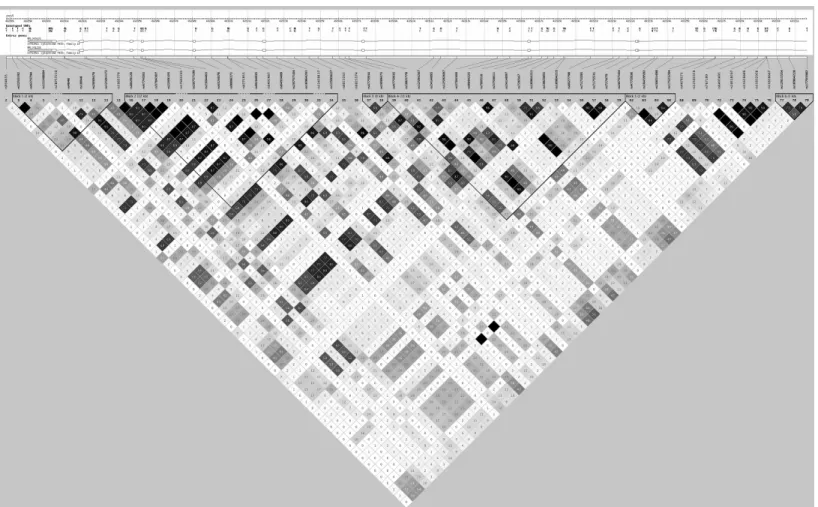
discrepancies in genetic risk factors by hormone receptor status. In a large consortium study, Cox et al. [160] identified a SNP in ATM (rs1800054) that was positively associated with PR+ breast tumors. Barroso et al. [161] replicated this association for nine SNPs in the same LD block (see Figures 2 and 3) [161]. Most SNPs in this LD block had no association with ER status, though three SNPs were positively associated with ER- disease [162, 163]. LD blocks were defined using Haploview (Haploview 4.2, Version 1.0, Broad Institute,
Cambridge, MA, USA) [164], International HapMap version 3, release 2 for Utah residents with ancestry from northern and western Europe (CEU) and Yorubans from Ibadan, Nigeria (YRI) populations [9], and haplotype block criteria established in Gabriel et al. [165].
Although the association between breast cancer and TERT was first identified through a candidate gene approach, the only study with subtype-specific effect estimates is a genome-wide association study of African American and triple-negative cases [166]. Here,
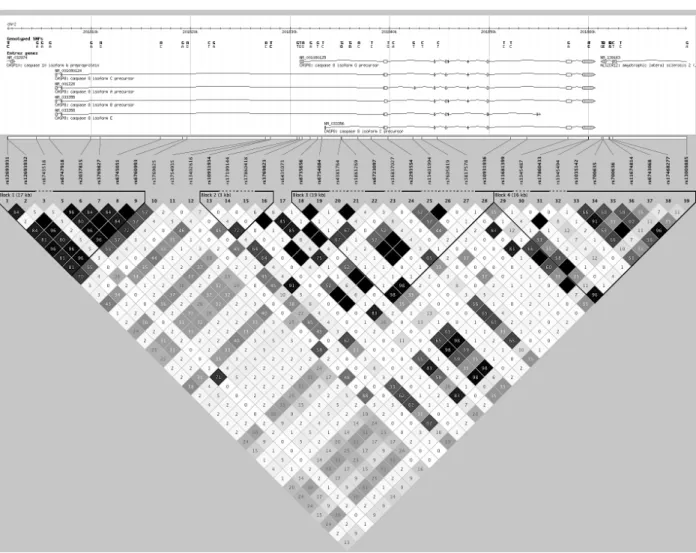
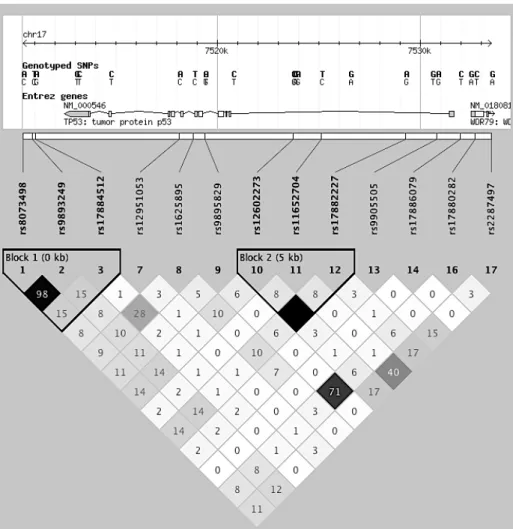
rs10069690 was a strong, positive genetic risk factor for triple-negative breast cancer. In a different pooled analysis of triple-negative cases, Stevens et al. [167] identified a rs17468277 in CASP8 (Figures 4 and 5) that was inversely associated with triple-negative disease. Two other SNPs in CASP8 (rs1861270 and rs1045485) were associated with all breast cancer subgroups with approximately equal magnitude and direction [160, 162, 168-170]. Lastly, multiple studies of rs1042522 in TP53 (Figures 6 and 7) indicated a possible positive association between the SNP and ER+ disease [171-174].
2.7.3 Genome-wide association studies
A genome-wide association study (GWAS) is “a study that compares the complete DNA of people with a disease or condition to the DNA of people without the disease or condition” [183]. In practice, GWAS examine the association between a disease of interest and at least 100,000 SNPs selected to represent the entirety of the genome via LD patterns. To be established as a true GWAS-hit, a SNP must have a p-value <1 x 10⁻⁵ in the overall study population, which usually includes the original sample and one or more replication samples [184]. In practice, this α-level is often set as high as 5 x 10⁻⁸, as this corresponds to α=0.05 corrected for 1,000,000 independent SNP tests.
As of January 2013, 23 breast cancer GWAS have been published, the first of which was published in June 2007. Basic descriptions of these 23 studies and the GWAS-significant SNPs identified by each can be found in Table 4. All information was downloaded from the National Human Genome Research Institute Catalog of Published Genome-Wide Association Studies [185].
189-191, 193, 194, 200-202], 4 on chromosome 11 (MYEOV/CCND1, BARX2, and2 on LSP1) [189, 194, 199], 1 on chromosome 12 (12q21.1) [188], 1 on chromosome 13 (ABCC4) [188], 2 on chromosome 14 (RAD51L1 and GALC) [186, 203], 1 on chromosome 15 (FBN1) [188], 4 on chromosome 16 (3 on TOX3 and GLG1) [186, 187, 189-191, 194, 204, 205], 1 on chromosome 17 (COL1A1) [188], 1 on chromosome 18 (18q21.2) [188], 3 on chromosome 19 (19p13.11, ABHD8 and ZNF577) [195, 198, 206], 1 on chromosome 20 (RALY) [198]and 1 on chromosome 21 (GRIK1) [188]. Li et al. [207] conducted a GWAS among women with ER- disease, but failed to identify any genome-wide significant associations. Of the
remaining 22 GWAS studies, 13 provided effect estimates stratified by hormone-receptor status [186, 187, 189, 192, 193, 197-200, 203-206], though this was usually limited to those SNPs achieving GWAS-significance.
Of the 58 GWAS SNP hits and 9 nearly GWAS-significant SNP hits, 31 were successfully genotyped in Carolina Breast Cancer Study (CBCS) participants and are thus included in this review. The other GWAS hits were either not yet discovered at the time the genotyping was requested or failed preliminary quality control checks. This review also covers several additional SNPs from GWAS-identified genes that were genotyped by CBCS investigators to augment analyses of these genomic regions. A brief discussion of each of these regions is described below and in Table 5. Unless otherwise noted, this table includes the range of estimates for log-additive models with the major allele in the HapMap CEU population as the referent genotype [9]. Also included in this table are minor allele
frequencies (MAFs) from the HapMap YRI population and African Americans living in the Southwest USA (ASW). Results from studies conducted in special populations (e.g. women with BRCA1 or BRCA2 mutations or women with contralateral disease) are not included in these summary tables. Previously reported effect estimates from the CBCS population are also excluded [210]. Lastly, as few studies collected data on HER2 status and even fewer collected data on intrinsic breast cancer subtypes, the term ‘subtype’ is used to indicate any type of differentiation by IHC marker status.
2.7.3.1 1p12: rs11249433
Subtype analyses indicated that the SNP was most strongly associated with ER+, PR+, HER2-, Luminal A and Luminal B breast cancer [167, 169, 186, 212, 214, 217]. 2.7.3.2 2p: rs4666451
As mentioned previously, SNP rs4666451 just missed the criteria for GWAS significance in Easton et al. [194], with p=6 x 10⁻⁵ and OR=0.97 (95% CI: 0.94-1.00) for a log-additive model. Three of four subsequent studies confirmed the approximate magnitude and direction of the association [162, 186, 211, 218]. The effect was similar in both ER+ and ER- breast cancers, but there was no clear association with HER2 status [162, 186]. No studies have examined the effect of rs4666451 among African Americans.
2.7.3.3 2q35: rs13387042
Despite its location in a gene desert, rs13387042 is one of the most well studied breast cancer-related polymorphisms. Approximately half of all women of European descent carried the variant allele [162, 168, 169, 186, 187, 189-191, 213, 218-223], as did 25-30% of all African Americans [11, 12, 169, 187, 214-216]. Among women of European ancestry, each copy of the variant allele was associated with a 10-15% reduction in the odds of getting breast cancer. The association was weaker and less precise in African Americans, but seemed consistent for each subtype versus control comparison, including ER+, ER-, PR+, PR-, HER2+, HER2-, luminal A, luminal B, HER2+/ER-, triple-negative, and basal-like breast cancer [162, 167, 168, 169, 187, 198, 214, 216, 217, 219, 221, 222, 224].
2.7.3.4 SLC4A7: rs4973768
of 1.08-1.16 [168, 169, 189-191, 209, 211, 220, 223]. In contrast, the SNP had a much weaker and statistically null association with breast cancer among African Americans [11, 169, 214-216]. A recent meta-analysis found a strong overall association between the SNP and breast cancer, but null effects when limited to women of European or African ancestry [225]. In subtype-stratified analyses, rs4973768 was most strongly associated with luminal A breast cancer, with no apparent association with triple-negative disease [167-169, 209, 214, 216, 217, 226].
2.7.3.5 4p: rs12505080 and TLR1: rs7696175
These SNPs were identified in a GWAS investigation using participants of the
Nurses’ Health Study [201]. In both cases, effect estimates for log-additive model showed no association, but general model estimates indicated that compared to women homozygous for the wildtype allele, heterozygotes had an increased risk of breast cancer (OR=1.22, 95% CI: 1.02-1.45 for rs12505080 and OR=1.39, 95% CI: 1.15-1.68 for rs7696175), while women homozygous for the minor allele had a decreased risk of breast cancer (OR=0.51, 95% CI: 0.35-0.73 for rs12505080 and OR=0.86, 95% CI: 0.67-1.09 for rs7696175). These patterns were replicated in Stage II of Hunter et al., but no other studies have examined the
association. To date, no one has examined subtype differences in the effect of rs7696175 in whites or African Americans, but one study of Chinese women observed statistically
significant associations between one or more copies of the minor allele and ER- and HER2- disease [227].
2.7.3.6 MRPS30: rs4415084 and rs10941679
associated with breast cancer risk. Fletcher et al. confirmed the association of rs4415084 and breast cancer in a later GWAS [190].
Among women of European ancestry, each copy of the rare variant at rs4415084 or rs10941679 conferred a 10-15% increase in the odds of breast cancer [169, 186, 190, 191, 208, 211, 220, 223, 228-230]. These SNPs were not correlated in HapMap YRI (r2=0.12) and effect estimates among African American women were inconsistent, with many null findings [11, 12, 169, 208, 214-216, 231]. Both SNPs showed stronger associations with ER+, PR+, luminal A, and luminal B cancers, with null associations with ER-, PR- or triple-negative disease [167, 169, 186, 198, 208, 214, 216, 217, 230, 231].
2.7.3.7 5p12: rs981782
In 5 separate study populations, the presence of a rare variant at rs981782 was inversely associated with breast cancer risk in women of European ancestry [162, 194, 208, 218, 230]. In the only study to report subtype-stratified estimates, Reeves et al. [162] observed a similar reduction in risk in ER+, ER- and HER2+ disease. rs981782 was not polymorphic in women of African descent.
2.7.3.8 5q: rs30099
2.7.3.9 MAP3K1: rs889312
SNP rs889312, located on the MAP3K1 gene on chromosome 5, was equally common in women of European and African descent, with a MAF of approximately 30%. The 10-15% increase in risk was well-replicated among women of European descent [162, 168, 169, 189, 194, 213, 218, 220, 222, 229, 232-237], but was weak or null in African American women [11, 169, 214-216, 236, 238]. A meta-analysis including 6 separate studies estimated a pooled OR of 1.09 (95% CI: 1.07-1.12), assuming a log-additive model [239]. Subtype-stratified analyses indicated that the SNP was associated with approximately equal risk increases in all disease subtypes, including ER+, ER-, PR+, PR-, HER2+, HER2-, luminal A, luminal B, HER2+/ER-, triple-negative and basal-like breast cancer [162, 167-169, 198, 214, 216, 217, 222, 224, 226, 232, 234, 236, 238, 240].
2.7.3.10 ECHDC1: rs2180341
Gold et al. [196] discovered rs2180341 in a GWAS conducted among Ashkenazi Jewish women with strong family histories but no BRCA1 or 2 mutations. Kirchhoff et al. [241] replicated these findings in both Jewish and non-Jewish women, but two other investigations yielded only null results [169, 213]. The SNP was not associated with breast cancer in African Americans [11, 12, 215, 216, 241] and subtype analyses generated predominantly null findings [169, 216, 241].
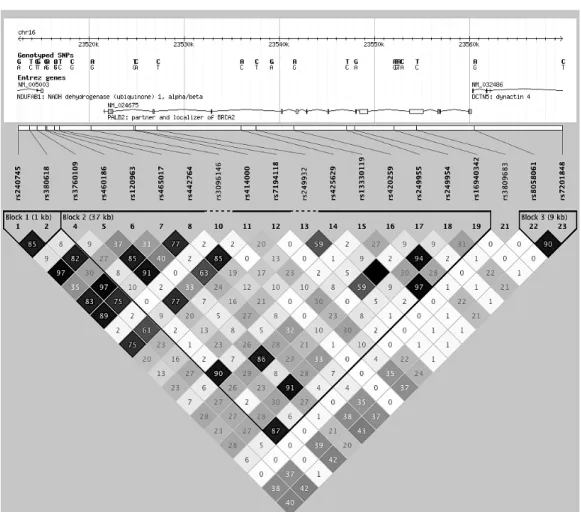
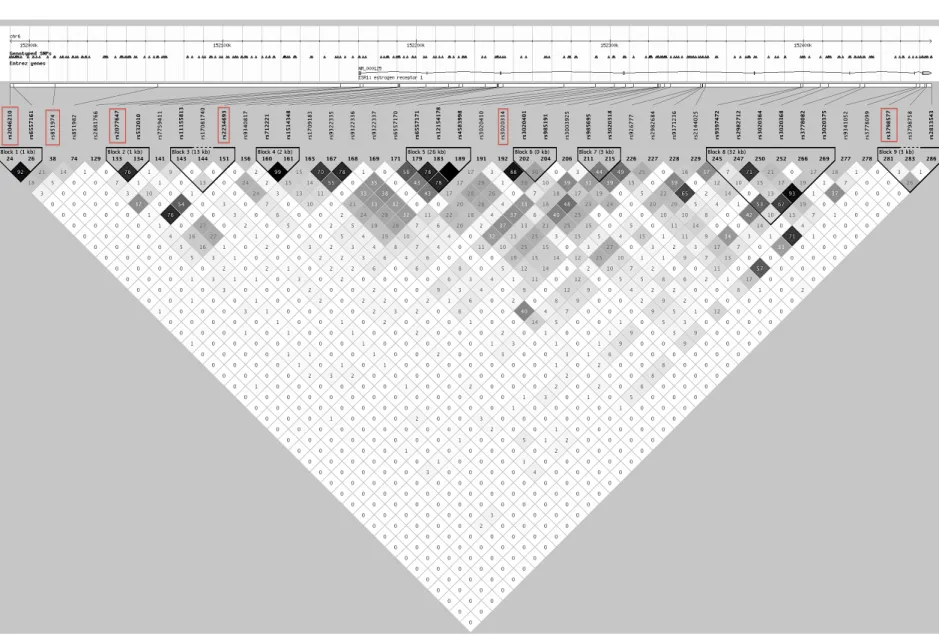
2.7.3.11 ESR1: rs2046210, rs851974, rs2077647, rs2234693, rs1801132, rs3020314 and rs3798577
association among women of European ancestry [169, 242, 243], with a fourth smaller study reporting null results [213]. rs2046210 had no effect on breast cancer in a study of African Americans [12], but a nearby correlated SNP (r2=0.38 in YRI), rs851974, had a positive association with the disease [12]. Most of the seven other studies of rs2046210 in African Americans estimated near-null associations [11, 169, 197, 214-216, 242, 243]. Subtype-stratified analyses suggested that rs2046210 had a positive association with all subtypes, though most of these analyses were conducted in Asian women [167, 169, 192, 197, 198, 214, 216, 217, 224, 226, 227, 242, 244].
As ESR1 is the gene responsible for encoding the alpha form of estrogen receptors, it is a frequent candidate in studies of genetic risk factors for breast cancer. Among the most frequently studied SNPs are rs2234693 (also known as the Pvull T397C mutation),
2.7.3.12 RELN: rs17157903
SNP rs1715903 in RELN was strongly associated with breast cancer in Hunter et al. [201], but fell short of GWAS-defined significance levels in both the original and replication analyses. No other investigators have attempted to validate the association in whites or African Americans.
2.7.3.13 8q24: rs13281615 and rs1562430
A gene desert on 8q24 contains two SNPs that are strongly associated with breast cancer. rs13281615 was identified in the first breast cancer GWAS [194] and rs1562430 was identified a few years later [189]. These SNPs were in the same LD block in HapMap CEU (r2=0.43) but not YRI (r2=0.25). More than a dozen studies have validated the association between rs13281615 and breast cancer, with effect estimates ranging from 1.07 to 1.31 for the log-additive model [162, 168, 169, 189, 213, 218, 220, 229, 232-235, 237, 245]. The polymorphism was equally common in African Americans (MAF≅0.43) as in whites, though most studies observed only null associations [11, 12, 169, 214-216]. In subtype-specific analyses, rs13281615 was most strongly associated with luminal A and B tumors [162, 167-169, 198, 214, 216, 217, 232, 234, 246], with no observed association with triple-negative disease. rs1562430 was re-assessed in two other GWAS investigations and one replication study, all of which confirmed the inverse association between the rare variant and all breast cancer in women of European descent [186, 190, 223]. In a Chinese GWAS, rs1562430 was associated with ER+, ER-, PR+ and PR- disease [192].
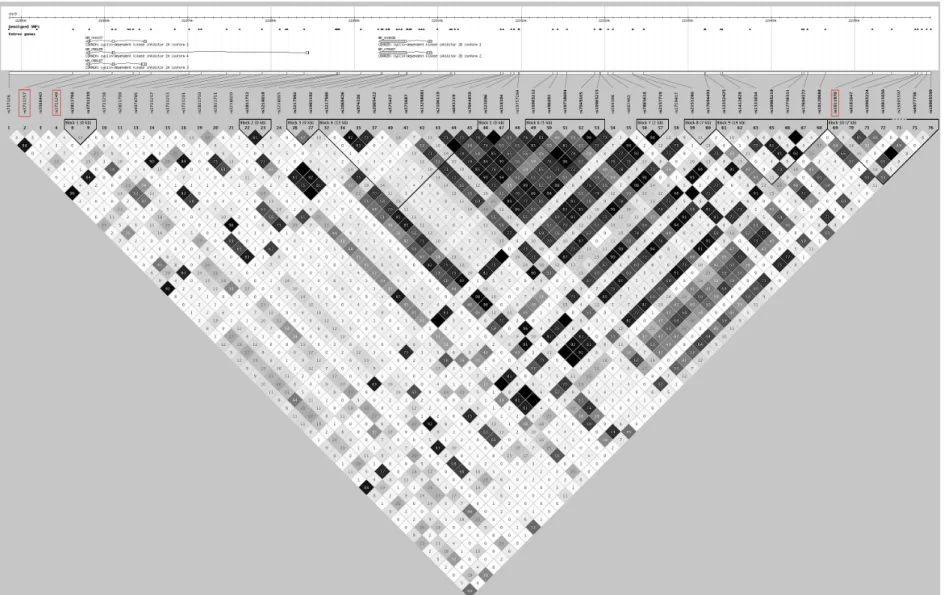
2.7.3.14 CDKN2A/CDKN2B: rs1011970, rs3731257 and rs3731249
studies of African Americans [11, 214-216] reported predominantly null associations. In both studies of whites, each additional copy of the rare allele was associated with an increased risk of 5-10%. In limited subtype analyses, rs1011970 was positively associated with ER+ breast cancer and triple-negative breast cancer, but not ER- breast cancer [167, 189, 198, 214, 216, 247]. Although poorly studied, analysis of rs3731257 and rs3731249 may provide additional information about the role of the CDKN2A/CDKN2B region, as both are located downstream of CDKN2A, rather than upstream of CDKN2B, as is the case with rs1011970 (Figures 14 and 15). In previous analyses, rs3731249 (A148T) was strongly associated with breast cancer in young Polish women (OR for dominant model =1.5, p=0.0002) [248], but rs3731257 had no effect in a population of British women (OR for homozygous variant versus homozygous wildtype= 0.95, 95% CI: 0.74-1.20) [249].
2.7.3.15 ANKRD16: rs2380205, ZNF365: rs10995190, and ZMIZ1: rs704010