THE PUBLIC AND PRIVATE SECTOR
FAMILY PLANNING SUPPLY ENVIRONMENTS AND THEIR INFLUENCE ON
CONTRACEPTIVE USE IN URBAN NIGERIA
Jessica K. Levy
A dissertation submitted to the faculty of the University of North Carolina at Chapel Hill in partial fulfillment of the requirements for the degree of Doctor of Philosophy in the Department of Maternal and Child Health in the Gillings School of Global Public Health.
Chapel Hill 2013
ABSTRACT
JESSICA K. LEVY: The Public and Private Sector Family Planning Supply Environments and Their Influence on Contraceptive Use in Urban Nigeria
(Under the direction of Siân L. Curtis)
Background: Over 50% of the world lives in an urban area. The highest rate of urban population growth is in Sub-Saharan Africa, where fertility rates remain high. To slow population growth and improve health and well-being, family planning (FP) advocates argue for increasing the use of modern FP through improved contraceptive access and availability. However, important questions remain about the best way to promote contraceptive use in countries with high fertility.
Purpose: The overarching aim of this dissertation was to explore the influence of the urban public and private FP supply environments on modern contraceptive use.
Results: Data showed pronounced variability in contraceptive access and availability across LGAs in both sectors, a positive correlation between public and private sector supply environments and localized associations between the supply environments and poverty. Furthermore, after controlling for influential covariates, analyses found that a woman’s
perception of supply had a significant positive effect on contraceptive use, whereas her
actual immediate supply environment had negligible influence.
ACKNOWLEDGMENTS
First, I would like to thank the members of my dissertation committee – Drs. Siân Curtis (chair), Karen Foreit, Herbert Peterson, Ilene Speizer and Catherine Zimmer – for their guidance, endless encouragement and superb mentoring. It has been an honor to have the greatest minds in the field take my ideas seriously and care enough to challenge me to do my best work.
I would also like to thank the Bill & Melinda Gates Foundation, as well as the
Measurement, Learning & Evaluation Project for allowing me to use the data from the 2010-2011 baseline survey of the Nigerian Urban Reproductive Health Initiative. I am also grateful to Janine Barden-O’Fallon for her friendship, patience and support throughout this whole process, as well as Meghan Corroon for her insights into the data collection and analysis and for answering my many many questions.
I would be remiss not to thank the numerous strong women with whom I have worked over the years. Whether they live in Latin America, Sub-Saharan Africa or rural North Carolina, it is because of these women that I went into Maternal and Child Health in the first place. And it has been their unwavering courage and determination to improve their own lives and those of their families that has kept me inspired and working in a field that often presents what can feel like insurmountable challenges.
TABLE OF CONTENTS
List of Tables...ix
List of Figures ...x
List of Abbreviations ...xi
Chapter 1: Introduction ...1
High Fertility and the Demographic Transition...1
The Demographic Transition and the Role of Family Planning……...2
Increasing Contraceptive Use………..……….……..4
Urban Supply Environment and Contraceptive Use ...6
The Literature ...7
Chapter 2: Research Aims and Data ...10
Aims and Research Questions...10
Study Setting ...12
Data ...14
Chapter 3: Assessing Gaps and Poverty-Related Inequalities in the Public and Private Sector Family Planning Supply Environments of Urban Nigeria………...17
Brief Overview ...17
Study Sample ...18
Measures ...19
Analysis….………....23
Findings ...…...24
Chapter 4: Does a Woman’s Immediate Contraceptive Supply Environment
Influence Her Use or Intention to Use Family Planning?...45
Brief Overview...45
Operational Hypotheses...47
Sample...49
Measures...50
Analysis...56
Findings...60
Discussion...66
Chapter 5: Conclusions and Implications ...73
Programmatic Implications...74
Research Implications...76
Concluding Remarks.………..78
APPENDIX A: Steps for creating local government area (LGA) level variables that were used to measure family planning (FP) supply environment “strength” for each service delivery point (SDP) type...80
APPENDIX B: Number of family planning (FP) service delivery points (SDPs) per local government area (LGA) used to create LGA-level strength of contraceptive access and availability…………...…………..………..82
APPENDIX C: Number of surveyed Patent Medicine Store (PMSs) versus actual number of PMSs in total frame by local government area (LGA)………….….…..83
LIST OF TABLES
Table 2.1: Sampling approach by city for each type of service delivery point ………...16 Table 3.1: Critical measures used to reflect the family planning (FP) supply
environment at the local government area (LGA) level ………22 Table 3.2: Summary statistics for the strength of the supply environment
among different types of family planning service delivery points across
local government areas (LGA)………..25
Table 3.3: Summary statistics of the family planning (FP) service density among different types of FP service delivery points (SDPs) across local
government areas (LGAs).……….27
Table 3.4: Family planning (FP) service density by urban area (SQKM) and
size of urban population within each local government area (LGA)...29 Table 3.5: Family planning supply environment strength, size and supply
index score (SIS) for each type of FP service delivery point within each
local government area (LGA)...31 Table 3.6: Distribution of city’s poorest women across local government
areas (LGAs) compared to public and private family planning supply index
scores (SIS)...………..38
Table 4.1: Study Measures ...50 Table 4.2: Distribution of supply index scores for each type of family planning
service delivery point (SDP) across local government areas (LGAs)...52 Table 4.3: Percent distribution and means of covariates…………...55 Table 4.4: Table 4.4: Percent distribution of perception of family planning (FP)
supply and the supply index scores (SIS) by local government area (LGA)
and type of FP service delivery point (SDP)...61 Table 4.5: Results of ordinary least squares regression analyses examining
the relationship between family planning (FP) supply and perception of
FP supply...62 Table 4.6: Odds ratios and standard errors for the pathways from family
planning (FP) supply and perception of FP supply to the outcomes of
LIST OF FIGURES
Figure 1.1: Demographic Transition...2
Figure 1.2: Possible pathways from the family planning supply environment to contraceptive use………..………5
Figure 2.1: Map of Nigeria………12
Figure 3.1: Steps taken to create the supply index score for each type of family planning (FP) service delivery point (SDP) within each local government area (LGA)………...…...21
Figure 3.2: Family planning (FP) service density by size of urban local government area (LGA) population in each LGA…...28
Figure 3.3: Significant positive correlations between local government area (LGA) supply index scores by type of family planning service delivery point...32
Figure 3.4: Public health facility supply index scores by region…...34
Figure 3.5: Percentage of sample in each local government area that falls within Q1...36
Figure 3.6: Percentage of city’s total Q1 who live within each urban LGA...37
Figure 4.1: Conceptual Model...48
LIST OF ABBREVIATIONS
CPR………Contraceptive Prevalence Rate
DHS………Demographic Health Survey
FP………...Family Planning
GIS……….Geographic Information Systems
HF………...Health Facility
LGA……….…Local Government Area
MLE………Measurement, Learning & Evaluation
NURHI………Nigerian Urban Reproductive Health Initiative
PMS………Patent Medicine Store
SDP………Service Delivery Point
SIS………..Supply Index Score
TFR……….Total Fertility Rate
CHAPTER 1
Introduction
High Fertility and the Demographic Transition
The past half of a century has witnessed a worldwide fall in fertility; however, the decrease has taken place at different times and rates within and across countries. Based on the Demographic Transition Theory, a population will naturally progress from high fertility and mortality to low fertility and mortality over a period of four stages. During the first and last stages there is little population growth; however, during the middle stages, births out number deaths, resulting in a population increase.1 (See Figure 1.1) Many of the poorest countries, especially those in Sub-Saharan Africa, are behind in the demographic transition. Mortality has begun to fall, but fertility rates remain high.1, 2
The United Nations (UN) estimates (2010) that at prevailing age-specific fertility rates, a 15 year old in less developed regions of the world can be expected to have 2.7 children in her reproductive lifetime; and in least developed regions – such as Sub-Saharan Africa – she can be expected to have 4.4 children.3 If these fertility rates remain at their current estimated levels, and mortality continues to fall, the population of developing countries would increase to 9.7 billion in 2050 and 25.8 billion in 2100, instead of the projected 8.0 billion and 8.8 billion, assuming that fertility declines.a That is, without further
a Over the next decade, the number of women of reproductive age (15-49 years) is expected to grow from the estimated 1.7 billion in 2005 to approximately 1.9 billion globally in 2020.4The majority of these women will reside in developing countries where fertility levels remain high.3 In fact, the
reductions in fertility, the world population in 2100 could increase by nearly six times as much as currently projected.3, 4
Population growth is not the only concern related to high fertility. High fertility is linked to important factors associated with health, education, economic opportunity, gender equality and environmental stability. In sum, it influences a woman’s quality of life and that of her family and the population as a whole.5, 6
The Demographic Transition and the Role of Family Planning
Considering the consequences of high fertility, scholars have debated for decades as to what determines fertility trends.1, 7, 8b Family planning (FP) advocates argue that in order
to sustain (or even accelerate) the demographic transition and achieve reductions in fertility,
b Bongaarts (1978) proposed a framework that is still used today for analyzing the proximate
determinants of fertility, suggesting that four main factors have a direct effect: 1) marriage (age at marriage and proportion of women married); 2) contraception (contraceptive use and effectiveness of method); 3) abortion (proportion of pregnancies that are terminated); and 4) infecundity (through lactational amenorrhea or sterility).7 How these factors affect fertility directly is well understood and relatively straightforward. However, why couples decide to delay sexual debut and marriage, use contraception, breastfeed, or seek an abortion depends on certain values and is influenced by social, political, economic and programmatic factors. The pathways from these distal determinants are more complex and are not fully understood or agreed upon.1,2,8
Figure1.1 Demographic Transition*
the focus should be on increasing the use of modern contraception.9 However, there has
been a longstanding debate as to how and/or to what extent FP use can be promoted in a country behind in the demographic transition. On the one side, there are social scientists and economists who have claimed that high fertility is a rational response to poverty, and that contraceptive use will not increase until there is improved education and economic development.10-12 On the other side, proponents of FP maintain that regardless of national
poverty, health, and education levels, contraceptive use will increase – and fertility desires and outcomes will change – by meeting FP needs more quickly, effectively and equitably through active intervention.13
A much-cited example of this success is in Bangladesh. When Pakistan and
Bangladesh (formally east Pakistan) split in 1971, they took different national approaches to population growth. Unlike Pakistan, Bangladesh made FP a priority and, in response, received significant funding from international donors. The resulting difference in population growth is indisputable.1 Starting at a shared total fertility rate (TFR) of approximately 71, Pakistan's TFR was 5.3 in 2001 and is currently 3.6; whereas Bangladesh’s TFR was 3.3 in 2001 and is now 2.4.14 Furthermore, between now and 2050, Pakistan's population is projected to grow by 77% to almost 314 million, while Bangladesh’s population is expected to increase by only 50% to almost 226 million.14
The example of Bangladesh and Pakistan does not stand alone. In general, over the past half of a century, while new contraceptive technologies, programs and policies
burgeoned around the world, contraceptive use simultaneously increased and global fertility desires diminished.9, 13, 15 By the late 1970s, approximately 25% of all developed and
developing countries had adopted voluntary FP programs to lower their national TFR. Just two decades later that number had increased to almost 45%.13 Now, over 80% of developing
contraceptive prevalence has also increased globally; up to 60% in some regions of the world, where it had been 10% before.17 Furthermore, the most recent data from 2005-2010
show that fertility has declined by more than 20% in 135 developing countries and by over 50% in 66 of them. These declines bring the average TFR in less developed regions from 5.4 to 2.7 children per woman of childbearing age.3
Increasing Contraceptive Use
Despite major progress in increasing contraceptive use and decreasing fertility rates, it has been estimated that over 220 million women living in developing countries still have an unmet need for modern contraceptionc, with 162 million of these women living in the 69 poorest countries.19, 20 Hence, important questions remain about the most effective ways to promote FP in countries behind in the demographic transition.
Many FP professionals argue that the current unmet need is predominantly a result of issues related specifically to contraceptive access and availability, and that contraceptive use will therefore increase through improved availability of contraceptive commodities and universal access to FP services.1, 4, 8, 19, 21, 22 For example, initiatives like Family Planning
2020 (FP2020) have been launched to improve contraceptive supply in order to meet the needs of the existing and rapidly growing potential demand for contraception. Leaders from developing and donor countries, international agencies, foundations and the private sector have pledged $2.6 billion to provide an additional 120 million women in the world's poorest countries access to voluntary FP services, information and supplies by 2020.22 Likewise, the
United States Agency for International Development (USAID), along with other international donor agencies, have spent the last few decades funneling resources into activities that
promote “contraceptive security,” a term that characterizes the possibility for people to
choose, obtain, and use high-quality contraceptives whenever they want or need them.4, 21, 23
Somewhat implicit to the goals of these initiatives is the assumption that unwanted fertility and “potential demand” for FP will translate into actual demand for contraception if FP services are easily accessible and reliable contraceptive commodities are in stock. For this assumption to hold, contraceptive access and availability – from here forward referred to as the supply environment – would likely increase contraceptive use via one of three
pathways.24 (See Figure 1.2) First, a better supply environment might change fertility desires
(and ultimately contraceptive use behaviors) by increasing a woman’s exposure to the idea of regulating fertility and altering social norms regarding family size. Second, exposure to a better supply environment could improve the social acceptability of contraceptive use, thereby changing latent demand for fewer children into actual demand for FP. Third, assuming that a woman wants to use modern contraception, the supply environment could facilitate her use by providing a reliable stock of quality contraceptive commodities and reducing the economic, psychosocial and physical barriers to using them.24
Figure 1.2: Possible pathways from the family planning supply environment to contraceptive use
Fa
m
il
y
P
la
nni
ng
S
uppl
y
En
v
ir
o
n
m
e
n
t Desire to
limit or delay pregnancy
Intent to contracept
Urban Supply Environment and Contraceptive Use
Contraceptive ever-use and current-use are typically higher in urban areas than in rural areas.25-27 One explanation for this difference is that women in urban areas have more
exposure to information about FP, as well as access to a broader range and supply of FP services and distribution outlets than women in rural areas.28-31 As a result, the literature often focuses on issues related to contraceptive access and availability in rural areas of the developing world, rather than in urban areas.31-35
This dissertation, however, focuses on the urban FP supply environment for three main reasons. First, despite better overall aggregate level measures, evidence suggests significant disparities in fertility rates and contraceptive use behaviors among urban wealth quintiles.36-42 These differences can be attributed to both increased levels of unmet need for FP, as well as higher fertility desires among the urban poor.25, 36, 37 Regardless, the
consequences of these inequalities spiral from an increased number of high-risk
pregnancies among the urban poor to a greater need for health service utilization, often decreased opportunity for employment and/or higher education43 and increased maternal and infant morbidity and mortality44 within the lower wealth quintiles; all of which, in turn,
highlights the importance of finding an effective way to create and/or meet urban demand for contraception so as to help break the cycle of urban poverty and health inequality.43, 45
Second, unlike in rural areas, the commercial infrastructure and purchasing power that exist in urban areas allows for many private FP initiatives. It is true that with a larger private sector to supplement the public sector, urban residents are generally exposed to a greater range of FP services and distribution outlets than people living in rural areas.26,46, 47
Nevertheless, in general, there is no consistent pattern as to how the private FP sector interacts with the public FP sector,26, 48 and little is known about whether and/or how the
relationships between different service outlets and contraceptive use can allow program planners and policy makers to better target limited resources for possibly generating
demand for contraception in countries behind in the fertility transition, as well as for meeting the FP needs that already exist there.
Finally, the world is becoming more urbanized, and at more than 3% annually, the highest rate of urban population growth is in Sub-Saharan Africa.3, 41, 49Due in large part to
high levels of urban fertility in this region, the percentage of the world’s population living in an urban area will increase from the current 50% to two-thirds by 2050.36, 50 As the
population increases in urban areas, so will unmet need for FP.26, 48 In light of this rapid
urbanization, program planners and policy makers will need to better understand the role of the urban supply environment in contraceptive use, in order to intervene effectively in urban areas and promote contraceptive use in countries behind in the demographic transition.
The Literature
The best way to effectively estimate the influence of contraceptive access and availability on the use of FP would require longitudinal contraceptive-use data for a panel of women with known contraceptive demands that could be linked to facility-level data within the same area unit.24 Until recently, however, studies exploring this relationship have been
limited due to the fact that few facility-level surveys have been collected around the same time as household surveys and/or were not collected in a manner that facilitated strong data linking.51, 52
early DHS service modules came primarily from key informants; therefore, some argued that the data may not have been valid or reliable.54, 55 Furthermore, the information was not
representative of all service outlets in the country being surveyed.53
Magnani et al. (1999) took advantage of one of the few panel surveys conducted by the DHS that included a SAM.24 They found that method availability at the nearest public
facility significantly influenced contraceptive intentions and use.However, in addition to questions of service-data reliability and generalizability, they highlighted the risk of bi-directionality, pointing out the possibility that the FP programs had targeted areas where there was already a high demand for use.24
Since the 1990s, DHS has conducted the Service Provision Assessment (SPA), a supplemental survey to collect information related to the health service environment,
including services related to FP. The SPA collects latitude and longitude coordinates for the health facilities, which can be linked to geographic information collected for the sample clusters in the DHS surveys.53 Hong et al (2006), for example, linked 2003 Egypt Interim DHS data to 2002 Egypt SPA data.56 They found a significant relationship between service quality and use of clinical contraceptive methods in Egypt. However, they point out that women in the linked clusters do not necessarily use the facilities to which they have been linked.56 Therefore, linking the SPA and DHS data may not be conducive for analyzing individual-level outcomes.
Wang et al. (2012) linked data from DHS and SPA surveys in four Sub-Saharan countries to measure the extent to which contraceptive use is associated with regional contraceptive supply.53 They found that after controlling for FP facility density and other
management practice) are more likely to use a modern contraceptive method than women living in less favorable environments. However, the authors point out a few limitations with their linked data. To begin, though the sample design of SPA surveys provides
representative data of health facilities in the country, information on the facilities nearest to the DHS clusters may not be included. Also, the SPA and DHS data were not collected within the same year. It is possible, therefore, that the facility data might have changed between the time that the SPA and DHS information was collected.24, 53
In addition to linking issues, the work conducted by Wang et al. is one of few studies that has explored the influence of contraceptive supply on use within Sub-Saharan Africa. Most research on this topic has focused mainly on countries in Asia, Latin America and North Africa.24, 56-59 Furthermore, studies focused on intra-urban supply dynamics have been
limited by a lack of fine-grained data describing the urban public and private sector FP supply environments. Finally, in many areas of the developing world there has been poor monitoring of the private FP sector, making it difficult to attain reliable private sector data for analysis.48, 60
Considering the increasing need to improve contraceptive use in countries such as those found in Sub-Saharan Africa, and the reality of rapid urbanization, program planners and policy makers should have a better understanding of the relationship between the supply environment and contraceptive use in urban areas of the region. Such an
CHAPTER 2
Research Aims and Data
Aims and Research Questions
This dissertation uses Nigeria – a country in the early stages of the demographic transition – as a case study to explore the role of the urban family planning supply environment. First, it describes Nigeria’s urban supply environment, by creating and analyzing measures that reflect aggregate levels of contraceptive access and availability among public and private service outlets. It then investigates the potential influence of this environment on contraceptive use and intention to use among urban residents. The following specific aims are addressed:
AIM 1:To describe the public and private sector family planning supply environment in urban Nigeria in order to identify patterns and assess whether and where disparities in contraceptive access and availability exist
Question 1.a. Are public sector measures for contraceptive access and availability constant
across local government areas (LGAs)? If not, how do they differ?
Question 1.b. Are private sector measures for contraceptive access and availability
Question 1.c. Is the public sector contraceptive supply environment correlated with the
private sector supply environment? If so, how is contraceptive access and availability
among private and public service delivery points correlated within and across LGAs?
Question 1.d. Is the level of contraceptive access and availability among the public and/or
private family planning sectors correlated with the distribution of community-level
wealth within and across cities? If so, how are they correlated?
AIM 2:To explore the relationship between a woman’s immediate family planning supply environment (in terms of public and private access to and availability of contraceptive commodities) and her contraceptive use outcomes (non-use, intent to use family planning and actual use of modern contraception)
Question 2.a. Does the public and/or private family planning supply environment in which a
woman lives have a direct effect on her contraceptive use outcomes?
Question 2.b. Does a woman’s public and/or private supply environment influence her
perception of contraceptive access and availability?
Question 2.c. Does a woman’s perception of contraceptive access and availability mediate
the influence of the supply environment on her contraceptive use outcomes?
Question 2.d. Does a woman’s perception of contraceptive access and availability have a
Study setting
Nigeria is located in the western region of Sub-Saharan Africa (See Figure 2.1). It borders the coast of the Gulf of Guinea between Benin and Cameroon- with Niger to the north and Chad to the northeast. Slightly more than twice the size of California, Nigeria is the most populous country in Africa. As of 2012, Nigeria was home to approximately 170 million people,50 and with almost 44% of the country under 14 years old, that number is
expected to double in less than 25 years.25, 50 According to UN estimates (2011), it will be
one of six countries that will account for half of the world’s projected population increase by 2100.3
Figure 2.1: Map of Nigeria
Most of Nigeria’s population growth will occur in its urban areas. As compared to its overall annual growth rate of 2.5%, the country’s urban growth rate is 3.75%.50 Already, over
half of the population lives in an urban area, and by 2050, that proportion is projected to
increase to three quarters.28 Due to rapid urbanization, urban Nigeria suffers from an acute
shortage of social amenities and insufficient infrastructure and services.28 Furthermore, an
estimated 63% of Nigeria’s urban population lives in slums,61 where overcrowding,
inadequate sanitation, and poor refuse collection lead to outbreaks of infectious diseases such as tuberculosis, hepatitis, dengue, pneumonia, cholera, and diarrheal illnesses.45
Research suggests that up to 75% of the urban population growth in Sub-Saharan Africa is a result of fertility rates that have remained high while mortality rates have
decreased.3, 41, 49 In fact, in Nigeria, the overall urban fertility rate has only slowly decreased
from 5.1 to 4.7 children per woman since the late 1980s.44 Therefore, in order to improve the
health and wellbeing of those living there, two of the main objectives of Nigeria’s National Policy on Population (updated 2004) are to increase the contraceptive prevalence rate for modern methods by at least two percentage points every year and reduce the country’s overall fertility rate by at least 0.6 children every five years.28, 62
Despite these national-level efforts to promote modern FP use, contraceptive prevalence remains low in Nigeria.51 According to the latest Nigeria Demographic Health Survey (DHS) report (2008), approximately 10% of all currently married women in Nigeria are using a modern contraceptive method, a slight increase from 8% in 2003.44 And in urban areas of Nigeria, contraceptive prevalence has only increased from just under 15% in 2003 to 16.7% in 2008.25
Data
To address both dissertation aims, data are used from the 2010-2011 baseline survey of the Nigerian Urban Reproductive Health Initiative (NURHI) undertaken by the Measurement, Learning & Evaluation (MLE) Project.d Individual and service delivery point
(SDP) data are analyzed from the selected cities of Abuja, Benin City, Ibadan, Ilorin, Kaduna, and Zaria.65
Individual Data
The individual-level data were collected between October 2010 and April 2011 via a two-stage stratified sampling design. First, a random sample of urban enumeration areas (EA), or clusters, was drawn from the 2006 Nigeria Population and Housing census within the six study cities. The clusters were selected in each city based on probability proportional to their population size. The number of clusters selected per city was based on information from the 2008 Nigeria DHS regarding the number of women per household in urban areas at the state level. The number of clusters per city in the survey ranged from a low of 74 in Zaria to a high of 102 in Ibadan.28
Next, 41 households in each cluster were selected randomly to create an average sample of about 3,000 women in each city. All women, ages 15 to 49, living permanently in the selected households and visitors present on the night before the survey were then asked to participate in a detailed interview with a trained female interviewer following receipt of informed consent.28 The sample was taken from 20 LGAs and included 16,144 married and
unmarried women.
d The MLE project was funded by the Bill & Melinda Gates Foundation to conduct a rigorous impact evaluation of their Urban Reproductive Health Initiative (URHI). The URHI aims to promote innovative FP programs in urban areas of four countries: Uttar Pradesh; India; Nigeria; Kenya; and Senegal. The goal of the MLE is to identify the most effective and cost-efficient programmatic approaches to
SDP Data
Between February and June 2011 data on FP services and/or commodities were also collected from a sample of SDPs66. Four categories of SDPs were surveyed: 1) public
sector health facilities (HFs); 2) preferred private HFs; 3) private pharmacies; and 4) private patent medicine stores (PMSs).e Different selection strategies were used for each SDP type.
Public HFs, pharmacies and PMSs were identified through a compiled list of verified health outlets obtained from relevant Nigerian health agencies.f66 All public HFs were visited; to
control survey costs, about 100 pharmacies in the larger cities were randomly sampled, as were approximately 100 PMSs in all cities. Preferred private HFs were identified from the MLE individual survey; women were asked where they go for child health, maternal health, FP visits, and HIV testing. All mentioned facilities were included in the preferred facility sample.g Three different survey tools were used to collect SDP information: one for the
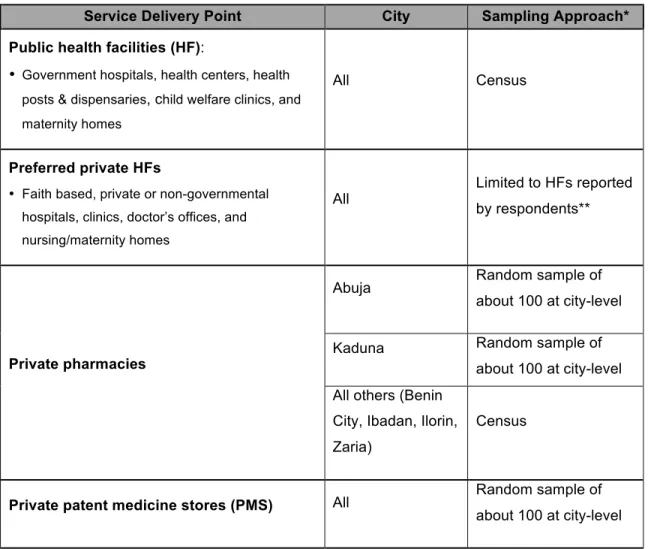
pharmacies, one for the PMSs, and a third for the public and preferred private HFs. Table 2.1 summarizes the sampling approaches.66
e PMSs, or chemists, are usually small in size and have a license to sell over-the-counter drugs that are considered safe to sell to the general public in prepackaged form. PMSs are the main source of medicines used by the public in many African countries.63
f The agencies included: the National Bureau of Statistics, Federal Ministry of Health (MoH), National Primary Health Care Development Agency, State MoH offices, Guild of Medical Directors, Association of General Private Medical Practitioners, Association of Private Nurse Practitioners, Association of Community Pharmacists, Association of Proprietary and Patent Medicine Dealers, and a list of registered pharmacies.63
Table 2.1: Sampling approach by city for each type of service delivery point
Service Delivery Point City Sampling Approach*
Public health facilities (HF):
• Government hospitals, health centers, health posts & dispensaries, child welfare clinics, and maternity homes
All Census
Preferred private HFs
• Faith based, private or non-governmental hospitals, clinics, doctor’s offices, and nursing/maternity homes
All
Limited to HFs reported by respondents**
Private pharmacies
Abuja Random sample of
about 100 at city-level
Kaduna Random sample of
about 100 at city-level All others (Benin
City, Ibadan, Ilorin, Zaria)
Census
Private patent medicine stores (PMS) All Random sample of
about 100 at city-level
*The survey design called for a sample of 100 PMSs and 100 pharmacies in each city. In the cities where there were more than 100 PMSs or pharmacies, a random sample of 100 was selected.
CHAPTER 3
Assessing Gaps and Poverty-Related Inequalities in the Public and Private
Sector Family Planning Supply Environments of Urban Nigeria
Brief Overview
In urban areas, both the public and private family planning (FP) sectors are important in ensuring equal access to FP services and availability of modern contraceptives.26, 46-48, 67, 68 However, to date, there is no fine-grained description of, or comparison between, Nigeria’s
urban private sector FP supply environment and its public FP supply environment. Furthermore, neither sector has been analyzed in relationship to the different
subpopulations of wealth status. As a result, it is unknown whether the two sectors are fully engaged so as to most effectively serve the urban poor.
This study, therefore, fills an important gap in what is known about Nigeria’s contraceptive supply environment. Using survey data from FP service outlets – from here forward referred to as service delivery points (SDPs)– it creates supply index scores (SISs) to measure the aggregate-level public and private sector FP supply environment within and across six purposively selected cities of Nigeria. Specifically, it assesses whether the public and/or private sector FP supply environments are consistent across urban local government areas (LGAs)h, and if not, how they differ. It also explores whether and how services from one sector correlate with and/or compliment services within the other sector. Since there exists no standard measure for quantifying the multidimensional nature of the FP supply
hNigeria is subdivided into states, which are further subdivided into LGAs. This study looks at the
environment, this study draws on the commodity security and logistics framework created by United States Agency for International Development (USAID) to define supply as product availability and access to services.69 It considers availability as the actual on
hand/procurable status of contraceptive commodities at any given SDP and access as the degree to which FP services may be obtained by a large majority of the population.
Finally, by linking aggregate LGA-level SDP data with data collected at the same time from individuals living within corresponding communities, this study explores whether the FP supply environment is correlated with community-level wealth status. A better understanding of these relationships will enable donors, policymakers and program implementers to make informed decisions about limited resource allocation and programming, thereby improving equality in FP access and availability and possibly decreasing overall urban fertility.
Study Sample Community Sample
The original individual level cluster sample was taken from 20 LGAs and included 16,144 married and unmarried women. Of the full sample, this study only analyzed information collected from women who were surveyed within the 19 LGAs from which the sample of SDP data, described below, were taken (N=16,101).
SDP Sample
SDP data were collected from 25 different LGAs within the six selected cities of Nigeria.28 This study analyzed data from 19 of these LGAs: five LGAs were dropped
SDPs. Eight of these SDPs were dropped because there was no indication of their SDP type and 114 were dropped because they either did not sell FP or the variable indicating whether they sold FP was missing. With the remaining 1,220 SDPs, the FP SIS for each SDP type within each LGA were created.
Measures
• Family Planning Supply Environment. Supply Index Score
SISs were created to reflect the LGA-level FP supply environment. Four continuous scores were assigned to each LGA: one for public sector FP health facilities (HFs), one for preferred private FP HFs, one for private FP pharmacies, and one for private FP Patent Medicine Stores (PMSs). The SISs were created by multiplying two LGA-level variables for each SDP type: 1) FP supply environment strength; and 2) FP supply environment size. These two variables were created as follows: (See Figure 3.1 and Table 3.1)
1. FP Supply Environment Strength:
This continuous variable was based on seven SDP measures that reflect strength of contraceptive access and availability, including: (1) method availability; (2) availability of injectablesi; (3) availability of the intra-uterine device (IUD)j (only among public HFs and
preferred private HFs, as PMSs and pharmacies do not sell the IUD); (4) stockouts of
normally available methods; (5) hours FP services are provided; (6) requirements for partner
i This measure is being used to reflect the availability of a marker method. According to
representative data collected by MLE in 2010, the most commonly used or ever-used modern
contraceptive methods among women in union, living in urban areas of Nigeria is the male condom or injectable.32
jIt is more difficult to obtain an IUD in Nigeria than other reversible modern methods, and yet, it is one
consent; and (7) availability of socially marketed products. (See Table 3.1 for summary of measures and Appendix A for a more detailed description of measure creation.)
Using these seven component measures, the variable was created in three steps for each SDP type. First, the values for each of the seven SDP measures were aggregated up to the LGA level. Second, the LGA-level percentage values for each measure were summed within each stratum of SDP type. The range of values for public and private HFs was 0 to 700; and the range for pharmacies and PMSs was 0 to 600. Third, in order to put the final variable on the same 0 to 100 scale for all SDP types, the sum for public and private HFs was divided by 7 and the sum for pharmacies and PMSs was divided by 6.
Case-wise deletion was used to create the seven aggregate-level supply measures. Therefore, due to missing data for some component measures, the range of the number of SDPs included in the final sample for this variable was 1,155 to 1,220. (See Appendix B) Note: only 376 public and preferred private HFs were included in the LGA-level measure for IUD availability. All PMSs and pharmacies were dropped from this measure, as they do not sell IUDs.
2. FP Supply Environment Size:
was not taken. The urban geographic area of each LGA – the density denominator – was defined as the number of SQKMs within a 5-kilometer buffer zone around the original LGA SDP sample frame. Geographic information system (GIS) shape files of the LGA boundaries and of the original SDP sample frame were used.70
Figure 3.1: Steps taken to create the supply index score for each type of family planning (FP) service delivery point (SDP) within each local government area (LGA)
Family Planning
Supply Index Score
=
Size
Divide # of FP SDPs in
the urban LGA by the #
of SQKM of that urban
LGA
*
STEP 2: Sum LGA-level values across measures
STEP 3: Rescale all
SDP type sums to be on the same
% scale STEP 1:
Aggregate SDP-level measures up to
LGA-level
Strength Supply
Table 3.1: Critical measures used to reflect the family planning (FP) supply environment at the local government area (LGA) level
Measure Definition (within each LGA)
Service Delivery Points (SDPS) measured at the
LGA-level
Strength
Method Availability
Mean % of possibly available modern FP methods that are actually provided across FP SDPs
• Public HFs • Preferred
Private HFs • Private
Pharmacies • Private Patent
Medicine Stores (PMS)
Availability of Injectables
% of FP SDPs that provide an injectable form of contraception
Availability of IUD*
% of private and public FP health facilities (HFs) that provide IUDs
Stockout day of interview
% of SDPs with no stockouts of any normally available FP method on day of interview
Hours FP services are provided
Mean % of potential total hours that FP services are actually offered each week across SDPs
Partner Consent
% of SDPs that do not require partner consent to use/access any available form of modern method of contraception
Socially marketed products
% of SDPs that provide socially marketed products
Size FP Service Density
# of FP SDPs per square kilometer of urban LGA
Supply Environment
FP Supply Index Score
Measure of the size and strength of the FP supply environment in each LGA
Community Level Measures:
Two measures of LGA-level poverty were derived using city-specific household wealth quintiles, where Q1 refers to the poorest 20% of the sample surveyed in each city:k
• Distribution of poorest women. This continuous variable measures the percentage of
Q1 that live within each LGA of the city.
• Proportion of LGA in lowest wealth quintile. This continuous variable measures the
percentage of the individual sample within each LGA that falls within Q1.
Analysis
The public and private sector supply environments were evaluated and compared at the LGA level within and across the six selected cities in Nigeria, as well as in relation to measures of community-level wealth status. Descriptive analysis, including calculations of Pearson correlation coefficients, paired t-tests and independent sample t-tests, were used to identify patterns and assess whether and where disparities exist.
kMLE calculated household wealth scores using principal component analysis, and assigned those
scores to the respective household members. They then ranked the individuals living in the same city from poorest to least poor and divided the resulting data into quintiles.
*
100 Number of Q1 in LGATotal number of surveyed women in the LGA
*
100 Number of Q1 in LGAFindings
Strength of LGA-level Public and Private Sector FP Supply Environment
Table 3.2 presents the scores for the strength of the FP supply environments at the aggregate LGA level for each FP SDP type. Paired t-tests were used to compare the mean standardized strength of services between SDP types across LGAs. Results suggest that there is no significant difference between the average strength of public and preferred private FP HFs across LGAs. However, significant differences were found in the average FP supply environment strength of public HFs and pharmacies (t=3.2, p=0.01); public HFs and PMSs (t=6.0, p=0.00); preferred private HFs and pharmacies (t=3.1, p=0.01); preferred private HFs and PMSs (t=8.7, p= 0.00); and pharmacies and PMSs (t=4.2, p=0.00). (See Table 3.2)
Additionally, Pearson correlation coefficient tests were computed to assess the relationships between the strength of the different SDP FP supply environments across LGAs. Tests showed no statistically significant correlations at the 0.05 level between the strength of the LGA-level public sector and any of the LGA-level private sector supply
Table 3.2: Summary statistics for the strength of the supply environment among different types of family planning service delivery points across local
government areas (LGA)
Strength of LGA Contraceptive Access/Availability Family Planning
Service Delivery Points
Mean (% of total possible points)
Standard Deviation
Minimum (% of total possible points)
Maximum (% of total possible points)
Public health facilities 64.0 10.38 44.9 81.1
Preferred private health
Facilities 62.1 7.88 48.2 82.9
Pharmacies 55.1 7.02 41.9 70.7
Patent Medicine Stores 44.5 6.72 30.0 56.1
Size of supply environment: FP Service Density
A strong contraceptive supply environment is based not only on the strength of its FP SDPs but also on the number and geographic distribution of FP SDPs that exist. Therefore, in addition to LGA-level strength of contraceptive access and availability, this study also considered the size of the environment in terms of LGA FP service density.
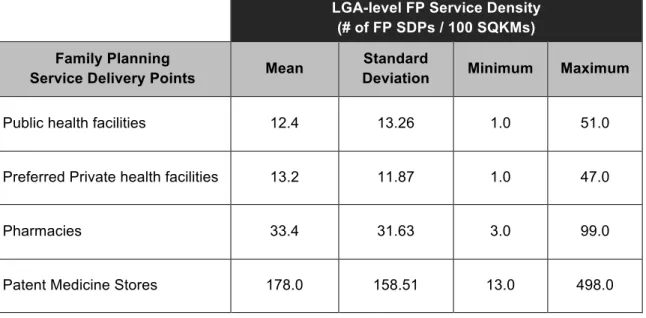
More variation was found in the density of FP SDP types within and across LGAs than in the strength of the different SDP supply environments. Specifically, the density of PMSs that carry contraceptives varied dramatically across LGAs, with the minimum number of FP PMSs per 100 SQKMs being 13 and the maximum being 498. (Table 3.3)
The variation in the geographic density of SDPs may be related to the size of the LGA population. A larger population might result in higher demand for services and, therefore, higher service density. However, within the urban LGAs of Nigeria – for which population estimates were available71 – there were no significant correlations at the 0.05
level between the density of any FP SDP type and the size of the urban LGA population. (See Figure 3.2 and Table 3.4)
The density of FP services within an LGA may also vary in conjunction with the strength of services within that LGA. Yet, there were no significant correlations at the 0.05 level between urban LGA-level strength and density of FP services, regardless of the SDP type.
densities of preferred private HFs and public HFs, preferred private HFs and pharmacies, or PMSs and pharmacies.l
Table 3.3: Summary statistics of the family planning (FP) service density among different types of FP service delivery points (SDPs) across local government areas (LGAs)
LGA-level FP Service Density (# of FP SDPs / 100 SQKMs)
Family Planning
Service Delivery Points Mean
Standard
Deviation Minimum Maximum
Public health facilities 12.4 13.26 1.0 51.0
Preferred Private health facilities 13.2 11.87 1.0 47.0
Pharmacies 33.4 31.63 3.0 99.0
Patent Medicine Stores 178.0 158.51 13.0 498.0
Figure 3.2: Family planning (FP) service density by size of urban local government area (LGA) population in each LGA*
Public health facilities
Preferred private
health facilities Pharmacies
Patent Medicine Stores
City LGA Population ** Urban Area (SQKM) # sell FP Density (#/ SQKM) # sell FP Density (#/ SQKM) # sell FP Density (#/ SQKM) Proxy* # sell FP Density (#/ SQKM)
Zaria Sabon Gari 291,358 243.22 15 0.06 11 0.05 8 0.03 50 0.21 Zaria 406,990 272.39 13 0.05 4 0.01 11 0.04 52 0.19 Kaduna
Chikun 512.66 6 0.01 9 0.02 31 0.06 262 0.51
Kaduna N 364,575 86.15 7 0.08 21 0.24 63 0.73 103 1.20 Kaduna S 402,731 59.87 13 0.22 28 0.47 25 0.42 298 4.98 Abuja AMAC 918.28 13 0.01 24 0.03 200 0.22 117 0.13
Bwari 385.49 5 0.01 2 0.01 30 0.08 72 0.19
Ilorin
Ilorin E 106.53 4 0.04 8 0.08 22 0.21 16 0.15
Ilorin S 36.64 5 0.14 10 0.27 8 0.22 120 3.28
Ilorin W 365,221 97.30 10 0.10 15 0.15 14 0.14 256 2.63 Offa 88,975 84.77 3 0.04 3 0.04 3 0.04 107 1.26
Ibadan
Ibadan N 308,119 26.33 8 0.30 3 0.11 26 0.99 45 1.71 Ibadan NE 331,444 17.64 9 0.51 4 0.23 14 0.79 87 4.93 Ibadan NW 154,029 28.56 4 0.14 5 0.18 10 0.35 41 1.44 IbadanSE 266,457 23.40 7 0.30 2 0.09 7 0.30 74 3.16 Ibadan SW 283,098 40.03 9 0.22 4 0.10 35 0.87 53 1.32 Benin
City
Egor 340,287 89.92 2 0.02 9 0.10 15 0.17 123 1.37 Ikpoba-Okha 194.13 5 0.03 12 0.06 6 0.03 251 1.29
Oredo 91.44 7 0.08 24 0.26 60 0.66 353 3.86
*The number of FP service delivery points (SDPs) is based on SDP census data in the original SDP sample frame. The number of FP PMSs was estimated by multiplying the ratio of surveyed PMSs that sell FP by the total # of PMSs in the original SDP sample frame for each city. The same method was used to estimate the number of pharmacies that sell FP in Abuja and Kaduna.
**Source: http://www.citypopulation.de/php/nigeria-admin.php71Population census data are only available at the full LGA-level; urban areas are not delineated from non-urban areas. Therefore, for the purposes of this study, population estimates were only included for LGAs that are almost entirely urban. An LGA was considered to be almost entirely urban if the entire SQKM area of the LGA minus the SQKM area from which the SDP sample frame was taken within that LGA was less than 30 SQKM.
Table 3.4: Family planning (FP) service density by urban area (SQKM) and size of urban population within each local government area (LGA)
Overall Supply Index Scores
Table 3.5 presents the overall SISs for each SDP type within each LGA. Because
there was only moderate variation in the LGA-level strength measures for the different SDP
types, the SISs were predominantly driven by the number of FP SDPs per SQKM in each
LGA. Pearson correlation coefficient tests showed that the density of each SDP type was
strongly correlated at the 0.01 level with the SIS of their respective SDP type.
That said, including the strength of the service environment in the overall SIS
resulted in significant correlations between all FP SDP type supply environments. The
LGA-level SISs for public FP HFs were significantly and positively correlated with preferred
private FP HFs (r=0.46, p=0.05), FP pharmacies (r=0.61, p=0.01), and FP PMSs (r=0.72,
p=0.00). Additionally, the LGA-level SISs for each private sector FP SDP type were
positively correlated with one another: preferred private HFs were correlated with
pharmacies (r=0.57, p=0.01); preferred private HFs were correlated with PMSs (r=0.82,
p=0.00); and pharmacies were correlated with PMSs (r=0.46, p=0.05). The graphs in Figure
3.3 demonstrate that the distribution of scores among each SDP type is skewed to the low
end of the respective SDP SIS range. In fact, there seems to be a cluster of nine LGAs with
scores for all SDP types that fall below the corresponding SDP type median: Chikun, AMAC,
Bwari, Ikpoba-Okha, Egor, Zaria, Offa, Sabon Gari, Ilorin East. Wider dispersion exists
Table 3.5: Family planning supply environment strength, size and supply index score (SIS) for each type of FP service delivery point within each local government area (LGA)
Public health facilities Preferred private health
facilities Pharmacies Patent Medicine Stores City LGA Name Strength Size SIS Strength Size SIS Strength Size SIS Strength Size SIS
Zaria Sabon Gari 45.00 0.06 2.70 59.39 0.05 2.97 65.20 0.03 1.96 43.18 0.21 9.07 Zaria 44.91 0.05 2.25 60.98 0.01 0.61 49.99 0.04 2.00 48.53 0.19 9.22
Kaduna
Chikun 56.60 0.01 0.57 62.22 0.02 1.24 58.69 0.06 3.52 50.47 0.51 25.74 Kaduna N 64.27 0.08 5.14 68.78 0.24 16.51 54.22 0.73 39.58 56.06 1.20 67.27 Kaduna S 56.06 0.22 12.33 58.64 0.47 27.56 58.94 0.42 24.75 48.99 4.98 243.95
Abuja
AMAC 67.53 0.01 0.68 67.95 0.03 2.04 52.07 0.22 11.46 43.12 0.13 5.61 Bwari 76.16 0.01 0.76 65.00 0.01 0.65 53.62 0.08 4.29 45.73 0.19 8.69
Ilorin
Ilorin E 81.12 0.04 3.24 59.12 0.08 4.73 61.03 0.21 12.82 29.96 0.15 4.49 Ilorin S 76.90 0.14 10.77 57.35 0.27 15.48 70.71 0.22 15.56 37.57 3.28 123.22 Ilorin W 68.51 0.10 6.85 63.25 0.15 9.49 61.76 0.14 8.65 43.98 2.63 115.66 Offa 60.75 0.04 2.43 62.93 0.04 2.52 54.23 0.04 2.17 32.07 1.26 40.40
Ibadan
Ibadan N 61.74 0.30 18.52 71.43 0.11 7.86 55.29 0.99 54.74 47.79 1.71 81.73 Ibadan NE 65.86 0.51 33.59 67.91 0.23 15.62 46.05 0.79 36.38 44.50 4.93 219.40 Ibadan NW 59.55 0.14 8.34 49.50 0.18 8.91 50.03 0.35 17.51 47.04 1.44 67.74 IbadanSE 64.26 0.30 19.28 48.20 0.09 4.34 41.94 0.30 12.58 51.18 3.16 161.73 Ibadan SW 69.61 0.22 15.31 82.91 0.10 8.29 56.31 0.87 48.99 53.21 1.32 70.24
Benin City
Egor 81.09 0.02 1.62 56.72 0.10 5.67 47.37 0.17 8.05 39.21 1.37 53.72 Ikpoba-Okha 54.57 0.03 1.64 55.58 0.06 3.33 49.87 0.03 1.50 40.56 1.29 52.33 Oredo 62.04 0.08 4.96 62.59 0.26 16.27 60.27 0.66 39.78 41.92 3.86 161.82
Public and Private Supply Environment: Regional Differences
Broad historical, political and religious differences exist between the north and south
of Nigeria, warranting a comparison of the FP supply environments between the two
regions. Therefore, independent-samples t-tests were conducted to compare the SISs of the different FP SDP types in the LGAs located in the north (in the cities of Abuja, Ilorin, Kaduna and Zaria) versus those in the south (in the cities of Ibadan and Benin City). Results suggest that the public sector HF supply environment is significantly better in the south (M=12.9, SD=11.0) as compared to the north (M=4.3, SD=4.1); t(2.4)=17, p=0.03. In fact, even without considering the outlier, Ibadan NE, the average SIS for LGAs in the south is almost 2.5 times higher than the average LGA score in the north. Furthermore, the public sector HF environment appears to be strongest in Ibadan, with four LGA-level SISs that are at least five times greater than almost half (47%) of all of the urban LGAs included in this study. (See Figure 3.4)
Supply Environment and Poverty
Addressing poverty-related inequalities in FP behavior and fertility outcomes may require targeted interventions that improve contraceptive access and availability for the urban poor. In order to assess what, if anything, needs to be done, it is important to not only identify possible gaps and inequalities in the supply environment but also to define the target population and identify where they live.39 If wealth was evenly distributed across each city,
we would expect that, by definition, approximately 20% of the sample in each LGA would fall within Q1.a Instead, as seen in Figure 3.5, it seems that some LGAs are slightly better off
than others; the observed percentage of Q1 in each LGA sample varies across LGAs by a standard deviation of 6.50 from the mean, 19.4%, (min=10.0%, max=41.4%)
LGAs that are disproportionately poor are not necessarily the same LGAs where most of the urban poor live. Concentration of poverty is a function of both the distribution of the poor, as well as the distribution of the total population across LGAs. Where Figure 3.5 shows the proportion of each LGA that is in Q1, Figure 3.6 demonstrates where most of each city’s Q1 can be found.
Despite the disparities in wealth distribution and SISs across LGAs, Pearson correlation coefficient tests showed no significant correlation between the SIS of any SDP type and the percentage of each LGA that are in Q1. Furthermore, there is no clear pattern between the SISs and the distribution of Q1 across each city. For example, the
concentration of Q1 in Oredo is not appreciably different from that in Ikpoba-Okha; however the two LGAs have markedly different SISs across SDP types. Also, Oreda in Benin City, is the only LGA that contains both the highest percentage of Q1, as well as the highest LGA-level SIS for each SDP type. (See Table 3.6)
Table 3.6: Distribution of city’s poorest women across local government areas (LGA) compared to public and private family planning supply index score (SIS)*
City LGA
Urban LGA population**
% of city's poorest women in each LGA
Public health facility SIS
Preferred private HF SIS
Pharm-acy SIS
PMS SIS
Zaria Sabon Gari 291,358 61.69 2.7 3.0 2.0 9.1
Zaria 406,990 38.31 2.3 0.6 2.0 9.2
Kaduna
Chikun 30.26 0.6 1.2 3.5 25.7
Kaduna N 364,575 39.44 5.1 16.5 39.6 67.3
Kaduna S 402,731 30.30 12.3 27.6 24.8 244.0
Abuja AMAC 72.14 0.7 2.0 11.5 5.6
Bwari 27.86 0.8 0.7 4.3 8.7
Ilorin
Ilorin E 11.98 3.2 4.7 12.8 4.5
Ilorin S 14.05 10.8 15.5 15.6 123.2
Ilorin W 365,221 35.27 6.9 9.5 8.7 115.7
Offa 88,975 38.70 2.4 2.5 2.2 40.4
Ibadan
Ibadan N 308,119 19.65 18.5 7.9 54.7 81.7
Ibadan NE 331,444 27.13 33.6 15.6 36.4 219.4
Ibadan NW 154,029 5.94 8.3 8.9 17.5 67.7
IbadanSE 266,457 25.91 19.3 4.3 12.6 161.7
Ibadan SW 283,098 21.37 15.3 8.3 49.0 70.2
Benin City
Egor 340,287 25.66 1.6 5.7 8.1 53.7
Ikpoba-Okha 36.94 1.6 3.3 1.5 52.3
Oredo 37.40 5.0 16.3 39.8 161.8
*Cells are highlighted to show the LGAs that contain the highest % of each city’s poorest women, as well as the LGAs that have the highest SIS for each service deliver typey (SDP) type within each city.
Discussion
Over 50% of the world’s population lives in an urban area. Due in large part to high levels of fertility in urban areas of the developing world, that number is projected to increase to two thirds by 2050.50 Over time, there will be more people seeking employment, housing
and other limited resources in urban areas, further exacerbating already depleted living conditions and overall poor health.36, 72 As a result, governments and donor organizations
have become increasingly vigilant of poverty-related inequalities in urban fertility, as well as in urban contraceptive use behaviors and service utilization.28, 36, 72 At the same time,
inequalities in the urban FP supply environment have become an area of interest for FP program and policy makers.46, 73, 74
As the most populous country in Africa, with an urban growth rate that indicates continued rapid population growth and urbanization, Nigeria is an opportune setting in which to explore inequalities in the urban FP supply environment. This study aimed to identify how the public and private sector FP supply environments vary and interact within and across urban LGAs. It also explored whether Nigeria’s urban FP supply environment is correlated with community-level wealth, so as to mitigate obstacles related to contraceptive access and availability among the urban poor.
Access to FP is contingent on the consistent and convenient availability of
contraceptive methods. Therefore, two important components of contraceptive access and availability were used to define the aggregate-level FP supply environment: the overall strength of supply among the SDPs within each LGA; and the density of SDPs that provide FP within each LGA.
important marker methods such as injectables and IUDs; experience commodity stockouts; are not open for the maximum number of hours per week; do not offer socially marketed products; and/or require partner consent in order to obtain at least one available method (not including forms of sterilization). Using paired t-tests to compare the means of these component measures, it seems that, among public and preferred private sector FP HFs, the measures that increased the LGA strength scores were the number of hours that the SDPs were open, the percentage that sold IUDs, and the percentage that sold injectables. On the other hand, the overall strength scores for public and private HFs were brought down mostly due to the fact there was a large percentage of them in each LGA that required partner consent for reversible modern contraceptive methods. On average, 60.4% of public and 76.1% of preferred private FP HFs in each LGA required partner consent for at least one available method. Among pharmacies and PMSs, the component scores are highly correlated. However, 71.9% of pharmacies offered the injectable form of modern
contraception, which brought its overall mean strength score up; and only 17.5% of PMSs offered the injectable, which pulled its overall mean strength score down.
Though one might have expected their scores to be even higher than was observed, it comes as little surprise that public and preferred private FP HFs received significantly higher standardized LGA-level strength scores than the pharmacies and PMSs. Public HFs more often follow government standards of service provision and are more easily monitored and regulated. Also, the private HFs used in this analysis were identified as preferred
providers, which in and of itself might introduce positive bias to the results. Furthermore, pharmacies and PMSs are significantly less likely to provide socially marketed products or injectables than public and private HFs, and they are not open for as many hours.
points for contraceptive commodity provision; as such, they are a good starting point for improving the FP supply environment in urban Nigeria.25, 28, 44
When comparing the calculated SISs for each SDP type, data showed wide variability in the public and private sectors across urban LGAs. Where there was a good public FP supply environment, there was increased likelihood that there was also a good private sector FP supply environment. This outcome could reflect greater demand for all health services and, thus, more providers within those LGAs. However, according to the analysis, the density of providers was not significantly correlated to urban LGA population size. Another interpretation of this outcome is that neither sector is working to fill service gaps where the other sector is lacking.60 Modern contraception may be more accessible if
the government increased public FP HFs in areas that lack private SDPs.
Limitations
This study gives insight into Nigeria’s urban FP supply environment, highlighting possible gaps in public and private sector contraceptive access and availability; however, there are certain limitations to the study. Inherent to any secondary data analysis, the data used in this study lacked certain information needed to better fit its aims. For example, to reflect the strength of the supply environment, it might have been beneficial to also include measures such as distance between individuals/clusters and service outlets75 and location
of SDPs in relation to highly traveled areas, such as markets, public transportation, etc.31
Also, measures to reflect cost of contraceptives and medical barriers, including FP
restrictions based on age and parity, were collected by MLE, however, not in a manner that fit the methodology of this study. Therefore, though they are important indicators of access and availability, they were not used in analysis.
Additionally, the definition of “urban geographic area” varies widely from country to country. In this study, the unit of analysis was the urban portion of each LGA that falls within six selected Nigerian cities. However, though LGA boundaries have been defined, there are no official boundaries to geographically delineate their urban portions; and in some cases, the LGAs might be considered largely rural. Therefore, despite the use of GIS tools to make careful approximations of the urban areas within each LGA, calculations of service density may be over or under estimated.
purposes of this study, it would have been beneficial to have a census or random sample of all private HFs, in order to assess and generalize the findings to the overarching private sector HF universe. Therefore, the degree to which this limitation is a problem for this study depends on the extent to which preferred private HFs represent the actual private HF frame. This information, however, is unknown.
Finally, one aim of this study was to obtain a better understanding of intracity distribution of public and private sector contraceptive access and availability. For that reason, data were analyzed at the LGA level instead of at the city level. However, the small number of urban LGAs included in the analysis limited the findings. To improve the
statistical power of the results, future research would benefit from including more urban LGAs within Nigeria, which would require collecting data from more Nigerian cities.
Concluding Remarks and Recommendations
An outstanding question that is beyond the scope of this study is whether the geographic distribution of family planning services affects individual contraceptive use in urban areas. Unlike in most rural areas, services in urban areas are denser and travel between communities is easier. While rural populations tend to frequent SDPs based on proximity to residence and affordability, urban populations are exposed to a greater choice and number of SDPs and, therefore, demonstrate more complex patterns for accessing health care.28 Hence, further research should be conducted to analyze the relationship
between a woman’s immediate supply environment and demand-side factors, such as her use of contraception.