Design of Early Warning System Based on
Wireless Sensor Network
https://doi.org/10.3991/ijoe.v14i01.8060
Bo Gan!!", Shan Jin
Shandong Laber Vocational and Technical College, Jinan, China
Abstract—In order to solve the shortcomings of the landslide monitoring technology method, a set of landslides monitoring and early warning system is designed. It can achieve real-time sensor data acquisition, remote transmission and query display. In addition, aiming at the harsh environment of landslide monitoring and the performance requirements of the monitoring system, an im-proved minimum hop routing protocol is proposed. It can reduce network ener-gy consumption, enhance network robustness, and improve node layout and networking flexibility. In order to realize the remote transmission of data, GPRS wireless communication is used to transmit monitoring data. Combined with remote monitoring center, real-time data display, query, preservation and landslide warning and prediction are realized. The results show that the sensor data acquisition system is accurate, the system is stable, and the node network is flexible. Therefore, the monitoring system has a good use value.
Keywords—landslides, wireless sensor networks, minimum hop routing proto-col, GPRS
1
Introduction
dis-placement and the direction of disdis-placement. Many of the existing monitoring meth-ods are wired. The deployment of the system is not flexible, which is susceptible to the impact of the monitoring site geographical environment. Landslide monitoring systems for wireless sensor networks are used. However, it uses a single type of sen-sor, which cannot effectively collect the environmental data of the landslide monitor-ing area [5]. In addition, the remote data transmission is based on GSM short message mode, which seriously affects the efficiency and real-time performance of data trans-mission, thus affecting the overall performance of system monitoring [6].
In order to solve the problem of landslide monitoring method, real-time monitoring and warning system of landslide based on wireless sensor network is studied. Low-power acceleration sensors, temperature sensors and humidity sensors are used to measure the mountain's environmental information, which reduces the overall power consumption of the system. Cheap wireless sensor nodes are used to reduce the cost of monitoring the system. The flexibility of monitoring system deployment is en-hanced. A wide range of layout and large-scale promotion of monitoring system is achieved. Remote monitoring center is connected by GPRS to realize remote real-time transmission of monitoring data. The transmission distance of monitoring data is expanded. Monitoring data analysis, processing, query and display, as well as early warning and prediction of landslides are realized.
2
State of the art
The application of wireless sensor network in landslide monitoring has become the focus of research and development in various countries [7]. Some research institutes and companies have done a lot of work in this area and have made great achievements in scientific research and products. For example, the Indian Institute of Technology designed wireless sensor distributed monitoring system for landslide monitoring [8]. The system design includes two parts. The first part is the system's fault tolerance, energy efficiency and routing protocols. The second part is the method of distributed decision-making when landslides occurred. In order to test the monitoring effect of the system, the designer simulates the pressure changes of rock samples and monitors them, so as to verify the monitoring ability of the system. The energy consumption, routing efficiency and decision effect are obtained. However, the monitoring infor-mation collected by the system is less and is not verified in practice. Its reliability in harsh monitoring environment needs to be further tested. The accuracy of monitoring and prediction of landslides is still to be proved.
then the integral is used to get the displacement. Due to the large error in the accelera-tion processing, it cannot meet the monitoring accuracy of the displacement monitor-ing in landslide monitormonitor-ing, and affects the monitormonitor-ing effect of the system.
Johns Hopkins University proposed a three-step forecast algorithm of landslide monitoring based on wireless sensor networks. First, the sensor nodes monitor the surface displacement of the mountain area to distinguish the sliding area from the rest area. Second, the sensor nodes in the sliding area locate the nodes and calculate the node displacements through the trilateration mechanism. Third, the location of the sliding surface is calculated according to the direction and position of the node dis-placement. Combined with the soil information (the pore pressure of the soil), the finite element model is used to predict whether the landslide and the landslide time. Simulation results show that the algorithm is very effective and achieves centimeter accuracy. However, in the actual landslide monitoring environment, the external inter-ference is large, and the positioning accuracy is hard to be guaranteed. Therefore, the algorithm is difficult to accurately obtain landslide displacement. Its reliability and system stability need to be further proved.
The Coimbatore University in India, in cooperation with the European Commis-sion and the Indian Space Research Organization, has developed a wireless sensor network monitoring system for landslide monitoring. The system is part of the WINSOC (wireless sensor network with self-organization capabilities for critical and emergency applications) research project [10]. Through the installation of sensor nodes to 15 meters below the surface, a variety of soil parameters were collected, such as soil moisture, vibration and displacement. Monitoring data is transmitted to Coimbatore University campus via a wireless base station. Through the background processing, warning and forecast of landslides are realized. The system places the sensor node 15 meters below the surface. It affects the reliability of wireless commu-nication between nodes. In addition, in order to implement data commucommu-nication be-tween underground nodes and surface nodes, the node's RF transmission power is set to be larger, which reduces the life cycle of nodes and affects the overall system per-formance.
3
Remote monitoring center software design and system testing
3.1 The architecture of remote monitoring center
The environment information of landslide monitoring area is collected by wireless sensor network. Combined with GPRS network, remote transmission of monitoring area data is realized [11]. The sensor nodes in the monitoring area have a large num-ber of nodes and the collected environment information is relatively complicated. The effective management of the data can effectively monitor the landslide area. The re-mote monitoring center first receives the sensor network data packet, and extracts the valid data and stores it in the database. At the same time, the extracted valid data is analyzed and processed. The node's sensor data curve is plotted. The topology of the network is displayed. The data query and the image display are realized. Sensor alarm threshold is set, and alarm function is implemented.
Based on the above functional analysis of the remote monitoring center and the characteristics of C #, Visual C # is used for remote monitoring center software de-sign. Software design includes data communication module, data storage and query module, graphical display and alarm module and topology query module. Diagram of remote monitoring center is shown in Figure 1.
Data collection
Data query
Data storage
Data analysis and processing
User login
Display sensor data curve
Data storage
Data analysis and processing
Fig. 1. Diagram of remote monitoring center
3.2 Data communication module
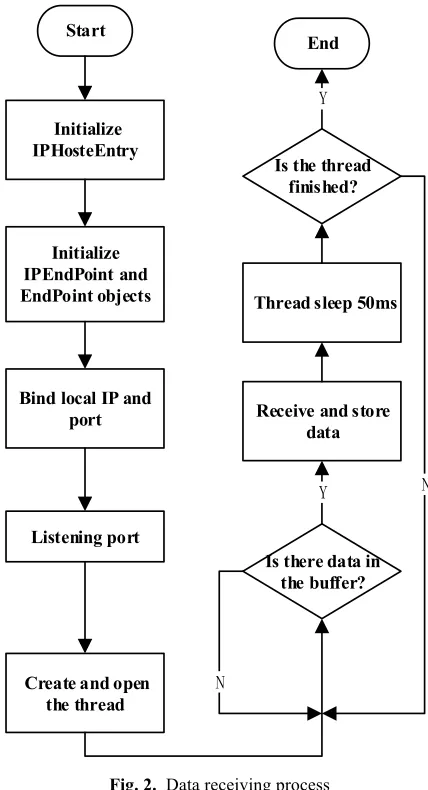
The main steps of Socket control to realize network data receiving are as follows: First, a Socket instances are established. Second, the IP and port of this instance to the machine is bound. Third, the local network port is monitored. Fourth, when the con-nection request is monitored, the data is received. The GPRS module uses the connec-tion oriented TCP service to transmit data to the remote monitoring center. Therefore, when the Socket instance is bound to the IP and port of the machine, it is necessary to monitor whether data is transferred to the port. Data transmission is interrupted. In order to achieve the normal data reception, it is necessary to use the thread to judge whether there is data in the received data buffer. When there is data, the correspond-ing data is read immediately, so as to achieve data reception. Data receivcorrespond-ing process is shown in Figure 2.
Start
Initialize IPHosteEntry
Initialize IPEndPoint and EndPoint objects
Bind local IP and port
Listening port
Create and open the thread
Is there data in the buffer? Receive and store
data Thread sleep 50ms
Is the thread finished?
End
3.3 Topology query module
In order to check the network topology of the sensor network, the network topolo-gy must be graphically displayed. When drawing a node topolotopolo-gy, drawing classes such as Graphics, Pen, Rectangle, and Point are mostly used. The Graphics class pro-vides methods for drawing objects to a display device. Pen class draws the specified width and style of the line. Rectangle class draws a rectangle of the specified width and length. The Point class determines the drawing coordinate position in a blank area of the window. The process of establishing the network topology is as follows: First, the remote monitoring center receives the data frame, analyzes and extracts the rout-ing information contained in the node, and saves and keeps with the topology table in the new database. Second, to determine whether the topology table is modified. When modified, the topology table is analyzed. Third, the network nodes of the topology structure in the display window coordinates are calculated. According to the topology table in the database, the parent-child relationship between nodes is determined. Combined with the coordinates of the node location and the drawing control in the .NET environment, a graphical display of the topology is implemented. In the mean-time, in the left part of the display window, the ID numbers of the sink node, the rout-ing node, and the terminal node are respectively displayed. Monitorrout-ing and alarm interface is shown in Figure 3.
2 3 4 5 6 7
10 20 30 40 50 60 70 80 90 100
Ac
ce
ler
at
io
n(m
/s)
2
Time(s)
X axis Y axis Z axis
4
System test
4.1 Test program
In the indoor environment, wireless sensor monitoring network is built. The fol-lowing tests are mainly conducted: node wireless communication and networking test; sensor data acquisition and transmission test; node communication distance and pow-er consumption test. The test program uses a sink node, two tpow-erminal nodes and two routing nodes. The sink node ID is 0x01. The ID numbers of the two terminal nodes are 0x11, 0x12 and 0x13, respectively. The ID numbers of the two routing nodes are 0x21 and 0x22, respectively.
Node wireless communication and networking test: Sensor network nodes are used in landslide monitoring. The effective communication distance between nodes is very important for the networking of nodes and the transmission of network data. There-fore, firstly, the effective communication distance of the node is tested, and then the node's networking function is tested. In order to reduce the impact of the external environment on the wireless communication performance of the node, when the weather is sunny, the effective communication distance of nodes is tested in the school playground which is relatively open. When testing, a rod antenna is used. Re-ceiver sensitivity is -94d Bm. Transmit power is set to 0d Bm (1mw). Data packet loss rate should be less than 2%. In order to test the networking function of the sensor network node, the sensor network node is arranged on the playground. During the test, the terminal node and the routing node send query packet frames and data frames. When starting the test, the terminal node and the routing node are opened first, then the sink node is opened, and the network is established. The network build-ing function of the node is tested. In order to test the network access and off-grid function of the node, after the networking is completed, an end node with a node ID of 0x11 is added to the network. Through the program settings, after the node 0x11 enters the network successfully for a period of time, it actively sends off-line requests to leave the network to test the network access and off-grid functions of the nodes.
Sensor data acquisition and transmission test: Terminal nodes are placed in the in-door environment. Inin-door temperature and humidity are collected. Due to the limita-tions of the experimental condilimita-tions, in order to collect acceleration values, the sensor nodes with acceleration sensors were placed on the inclined plane of the building. Vibration signal of slope is continuously collected. During the test, the terminal node 1s collects and sends data once (it can be set by software). Through the established node routing and GPRS network, the sensor data is transmitted to the remote monitor-ing center. The remote monitormonitor-ing center classifies the received data accordmonitor-ing to the type of data and separately stores different tables of acceleration, temperature and humidity values to the database. Through the data query window and graphical dis-play and alarm window, the sensor data are queried separately.
con-sumption of each node is calculated by measuring the output current of the DC stabi-lized power supply.
4.2 Test results
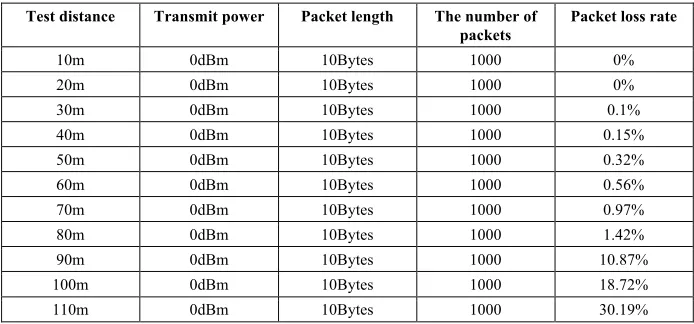
The test environment is the school playground. The experimental data of point ef-fective transmission distance is shown in Table 1.
Table 1. The experimental data of point effective transmission distance Test distance Transmit power Packet length The number of
packets Packet loss rate
10m 0dBm 10Bytes 1000 0%
20m 0dBm 10Bytes 1000 0%
30m 0dBm 10Bytes 1000 0.1%
40m 0dBm 10Bytes 1000 0.15%
50m 0dBm 10Bytes 1000 0.32%
60m 0dBm 10Bytes 1000 0.56%
70m 0dBm 10Bytes 1000 0.97%
80m 0dBm 10Bytes 1000 1.42%
90m 0dBm 10Bytes 1000 10.87%
100m 0dBm 10Bytes 1000 18.72%
110m 0dBm 10Bytes 1000 30.19%
It can be seen from Table 1 that within 80m, the packet loss rate of data transmis-sion is very small, which hardly affects the normal data transmistransmis-sion. When the dis-tance is more than 80m, the data packet loss rate increases sharply. Data packet loss is very serious, which seriously affects the reliable transmission of data. The actual length of the network frame data is generally not more than 10 Bytes. Therefore, when testing, the packet length is set to 10 Bytes.
The test results of node networking are shown in Figure 4. The test results of node access network are shown in Figure 5.
As can be seen from Figure 4, the sink node of the monitoring network is 0x01. 0x22 and 0x21 are used as routing nodes and data forwarding is achieved. 0x13, 0x12 are used as terminal nodes to collect sensor values, and then sent to the next hop rout-ing node. Finally, the data transmission and convergence are achieved. As can be seen from Figure 5, node 0x11 joins the established network as the terminal node.
Fig. 4. The test results of node networking
Fig. 5. The test results of node access network
0 5 10 15 20 25 30 35 40 45
-0.20 -0.15 -0.10 -0.05 0.00 0.05 0.10 0.15 0.20 0.25
A
cceleratio
n valu
e
(m
/ s)
2
Time(S)
Z axis Y axis X axis
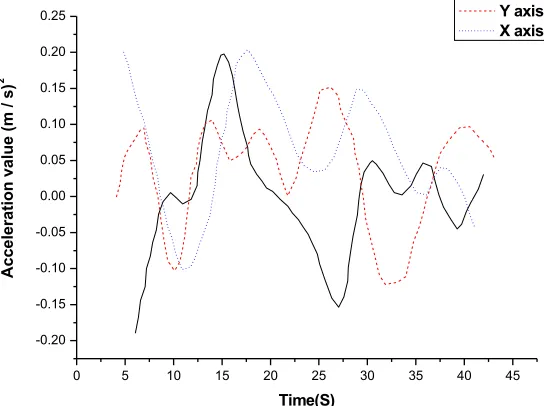
As can be seen in Figure 6, the curve is the acceleration value curve for node 0x12 (decimal 10). The alarm thresholds are set as follows. The humidity threshold is 60%, the temperature threshold is 15 °C, and the acceleration threshold is 0.5 m / s2. Be-cause the room temperature is above 15 °C, the alarm node list shows the node IDs that exceed the threshold and the type of sensor values. Two terminal nodes for test-ing are integrated with temperature and humidity sensors. Therefore, the alarm node list shows the ID of two terminal nodes. The sensor data query results are shown in Table 2.
Test results of node distance and power consumption: When the sink node runs normally, the current consumption is 47mA. When the routing node works normally, the current is 40mA. When the terminal node works normally, the current is 43mA.
Table 2. The sensor data query results
Time ID Temperature value Humidity value X-axis acceleration value
2016-10-21 0x13 17.5 73 0.1
2016-10-22 0x12 17.4 74 0.15
2016-10-23 0x13 17.6 74 -0.1
2016-10-24 0x12 17.5 75 0.1
2016-10-25 0x13 17.2 72 0.2
2016-10-26 0x12 17.6 75 -0.15
2016-10-27 0x13 17.5 74 -0.1
5
Conclusions
6
References
[1] Bhardwaj, G. S., Metha, M., Ahmed, M. Y., & Chowdhury, M. A. I. (2014). Landslide monitoring by using sensor and wireless technique: a review. International Journal of Ge-omatics and Geosciences, 5(1), 1.
[2] Giorgetti, A., Lucchi, M., Tavelli, E., Barla, M., Gigli, G., Casagli, N., ... & Dardari, D. (2016). A robust wireless sensor network for landslide risk analysis: system design, de-ployment, and field testing. IEEE Sensors Journal, 16(16), 6374-6386. https://doi.org/10.1109/JSEN.2016.2579263
[3] Hodge, V. J., O'Keefe, S., Weeks, M., & Moulds, A. (2015). Wireless sensor networks for condition monitoring in the railway industry: A survey. IEEE Transactions on Intelligent Transportation Systems, 16(3), 1088-1106. https://doi.org/10.1109/TITS.2014.2366512 [4] Ju, N. P., Huang, J., Huang, R. Q., He, C. Y., & Li, Y. R. (2015). A Real-time monitoring
and early warning system for landslides in Southwest China. Journal of mountain science, 12(5), 1219-1228. https://doi.org/10.1007/s11629-014-3307-7
[5] Lee, H. C., Ke, K. H., Fang, Y. M., Lee, B. J., & Chan, T. C. (2017). Open-Source Wire-less Sensor System for Long-Term Monitoring of Slope Movement. IEEE Transactions on Instrumentation and Measurement, 66(4), 767-776. https://doi.org/10.1109/TIM.2017.26 57838
[6] Lu, P., Wu, H., Qiao, G., Li, W., Scaioni, M., Feng, T., ... & Tong, X. (2015). Model test study on monitoring dynamic process of slope failure through spatial sensor network. En-vironmental Earth Sciences, 74(4), 3315-3332. https://doi.org/10.1007/s12665-015-4369-8 [7] Pu, F., Wang, Z., Du, C., Zhang, W., & Chen, N. (2016). Semantic integration of wireless
sensor networks into open geospatial consortium sensor observation service to access and share environmental monitoring systems. IET Software, 10(2), 45-53. https://doi.org/10.1049/iet-sen.2014.0141
[8] Rath, S., Sahoo, B. P. S., Pandey, S. K., & Sandha, D. P. (2013). Multi-Parameter Decision Support with Data Transmission over GSM/GPRS Network: a Case Study of Landslide Monitoring. arXiv preprint arXiv:1312.4179.
[9] Ramesh, M. V. (2014). Design, development, and deployment of a wireless sensor net-work for detection of landslides. Ad Hoc Netnet-works, 13, 2-18. https://doi.org/10.1016/ j.adhoc.2012.09.002
[10] Wu, C. I., Kung, H. Y., Chen, C. H., & Kuo, L. C. (2014). An intelligent slope disaster prediction and monitoring system based on WSN and ANP. Expert Systems with Applica-tions, 41(10), 4554-4562. https://doi.org/10.1016/j.eswa.2013.12.049
[11] Yu, X., Wu, P., Han, W., & Zhang, Z. (2013). A survey on wireless sensor network infra-structure for agriculture. Computer Standards & Interfaces, 35(1), 59-64. https://doi.org/10.1016/j.csi.2012.05.001
[12] Yueshun, H., & Wei, Z. (2013). The reseach on wireless sensor network for landslide monitoring. International Journal on Smart Sensing and Intelligent Systems, 6(3), 867-887. https://doi.org/10.21307/ijssis-2017-570
7
Authors
Bo Gan and Shan Jin are with Shandong Laber Vocational and Technical College, Jinan, China.