warwick.ac.uk/lib-publications
Original citation:Walasek, Lukasz, Yu, Erica C. and Lagnado, David A. (2017) Endowment effect despite the odds. Thinking & Reasoning.
Permanent WRAP URL:
http://wrap.warwick.ac.uk/92257
Copyright and reuse:
The Warwick Research Archive Portal (WRAP) makes this work by researchers of the University of Warwick available open access under the following conditions. Copyright © and all moral rights to the version of the paper presented here belong to the individual author(s) and/or other copyright owners. To the extent reasonable and practicable the material made available in WRAP has been checked for eligibility before being made available.
Copies of full items can be used for personal research or study, educational, or not-for profit purposes without prior permission or charge. Provided that the authors, title and full bibliographic details are credited, a hyperlink and/or URL is given for the original metadata page and the content is not changed in any way.
Publisher’s statement:
“This is an Accepted Manuscript of an article published by Taylor & Francis in Thinking & Reasoning on 04/10/2017 available online:
https://doi.org/10.1080/13546783.2017.1381163 A note on versions:
The version presented here may differ from the published version or, version of record, if you wish to cite this item you are advised to consult the publisher’s version. Please see the ‘permanent WRAP URL’ above for details on accessing the published version and note that access may require a subscription.
1
Endowment effect despite the odds.
Running head: Endowment effect
Lukasz WalasekA, Erica C. YuB, David A. LagnadoC
This work was supported by the Leverhulme Trust under Grant RP2012-V-022.
Primary affiliations
A Lukasz Walasek, Department of Psychology, University of Warwick, Coventry, West
Midlands, England CV4 7AL, E-Mail: [email protected]
B Erica C. Yu, Department of Psychology, University of Maryland, College Park,
MD 20742, USA, E-Mail: [email protected]
C David A. Lagnado, Department of Experimental Psychology, University College London,
UK, E-Mail: [email protected]
Correspondence to: Lukasz Walasek, WMG, University of Warwick, Coventry, West
Midlands, England CV4 7AL, E-Mail: [email protected]
Word count: 5877 (including references)
1 Current affiliation of Lukasz Walasek is WMG, University of Warwick, Coventry, West Midlands, England, CV4
7AL
2
ABSTRACT
Can ownership status influence probability judgments under condition of uncertainty? In
three experiments, we presented our participants with a recording of a real horse race. We
endowed half of our sample with a wager on a single horse to win the race, and the other half
with money to spend to acquire the same wager. As the race progressed, participants were
asked to update their buying or selling prices, and to estimate the probability that a given
horse will win the race. Across three large studies (N = 750), we found the endowment effect
– owners demanded significantly more for the wager than buyers were willing to pay to
acquire it. However, we also found that probability estimates of each horse winning the race
did not differ between owners and non-owners of the betting slip, despite the fact that the
only information participants should use to inform their valuation is the strength of their
belief that each horse will win the race. Our results demonstrate that distorted perception of
probability is unlikely to be a mechanism explaining the endowment effect.
3
One of the most robust and widely-reported anomalies in behavioural economics is a pattern
of preferences called the endowment effect, whereby people require more compensation to
give up an object than they will pay to acquire it (Kahneman, Knetsch, & Thaler, 1991;
Thaler, 1980). This asymmetry is apparent in studies where sellers’ (owners)
willingness-to-accept (WTA) is systematically found to be much higher than buyers’ (non-owners)
willingness-to-pay (WTP) for the same product. The effect is often explained using prospect
theory (Kahneman & Tversky, 1979): the valuation disparity arises as a consequence of loss
aversion from the perspective of the owner of the object, with losses being weighted more
heavily than gains. Since loss aversion offers a purely descriptive account of the endowment
effect, a number of efforts have been directed at explaining the cognitive and affective
processes that may produce the WTA-WTP gap (Ariely, Huber, & Wertenbroch, 2005; Gal,
2006). A large proportion of this work focused on the comparison between owners’ and
non-owners’ behavior for goods that are risky, such as monetary gambles or lottery tickets (see
Yechiam, Ashby, & Pachur, 2017 for a recent meta-analysis).
One possible cause for the endowment effect under conditions of risk and uncertainty,
which has been largely overlooked in the past literature, is that owners may overestimate the
value of a possession due to a distorted perception of the probability with which a given object
will bring a positive return (Okada, 2010; Walasek, Wright, & Rakow, 2014). Consider one of
the most striking demonstrations of the endowment effect in risky choice – the unwillingness
to trade lottery tickets (Bar-Hillel & Neter, 1996; Risen & Gilovich, 2007). One ticket in a
random draw lottery is just as valuable as any other ticket and yet participants have shown
reluctance to trade with each other, even if the exchange brings additional monetary reward
and the transaction costs are minimal. When Bar-Hillel and Neter (1996) asked their
participants to state the probability that a held ticket would be the winning one, the probabilities
4
transparent lottery, it should not be surprising that participants were able to simply report the
objective probability of winning. However, this method cannot fully discount the possibility
that participants’ personal beliefs about their chance of winning were distorted by their
ownership status.
In order to explore whether ownership status can distort probability estimates, we now
turn to goods of uncertain value, for which the probabilities associated with outcomes are
unknown to the decision maker. To investigate whether probability judgments can be distorted
by the ownership status, we use horse racing as the context for our experiments. Horse races
represent a good example of dynamic uncertainty experienced in the environment where
probabilities associated with the different outcomes are often unknown. Before a race begins,
bettors must integrate their prior beliefs, without any evidence from the present race, to decide
which horse to bet on. As the race progresses, more information is available that can be used
to update observers’ beliefs. In the following three experiments, we endowed half of our sample
with a wager on a single horse winning the race, and the other half with money to spend to
acquire the same wager. As the race progressed and new information about the competitors
was accumulated, participants were asked to update their buying or selling prices, and to
estimate the probability that a given horse will win the race.
This unique experimental design allows us to test three possible effects of ownership
status on stated probability judgments. First, it is possible that ownership status alone can be
a source of bias in probability estimates. For example, participants who own a bet may
believe that giving up their ticket “tempts fate” and increases the chance of a negative event
occurring (Durand, Emhoff, Frey, Shea, & Holmes, 2015; Risen & Gilovich, 2007, 2008).
However, we should also expect that the differences between owners and non-owners in
probability estimates and valuation reduce as the race progresses and the uncertainty
5
additional information about horses’ performance should correct, at least in part, any
misperception formed at the point when ownership of the bet was the only basis for forming a
prediction about the race results. Second, an alternative prediction is that the size of the
endowment effect and the discrepancy in probability judgments will increase as more
information about the race is accrued. This prediction is based on the growing evidence that
the WTA-WTP gap reflects differences in information-processing, which involve
mechanisms of attention allocation (Carmon & Ariely, 2000), memory retrieval (Johnson,
Häubl, & Keinan, 2007), or pre-decisional information search (Pachur & Scheibehenne,
2012). According to these accounts, ownership status leads to a biased evaluation of the
product, elevating its value for owners but suppressing it for buyers (Morewedge & Giblin,
2015; Novemsky & Kahneman, 2005). While our study does not aim to discern between
these individual process-based mechanisms, we predict that continuous and biased
information processing can enlarge differences in the probability estimates between owners
and non-owners. The third possibility is that there are no differences in the probability
estimates of owners and non-owners, and that the (mis)perception of probability does not
contribute to the size of the WTA-WTP gap. Here we summarize the three predictions in the
form of competing hypotheses about the role of ownership status in probability judgments
under condition of uncertainty:
H1: Ownership status is a source of bias in probability judgments when no diagnostic
information is available. The bias should reduce as more information is accumulated, leading
to a reduction of the endowment effect.
H2: Ownership status is a source of bias in information processing. As a result, the
6
H3: Ownership status does not influence probability estimates and the endowment
effect can arise in the absence of any distortions in people’s judgments.
Experiment 1a
Method
Design and Materials
Participants were assigned to the group of owners or non-owners of a virtual betting
slip for a wager on a particular horse (Severina). This bet could return $2.00 if Severina won
the race, but nothing if the horse did not finish first. Instead of a betting slip, non-owners
were given an additional $1.00 which they could use to purchase the wager. The field of eight
horses was narrowed for wagering purposes to two, which were identified as being among the
top four finishing horses. Unbeknownst to the participants, the two horses were in fact the
first (Severina) and second-place (Happy Daze) finishers. Race footage was taken from the
Lagoon Games package (Race 1 from Lagoon Handicap Hurdle; two miles and one furlong)
with audio commentary muted; participants had no prior odds information. An online survey
system (Qualtrics; www.qualtrics.com) controlled the display and timing of the video
playback and questions.
We divided the race footage into three blocks in order to capture different beliefs
about the probability of Severina and Happy Daze winning the race. At the beginning of each
block participants had a chance to either buy or sell the wager by specifying their WTP or
WTA, respectively. On the next screen, each participant was also asked to indicate the
probability of the two horses winning the race. The first valuation and probability estimation
occurred when horses were still at the starting gates. At this point, each horse was equally
7
blocks 1 and 2 Happy Daze and Severina were tied and in the lead, but with half of the
distance still ahead of them. Block 2 ended just before the finishing line, with Happy Daze in
the lead and Severina in 5th position.
Participants
A sample of 286 participants from the USA was obtained via the online platform
Amazon Mechanical Turk (MTurk; www.mturk.com). When responses originated from the
same IP address, only the earlier submission was retained, unless the two overlapped in time.
Data from participants failing to answer every question were deleted. We also removed
participants who did not provide correct valuation responses in the pricing task (e.g.,
switched multiple times in the price list). The final sample used in the analysis included 229
responses. Each individual received at least $0.50 for taking part in the study, which took
approximately 15 minutes to complete.
Procedure
At the beginning of the experiment, participants were informed that they were going
to watch a video recording of a horse race. They were then given either a $1.00 bet which
would return $2.00 if Severina won the race, or $1.00 that could be used to obtain this wager.
Both owners and non-owners were informed that at three points during the horse race, they
would have the opportunity to choose between acquiring (selling) the bet and different
amounts of money. This opportunity came at the beginning of each block: just before the start
of the race (block 1), halfway through the race (block 2) and just before the finish line (block
3). The buying and selling task applied the Becker-DeGroot-Marschak incentive compatible
method (BDM; Becker, DeGroot & Marschak, 1964). As it was explained to the participants,
8
participants purchased or sold the wager. The market value could be compared to any of the
three valuations made during the experiment.
In addition to the valuation questions, participants were also asked about the
probability that Happy Daze and Severina would win the race. Responses for each horse were
recorded separately using two sliders that did not need to add up to 100 percent. Probability
judgments were always collected at the end of each block (1, 2 and 3) but always after
valuation questions. When the race finished, a random market price for the wager was
generated to determine final ownership of the wager. Those who ended up with a bet were
paid $2.50 ($0.50 participation fee + $2.00 winnings) minus the amount of money they spent
in order to acquire the wager (buyers only). Individuals who ended up not owning the wager
received a $0.50 participation fee plus either $1.00 (buyers only) or the amount they sold the
wager for (sellers only).3
Results
A summary of owners’ and non-owners’ valuations across three stages of the race is
presented in the top left panel of Figure 1.
*** Insert Figure 1 About Here ***
From the plot, it is clear that owners asked for more money for the wager than buyers were
willing to pay for it, demonstrating the classic endowment effect. Furthermore, although
valuations visibly drop from block 2 to 3, the WTA-WTP disparity remains stable across all
three time points. Consistent with the events in the race, valuations of the wager are close to
$1.00 when horses are still at the starting line (block 1) and when they are tied halfway
9
through the race (block 2). However, the value of the wager on Severina drops considerably
when the horse is in the 5th position, just before the end of the race.
We analysed the valuation data for all three blocks simultaneously using linear mixed
effect modeling (with lme R package; http://www.R-project.org/). The model included a
random effect of participant and fixed effects for the ownership status and block (and their
interaction). Summary of the results for valuation are shown in the top panel of Table 1. The
corresponding p-values were calculated using the Satterthwaite approximation (lmerTest
package in R, Kuznetsova, Brockhoff, & Christensen, 2014).
*** Insert Table 1 About Here ***
The results confirm that there is a significant endowment effect. Also, valuations drop
significantly in block 3, just before the end of the race. From the lack of interaction with time
at which valuation was made we can conclude that the size of the gap was relatively constant
throughout the race. Indeed, owners demanded 22.4%, 21.6% and 25.0% more than
non-owners, at each consecutive time point of the race. In comparison to other studies that used
risky (but not uncertain) objects, our endowment effect was smaller than the median ratio of
1.52 found in a recent meta-analysis (Yechiam et al., 2017).
The probability judgments for both Severina and Happy Daze reveal that owners and
non-owners of the wager shared approximately the same beliefs about the odds of the two
horses winning the race. The surprising lack of any disparity is apparent in both left and right
panels in the top part of Figure 2. This result is consistent with Hypothesis 3.
*** Insert Figure 2 About Here ***
Overall, whereas probability estimates varied throughout the race, the sum of the aggregate
10
be this high since Severina and Happy Daze were not the only horses involved in the race and
participants were explicitly told that these two horses were among the top four finishers. We
return to this issue in our general discussion. Notably, however, probability estimates appear
to reflect relative changes in valuations that we can observe in Figure 1.
We used mixed effect modelling to predict probability judgments at block 1, 2 and 3
for each horse separately. Surprisingly, the effect of ownership status is significant in case of
Happy Daze (bottom section of the Table 1) although it is clear from Figure 2 that the only
evident difference occurs at the beginning of block 1 (but note that the interaction effect is
not significant with p-values of .065 and .093). It therefore seems that while owners and
non-owners were in agreement regarding the chances of Severina winning, their beliefs about
Happy Daze may have differed marginally. Notably, compared to owners, non-owners tend
to overestimate the probability that Happy Daze will win the race, which is hard to reconcile
with the valuation data where the size of the endowment effect remained relatively stable in
all three blocks.
Experiment 1b
The results of the Experiment 1a are surprising in that we find strong evidence for the
endowment effect in the absence of differences in the subjective probability judgments
between owners and non-owners of a wager. In order to determine whether these effects are
robust, we conducted a replication study with a new sample of participants. In Experiment 1a,
participants were always asked to value the wager before providing probability estimates. In
Experiment 1b, we reversed the order of these questions, always asking our participants about
the probability of each horse winning the race first.
11
Design and Materials
Design and Materials were identical to those used in Experiment 1a.
Participants
We recruited 300 participants from the USA using MTurk. In Experiment 1b, we
increased the base payment to $0.75. We used the same screening criteria as in Experiment
1a (16 removed) but additionally asked our participants if they have encountered any
technical problems or have taken part in a similar study before (i.e. study with videos of horse
races). Only one participant had an issue with the videos loading correctly and was excluded
from the analysis. Our final sample included 283 responses.
Procedure
The procedure was identical to Experiment 1a with one exception. In the current
study, participants were always asked to provide their probability estimates immediately after
watching a video and before they could determine WTP or WTA for the wager.
Results
The right panel of Figure 1 illustrates the presence of the endowment effect in all
three blocks of the horse race, which is consistent with the results of Experiment 1a. Owners
of the bet demanded 28.1%, 31.1% and 28.6% more than non-owners in blocks 1, 2 and 3,
respectively. Middle left panel of Figure 2 demonstrates that probability judgments for
Severina winning the race were not different between owners and non-owners. For Happy
Daze, on the other hand, we find that non-owners gave higher probability estimates than
owners in all three blocks of the race. This interpretation is confirmed by the results of two
12
the main effect of Ownership status is significant for the probability estimates of Happy Daze
winning the race (bottom part of Table 1).
Overall, we find a clear WTA-WTP gap in valuation in the context of horse racing. At
the same time, we do not find evidence supporting the hypothesis that this disparity is driven
by a difference in beliefs about the odds of each horse winning the race. Consequently, we do
not find that distortions of probability estimates (and valuation gaps) decrease (Hypothesis 1)
or increase (Hypothesis 2) as the race goes on. Instead, we find further support for our
Hypothesis 3 according to which ownership status does not impact probability judgments.
Experiment 2
One interpretation of the findings presented so far is that ownership status does not
influence buyers’ and sellers’ probability estimates, and therefore cannot explain the
observed endowment effect. Another possibility is that our measure of bettors’ beliefs was
not sensitive enough to identify differences between owners and non-owners of the wager. In
fact, our measure was limiting in that it only allowed for a single point estimate for each of
the two horses. It seems more plausible, however, that individual beliefs take a form of a
distribution over some probability space, which simply reflects varying strength with which a
given belief is held. In order to address potential limitation of our measurement, we elicited
people’s probability estimates in the form of distributions over a range of probabilities in
Experiment 2. In other words, we gave our participants an opportunity to express their
confidence in their estimates of probabilities that the horses Severina and Happy Daze will
win the race.
Obtaining people’s judgments as belief distribution allows us to test more precisely
how ownership status influences people’s probability estimates. First, it is possible that
13
authors have argued that the prospect of losing owned possession motivates sellers to devote
more cognitive resources to the task at hand. Indeed, it has been argued that the differences in
cognitive effort and motivation between owners and non-owners may explain valuation gaps
(Yechiam & Hochman, 2013). The second possibility is that owners and non-owners may
differ in the amount of skew in their belief distributions. That is, while their mean judgment
could be the same, owners may be nonetheless biased towards higher estimates while
non-owners may be biased towards lower estimates. We therefore use skewness scores as a more
sensitive measure for detecting biased representation of an object that could in part be
responsible for the emergence of the endowment effect.
Method
Design and Materials
Design and Materials were identical to Experiment 1a, with only one key difference.
In Experiment 2, we used DistributionBuilder tool (Andre, 2016) to collect our participants’
subjective judgments that a given horse will win the race. This method was originally
introduced by (Sharpe, Goldstein, & Blythe, 2000) and was subsequently employed to study
people’s subjective probabilities and confidence judgments (Goldstein, Johnson, & Sharpe,
2008). The tool permits participants to indicate their response by assigning tokens to
individual bins that represent some chosen quantity. In the present study, we used 11 bins that
ranged from 0% to 100% in 10% intervals. Each participant had 10 tokens to distribute such
that their assignment reflected their confidence in the exact probability that a given horse
would win the race. The maximum number of tokens that could be assigned to any individual
bin was set to 10.
14
We recruited 332 participants from MTurk. The base payment for this study was set
to $0.75. In addition to the exclusion criteria used in Experiment 1b, we also removed
responses of participants who failed to complete our new distribution elicitation questions.
Our final sample size included 238 responses.
Procedure
The procedure was identical to Experiment 1a with the exception of the new
probability estimation questions replacing the probability point estimate questions used in the
previous two experiments. We adapted our instructions and showed participants a screenshot
of a distribution builder tool. Participants were asked to distribute all 10 tokens between the
available bins. They were also informed that the more confident they are in a given
probability, the more tokens they should assign to it.
Results
Mean valuations of owners and non-owners are shown in the bottom panel of Figure
1. Results are highly consistent with Experiment 1a and 1b, which is further confirmed by the
regression analyses (see Table 2). As before, we find a significant effect of ownership
(owners demanding 39.4%, 44.6% and 37.4% more than non-owners blocks 1, 2 and 3,
respectively), and that valuations are lower in block 3 than in block 1.
*** Insert Table 2 About Here ***
In order to compare probability estimates, we first computed a modal response given
by the participants in the distribution builder task. We simply computed the weighted average
based on the tokens that people assigned to different probability bins. The results are plotted
in the bottom panel of Figure 2. Visibly, the pattern of results is consistent with our previous
15
First, while we find that probability judgments follow the events of the race, there are no
differences between owners and non-owners in judged probability of Severina winning the
race. In the case of Happy Daze, the effect of ownership is also absent. These conclusions
align with the results of our regression analyses, which are reported in Table 3.
*** Insert Table 3 About Here ***
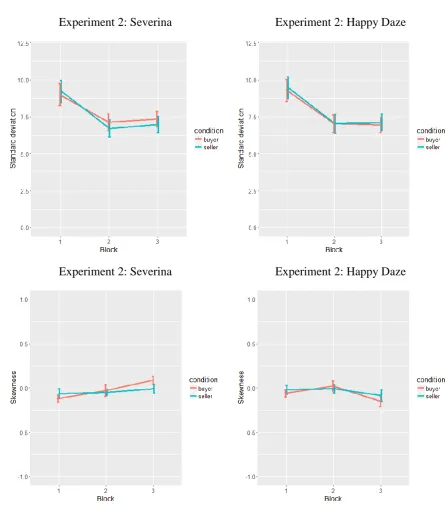
The use of distribution builder allows us to explore two further features of the elicited
beliefs. First, we computed the confidence of people’s judgments, by calculating the standard
deviation of people’s responses. Table 3 summarizes results of the regression analysis, which
tells us that standard deviation was lower in Blocks 2 and 3 compared to Block 1. However,
buyers and sellers did not differ in terms of the confidence with which they judged the
probability of each horse winning the race. Next, we computed skewness scores among our
participants. One possibility is that owners are biased towards high estimates, while
non-owners are biased towards low estimates, even if their modal responses are the same. We
computed skewness statistic for each participant’s responses (package e1071; Joanes & Gill,
1998). The score of 0 represents a perfectly symmetrical distribution. Regression results in
Table 3 show that, once more, we find no differences between owners and non-owners. In
other words, ownership of the wager did not lead owners and non-owners to be biased
towards higher and lower estimates, respectively. Both standard deviations and skewness
scores are plotted in Figure 3.
*** Insert Figure 3 About Here ***
General Discussion
Our results show that ownership status does not influence probability judgments
16
that people endowed with a wager demanded more money in exchange for it than buyers
were willing to pay for it. As the race progressed and new information about the horses was
accumulated by the participants, the valuation gap remained constant. Finally, perceived
probability of each horse winning the race did not differ between owners and non-owners of
the betting slip. Thus, although owners overvalued their wager on Severina, they did not
think that this horse was more likely to win, or that the challenger (Happy Daze) was less
likely to succeed. This is surprising since the only information participants should use to
inform their valuation is the strength of their belief that each horse will win the race.
To the best of our knowledge we are the first to show how the endowment effect
evolves across time in a realistic setting, with accumulation of new evidence under conditions
of uncertainty. Our design allowed us to explore three unique stages of belief formation. At
the beginning of the race, we observed equal probability estimates of owners and non-owners
when no prior information about the horses was available. At the end of the first block,
participants had a chance to evaluate both horses when they were tied. Despite the fact that
everyone was free to evaluate the horses’ performance throughout the race, the probability
judgments of the two groups did not diverge. In the final stage, the poor performance of
Severina is reflected in probability judgments, although once again, the perception is the
same among owners and non-owners of the betting slip. Clearly, perception of probability
was unrelated to the size of the endowment effect.
We observed some differences in judged probability of Happy Daze winning the race.
In Experiment 1a, buyers’ estimates were higher before the race began, and in Experiment 1b
buyers’ estimates were slightly higher in all three blocks of the race. In Experiment 2, on the
other hand, there were no differences between owners and non-owners at any point in the
race. The observed distortions were generally too small (~3%) to be able to explain the robust
17
While probability estimates generally followed events of the race and reflected
people’s valuations, we also observed that estimates were generally very high. More
specifically, since participants were informed that Severina and Happy Daze are among top
four finishers, it is surprising that probability estimates for the two target horses often
summed up to 100%. It therefore appears that our participants ignored the fact that other
horses could also win the race. One possible explanation for this result is that our instructions
and experimental design reinforced individuals’ belief that the winner must be either Severina
or Happy Daze. Nonetheless, there is no apparent reason why this could obscure our main
finding that the estimates of probability are the same for owners and non-owners of the
betting slip.
Since we did not find that distorted probability judgments accounted for the endowment
effect, it is likely that other mechanisms are responsible for the WTA-WTP disparity in our
experiment. One obvious candidate is regret aversion (Bar-Hillel & Neter, 1996; Kogler,
Kühberger, & Gilhofer, 2013; Ratan, 2013; Risen & Gilovich, 2008). Anticipated feelings of
regret associated with giving up a winning bet or wasting money on an unsuccessful one has
been shown to be a strong contributor to the endowment effect. For example, Ratan, (2013)
demonstrated that when holders of a lottery tickets can reverse their decision to sell or keep
their endowment, they are more likely to trade. Similarly, inducing feelings of regret
(Martinez, Zeelenberg, & Rijsman, 2011) or making them less vivid (Maimaran, 2011),
reduce the under trading in lottery tasks. Although some have suggested that misperception of
probability might contribute to the WTA-WTP disparity alongside feelings of regret, our
results suggest that this is an unlikely scenario. In line with the work of Walasek et al. (2014),
we find that the perception of probability does not seem to explain the endowment effect.
However, in contrast to their findings, we did not observe that the endowment effect
18
Our results, together with those reported by Bar-Hillel and Neter (1996; also Walasek
et al., 2014), show that a difference in valuation between owners and non-owners for objects
of risky or uncertain value can arise even when these two groups do not differ in their
perception of probability associated with these goods/assets. Despite this, plenty of empirical
evidence shows that owners and non-owners differ in their evaluation of an object, in both
risky and riskless contexts. For example, Johnson, Häubl and Keinan (2007) argued that
perspective (i.e., being a buyer vs. a seller) influences internal information search when
people generate valuations of goods. The process is explained by Query Theory (QT; Weber
& Johnson, 2006), which posits that buyers and sellers retrieve information about the value of
goods based on their current status quo. Specifically, buyers initially retrieve information that
decreases the value of a prospective purchase, while sellers tend to first recall features that
enhance the value of their asset/possession. Several studies (e.g., Johnson et al., 2007) found
support for QT’s predictions with differences in information retrieval being shown to mediate
the endowment effects. According to these accounts, the top-down effect of ownership status
influences attention allocation to positive and negative attributes of a good (Ashby, Dickert,
& Glockner, 2012; Carmon & Ariely, 2000; Nayakankuppam & Mishra, 2005). Lastly,
ownership status also appears to influence the pre-decisional information search. Pachur and
Scheibehenne (2012) found that when probabilities and outcomes of gambles are not known
to the participants, but this information can be acquired by repeatedly sampling from different
alternatives, the stopping rule of this search differs as a function of ownership status. In their
study, owners were more likely to stop their information search after encountering a positive
outcome, whereas buyers were more likely to stop having seen a negative outcome. The
authors showed that these differences predicted the size of the endowment effect in their
19
The accounts summarized above suggest that owners and non-owners form a biased
representation of an object, which gives rise to the WTA-WTP disparity. Our results suggest
that the endowment effect can occur even if owners and non-owners share the same
perception of how profitable an uncertain asset is. In explaining the endowment effect,
further studies are needed to address the apparent discordance between different process level
measurements, valuation, and evaluative judgments.
References
Andre, Q. (2016). DistributionBuilder v 1.0.0. Retrieved from
https://zenodo.org/record/166736/export/dcite3#.WTK-9WjyuUk
Ariely, D., Huber, J., & Wertenbroch, K. (2005). When do losses loom larger than gains?
Journal of Marketing Research, 42(2), 134–138.
https://doi.org/10.1509/jmkr.42.2.134.62283
Ashby, N. J. S., Dickert, S., & Glockner, A. (2012). Focusing on what you own: Biased
information uptake due to ownership. Judgment and Decision Making, 7(3), 254–267.
Bar-Hillel, M., & Neter, E. (1996). Why are people reluctant to exchange lottery tickets?
Journal of Personality and Social Psychology, 70(1), 17–27.
https://doi.org/10.1037/0022-3514.70.1.17
Carmon, Z., & Ariely, D. (2000). Focusing on the forgone: How value can appear so different
to buyers and sellers. Journal of Consumer Research, 27(3), 360–370.
https://doi.org/10.1086/317590
20
those who tempt fate. Retrieved October 27, 2016, from
http://www.psychfiledrawer.org/replication.php?attempt=MjIy
Frederick, S. (2005). Cognitive reflection and decision making. Journal of Economic
Perspectives, 19(4), 25–42. https://doi.org/10.1257/089533005775196732
Gal, D. (2006). A psychological law of inertia and the illusion of loss aversion. Judgment and
Decision Making, 1(1), 23–32. https://doi.org/10.1037/e683162011-083
Goldstein, D. G., Johnson, E. J., & Sharpe, W. F. (2008). Choosing outcomes versus
choosing products: Consumer-focused retirement investment advice. Journal of
Consumer Research, 35(3), 440–456. https://doi.org/10.1086/589562
Joanes, D. N., & Gill, C. A. (1998). Comparing measures of sample skewness and kurtosis.
Journal of the Royal Statistical Society: Series D (The Statistician), 47(1), 183–189.
https://doi.org/10.1111/1467-9884.00122
Johnson, E. J., Häubl, G., & Keinan, A. (2007). Aspects of endowment: a query theory of
value construction. Journal of Experimental Psychology. Learning, Memory, and
Cognition, 33(3), 461–74. https://doi.org/10.1037/0278-7393.33.3.461
Kahneman, D., & Tversky, A. (1979). Prospect theory: An analysis of decision under risk.
Econometrica, 47(2), 263. https://doi.org/10.2307/1914185
Kogler, C., Kühberger, A., & Gilhofer, R. (2013). Real and hypothetical endowment effects
when exchanging lottery tickets: Is regret a better explanation than loss aversion?
Journal of Economic Psychology, 37, 42–53. https://doi.org/10.1016/j.joep.2013.05.001
Kuznetsova, A., Brockhoff, P. B., & Christensen, R. H. B. (2014). lmerTest: Tests for
21
package).
Maimaran, M. (2011). To trade or not to trade: The moderating role of vividness when
exchanging gambles. Judgment and Decision Making, 6(2), 147–155.
Martinez, L. F., Zeelenberg, M., & Rijsman, J. B. (2011). Regret, disappointment and the
endowment effect. Journal of Economic Psychology, 32(6), 962–968.
https://doi.org/10.1016/j.joep.2011.08.006
Morewedge, C. K., & Giblin, C. E. (2015). Explanations of the endowment effect: an
integrative review. Trends in Cognitive Sciences, 19, 339–348.
https://doi.org/10.1016/j.tics.2015.04.004
Nayakankuppam, D., & Mishra, H. (2005). The endowment effect: Rose-tinted and
dark-tinted glasses. Journal of Consumer Research, 32(3), 390–395.
Novemsky, N., & Kahneman, D. (2005). The boundaries of loss aversion. Journal of
Marketing Research, 42(2), 119–128. https://doi.org/10.1509/jmkr.42.2.119.62292
Okada, E. M. (2010). Uncertainty, risk aversion, and WTA vs. WTP. Marketing Science,
29(1), 75–84. https://doi.org/10.1287/mksc.1080.0480
Pachur, T., & Scheibehenne, B. (2012). Constructing preference from experience: the
endowment effect reflected in external information search. Journal of Experimental
Psychology. Learning, Memory, and Cognition, 38(4), 1108–16.
https://doi.org/10.1037/a0027637
Ratan, A. (2013). Anticipated regret or endowment effect? A reconsideration of Exchange
asymmetry in laboratory experiments. Journal of Economic Analysis & Policy, 14(1),
22
Risen, J. L., & Gilovich, T. (2007). Another look at why people are reluctant to exchange
lottery tickets. Journal of Personality and Social Psychology, 93(1), 12–22.
https://doi.org/10.1037/0022-3514.93.1.12
Risen, J. L., & Gilovich, T. (2008). Why people are reluctant to tempt fate. Journal of
Personality and Social Psychology, 95(2), 293–307.
https://doi.org/10.1037/0022-3514.95.2.293
Sharpe, W. J., Goldstein, D. G., & Blythe, P. W. (2000). The distribution builder: A tool for
inferring investor preferences. Retrieved from
http://www.stanford/.edu/˜wfsharpe/art/qpaper/qpaper.html
Walasek, L., Wright, R. J., & Rakow, T. (2014). Ownership status and the representation of
assets of uncertain value: The balloon endowment risk task (BERT). Journal of
Behavioral Decision Making, 27(5), 419–432. https://doi.org/10.1002/bdm.1819
Weber, E. U., & Johnson, E. J. (2006). Constructing preferences from memory. In S.
Lichteinstein & P. Slovic (Eds.), The Construction of Preference (pp. 397–410). New
York, NY. https://doi.org/10.2139/ssrn.1301075
Yechiam, E., Ashby, N. J. S., & Pachur, T. (2017). Who’s biased? A meta-analysis of buyer–
seller differences in the pricing of lotteries. Psychological Bulletin, 143(5), 543–563.
https://doi.org/10.1037/bul0000095
Yechiam, E., & Hochman, G. (2013). Losses as modulators of attention: review and analysis
of the unique effects of losses over gains. Psychological Bulletin, 139(2), 497–518.
23
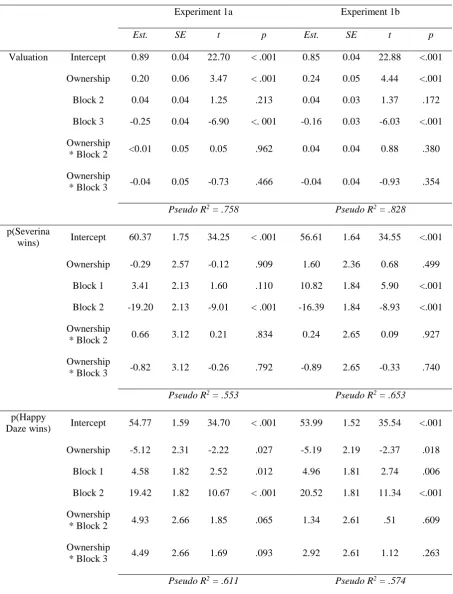
Table 1. The effect of ownership status and block on valuation and probability judgments.
Experiment 1a Experiment 1b
Est. SE t p Est. SE t p
Valuation Intercept 0.89 0.04 22.70 < .001 0.85 0.04 22.88 <.001
Ownership 0.20 0.06 3.47 < .001 0.24 0.05 4.44 <.001
Block 2 0.04 0.04 1.25 .213 0.04 0.03 1.37 .172
Block 3 -0.25 0.04 -6.90 <. 001 -0.16 0.03 -6.03 <.001
Ownership
* Block 2 <0.01 0.05 0.05 .962 0.04 0.04 0.88 .380
Ownership
* Block 3 -0.04 0.05 -0.73 .466 -0.04 0.04 -0.93 .354
Pseudo R2 = .758 Pseudo R2 = .828
p(Severina
wins) Intercept 60.37 1.75 34.25 < .001 56.61 1.64 34.55 <.001
Ownership -0.29 2.57 -0.12 .909 1.60 2.36 0.68 .499
Block 1 3.41 2.13 1.60 .110 10.82 1.84 5.90 <.001
Block 2 -19.20 2.13 -9.01 < .001 -16.39 1.84 -8.93 <.001
Ownership
* Block 2 0.66 3.12 0.21 .834 0.24 2.65 0.09 .927
Ownership
* Block 3 -0.82 3.12 -0.26 .792 -0.89 2.65 -0.33 .740
Pseudo R2 = .553 Pseudo R2 = .653
p(Happy
Daze wins) Intercept 54.77 1.59 34.70 < .001 53.99 1.52 35.54 <.001
Ownership -5.12 2.31 -2.22 .027 -5.19 2.19 -2.37 .018
Block 1 4.58 1.82 2.52 .012 4.96 1.81 2.74 .006
Block 2 19.42 1.82 10.67 < .001 20.52 1.81 11.34 <.001
Ownership
* Block 2 4.93 2.66 1.85 .065 1.34 2.61 .51 .609
Ownership
* Block 3 4.49 2.66 1.69 .093 2.92 2.61 1.12 .263
Pseudo R2 = .611 Pseudo R2 = .574
Note. For the fixed effect of ownership, sellers are used as a reference point. “Est.” stands for the
24
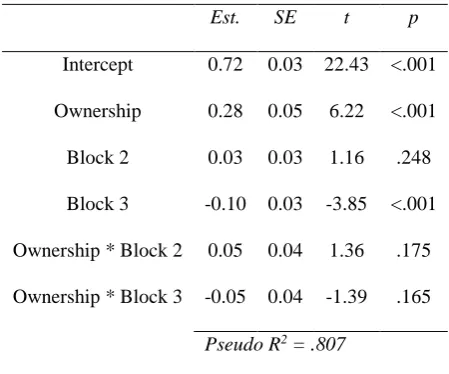
Table 2. The effect of ownership status and block on valuation in Experiment 2.
Est. SE t p
Intercept 0.72 0.03 22.43 <.001
Ownership 0.28 0.05 6.22 <.001
Block 2 0.03 0.03 1.16 .248
Block 3 -0.10 0.03 -3.85 <.001
Ownership * Block 2 0.05 0.04 1.36 .175
Ownership * Block 3 -0.05 0.04 -1.39 .165
25
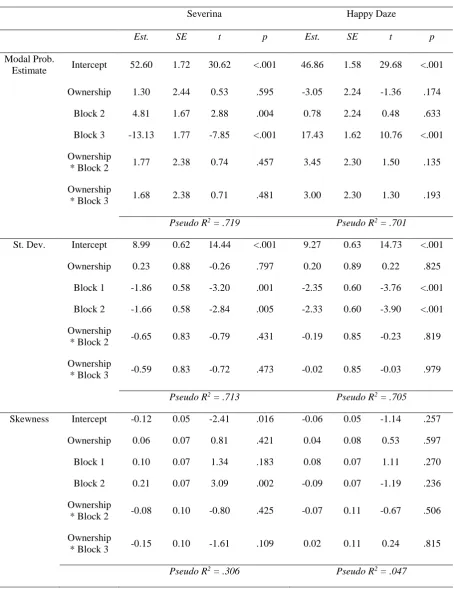
Table 3. The effect of ownership status and block on valuation and probability judgments in Experiment 2.
Severina Happy Daze
Est. SE t p Est. SE t p
Modal Prob.
Estimate Intercept 52.60 1.72 30.62 <.001 46.86 1.58 29.68 <.001
Ownership 1.30 2.44 0.53 .595 -3.05 2.24 -1.36 .174
Block 2 4.81 1.67 2.88 .004 0.78 2.24 0.48 .633
Block 3 -13.13 1.77 -7.85 <.001 17.43 1.62 10.76 <.001
Ownership
* Block 2 1.77 2.38 0.74 .457 3.45 2.30 1.50 .135
Ownership
* Block 3 1.68 2.38 0.71 .481 3.00 2.30 1.30 .193
Pseudo R2 = .719 Pseudo R2 = .701
St. Dev. Intercept 8.99 0.62 14.44 <.001 9.27 0.63 14.73 <.001
Ownership 0.23 0.88 -0.26 .797 0.20 0.89 0.22 .825
Block 1 -1.86 0.58 -3.20 .001 -2.35 0.60 -3.76 <.001
Block 2 -1.66 0.58 -2.84 .005 -2.33 0.60 -3.90 <.001
Ownership
* Block 2 -0.65 0.83 -0.79 .431 -0.19 0.85 -0.23 .819
Ownership
* Block 3 -0.59 0.83 -0.72 .473 -0.02 0.85 -0.03 .979
Pseudo R2 = .713 Pseudo R2 = .705
Skewness Intercept -0.12 0.05 -2.41 .016 -0.06 0.05 -1.14 .257
Ownership 0.06 0.07 0.81 .421 0.04 0.08 0.53 .597
Block 1 0.10 0.07 1.34 .183 0.08 0.07 1.11 .270
Block 2 0.21 0.07 3.09 .002 -0.09 0.07 -1.19 .236
Ownership
* Block 2 -0.08 0.10 -0.80 .425 -0.07 0.11 -0.67 .506
Ownership
* Block 3 -0.15 0.10 -1.61 .109 0.02 0.11 0.24 .815
26
Figure 1. Mean valuations of buyers and sellers of the bet for Severina to win the race at the
beginning of each block.
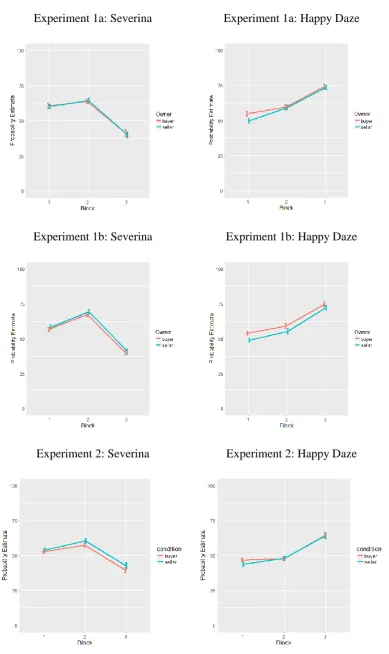
Figure 2. Probability estimates for Severina (left panel) and Happy Daze (right panel), for
Experiments 1a, 1b and 2.
Figure 3. Standard deviation (top panel) and skewness (bottom panel) of probability estimates
27
Experiment 1a Experiment 1b
[image:28.595.80.476.63.497.2]Experiment 2
Figure 1. Mean valuations of buyers and sellers of the bet for Severina to win the race at the
28
Experiment 1a: Severina Experiment 1a: Happy Daze
Experiment 1b: Severina Expriment 1b: Happy Daze
[image:29.595.78.468.61.716.2]Experiment 2: Severina Experiment 2: Happy Daze
Figure 2. Probability estimates for Severina (left panel) and Happy Daze (right panel), for
29
Experiment 2: Severina Experiment 2: Happy Daze
[image:30.595.71.518.57.564.2]Experiment 2: Severina Experiment 2: Happy Daze
Figure 3. Standard deviation (top panel) and skewness (bottom panel) of probability estimates