Permission-based Feature Selection for Android
Malware Detection and Analysis
Chit La Pyae Myo Hein
University of Computer Studies, Monywa
Khin Mar Myo
Central Institute of Civil Service (Lower Myanmar)
ABSTRACT
Malware is spreading around the world and infecting not only for ending users, but also for large organizations and service providers. There is a real need of a dimension reduction approach of malware features for better detection. This system describes for malware detection and characterization framework which is based on Static Approach by only analyzing the Manifest File of android application. This system also describes a Feature Selection Approach, which is also based on Manifest File Analysis for the purpose of dimension reducing of malware features. Firstly, a number of Permission-Based Features are extracted by disassembling the Manifest File of Android application. Then, feature dimensions are reduced by proposing Score-based Approach. The results getting from the Correlation and Information Gain are used to compare the results of Score-Based Features Selection. According to the experimental results, proposed a light-weight approach can perform as equal as other feature selection methods. After feature selection, manifest file analysis based on malware classification and characterization results are also described in this system. The classification results tested by without reducing features and the results obtained by reducing features are compared to determine which methods or classifiers are the best to detect malware.
Keywords
Android Security, Malware, Smartphone.
1.
INTRODUCTION
In the past few years, Smartphone users have increased exponentially. The various Smartphone age ranges of products from Nokia, Apple, Google, Blackberry, etc. The operating systems for Smartphone are Symbian, iOS, Android and Blackberry. The Smartphone is viewed as portable PCs as they have all the functionalities of a desktop PC integrated into them. Just as there are hackers/attackers releasing malware for PCs, there are attackers who are now targeting smartphone. The main reason for this is that mobile security is still in its initial stages and the lack of user awareness regarding how their devices can be undermined if they are not careful enough.
Google‟s is open-source operating systems. Android, are among the most popular Smartphone operating systems. Android is a Linux-based operating system that also includes key applications and middleware. In order to fully benefit from and explore the functionality of Android, Google allows third party developers to create applications and release it to the Android Market.
Android Market is one application that is mounted on the device that enables a user to browse and download several paid and free applications. It is the same as the AppStore for iPhone. Developers will have to sign their code and test it thoroughly to make sure it is functioning properly without causing any kind of harm to the user and they then release it on the Android Market.
It is however possible for attackers to release malware on Android Market. Google is currently making a success at cleaning the market and making it free from malware. However, attackers can create malware or patches for existing applications that once installed make the application behave as a malware or they can simply take an existing application and disassemble it, alter the code to enable it functions abnormally, and repackage the application.
Malware on Android have been huge in number and attackers are constantly discovering newer methods to crack into the devices. The main reason for this is because Smartphone like Android do not just use as a portable telephone these days. Android devices can access the internet, make online bank transmissions, manage social networks, etc. All these functionalities of a mobile phone seem very tempting for an attacker to obtain information about the user and use it to his/her benefit.
This research purpose to develop malware detection of static based on deriving of permission request using the manifest file of the application. The static approach provides human understandable and explainable terms, which do not prescribe additional post processing. Furthermore, in a court of law a judge and a jury may understand the reasoning behind the extracted terms, which are very important under computer forensic investigation of numerical evidences.
2.
LITERATURE REVIEW
code packing transformation. Therefore, this research is to create a static base which allows a developer to create malware for Android.
3.
MALWARE DETECTION
3.1
Proposed Malware Detection
Framework
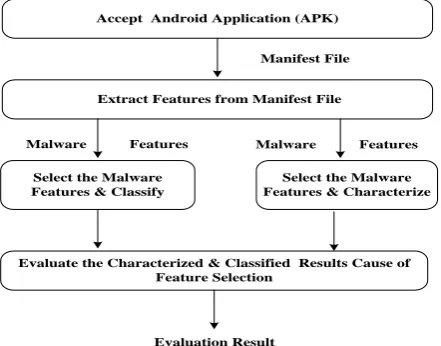
The first purpose of malware system is to reduce the detecting and classification of malware by introducing the features selection and extraction step in the process. The second purpose is to classify and characterize the malware by only taking the manifest file analysis in opposition to an existing machine learning approach.
The cost of analysis and risk for detecting malware can decrease by means of the static approach rather than a dynamic approach. Therefore, this system is also based on static (code-based) approach. The components of this system are as follows:
(i) Android Application File Accessing Component (ii) Feature Selection Components
(iii) Malware Detecting Component (iv) Malware Classification Component and (v) Malware Characterization Components. The system flow of the whole proposed system is illustrated in Figure 1. The feature selection methods follow the Feature Ranking approach and, using a specific metric to compute the rank and return a weight average value for each feature individually. By using this attribute selection method, the system can select generic features to merge the relevant and meaningful features for to input the system.
The second part of the system is to produce the feasible set of features. To produce this set of features merge common features and based features of each detection type. The six parts of the system are a classification. In this classification step, BayesNet (BN), Naïve Bayes, Multilayer Perceptron (MLP), K-Nearest Neighbor, J48 and Random Forest classifier are utilized to classify the detection types.
[image:2.595.58.279.564.737.2]Finally, the system can prove the performances of the proposed selecting features are higher than unselected features.
Fig 1: System flow diagram of the proposed system
3.1.1
Data Collection
In this system used different methods for retrieving the application samples from their respective websites, as well as retrieving information from the malicious applications.
3.1.1.1
Benign Dataset
The gathering of the market dataset is getting from four separate application markets, consisting of multiple features, ranging from developer identity to request permissions. In order to obtain as many application samples as possible, four Android application markets were chosen; Google Play AppBrain, Amazon App Store for Android, F-Droid and SlideMe as shown in Table 1.
Table 1. Number of Benign for each Category All Categories Number of Application
Development 35 Phone & SMS 38
Wallpaper 50
Office 51
Science & Education 81
Multimedia 174
System 67
Games 165
Internet 149
Security 25
Reading 51
Navigation 112
Children 2
Total 1000
3.1.1.2
Malware Dataset
The experimental study of this work is primarily taken from several sources of malicious data set. Numerous researchers propose complicated extensions to fortify the Android‟s security framework. The candidates included Symantec's Threat Explorer database, F-Secures Threat Description database and similar sources, in addition to the Contagio Mobile Dump. Databases of Symantec and F-Secure were ultimately decided against because it was impractical to automatically collect information from these databases. Additionally, the technical details were produced by hand by the researchers and as such the information was inconsistent as to whether or not they listed the permissions requested by the malware.
Cantagio collects and presents samples of malicious applications uploaded to the website by the public, and anyone can download these samples from their database as showed in Table 2.
Table 2. Number of Malware for each Category
All Categories Number of Application
TROJAN 171
ESCOFPRIV 199
Evaluate the Characterized & Classified Results Cause of Feature Selection
Select the Malware Features & Classify
Select the Malware Features & Characterize Malware Features Malware Features
Evaluation Result Accept Android Application (APK)
PREMSMS 222 INFOSTEAL 189 Root Exploit 200
Total 981
3.2
Proposed Score-Based Feature
Selection
[image:3.595.67.272.257.443.2]This system also proposes a feature selection method based on the manifest file analysis approach. The process flow of the propose method is described in Figure 2. The nature of mobile android application (APK) files, how to extract the features from mobile applications is described in this section. The detail explanation of how to process the proposed score-based feature selection is also referred to in the section below.
Fig 2: Flow of the proposed score-based feature selection
Firstly, I extracted the necessary features to analyze of sample applications (benign and malware). Then, I built datasets in (CSV) comma separated values file format from the extracted features. In this system, use of these two data sets to distinguish malware and benign applications by machine learning approaches. Each record comprises of the summary data of 134 permission features. Experts in malware detection labeled the dataset information as either „Ben‟ or „Mlw.‟ The labeling process made use of a malware dataset considered „Mlw‟ and a benign dataset categorized „Ben.‟
Finally, the ultimate dataset meant the integration of malware with normal datasets. Then, one of the features is in the Weka pre-processor wake.filters. Unsupervised. Instance. Randomize shuffled the records in the final data set.
To obtain features set of samples present in data set; the system used a Java based Android package profiling tool for automated reverse engineering of the .Ape files named as Apk Analyser. This tool unpacks and decompiles the input .Ape files to corresponding Dex and AndroidManifest.xml files. After doing reverse engineering, a set of detectors was applied to the reverse engineered .Ape files to detect properties used to build the profile for APK file. The feature vector obtained after property detection contains values for selected features as binary numbers (0 and 1), which is a suite of comma separated values. Let an application characteristic TA obtained from the ApkAnalyser detector is defined by a random variable:
𝑇𝐴 = {
0 𝑂𝑡ℎ𝑒𝑟𝑤𝑖𝑠𝑒1 𝑖𝑓 𝑑𝑖𝑠𝑐𝑜𝑣𝑒𝑟𝑒𝑑 𝑏𝑦 𝑡ℎ𝑒 𝑐𝑎𝑡𝑐 ℎ𝑒𝑠 𝑠𝑎𝑚𝑝𝑙𝑒 To generate the dataset, the first selected the samples. Initially, the system collected 400 samples. Next, the system normalized the values given by different antivirus vendors. The goal of this step was to ascertain their reliability detecting malware in Android. To this end, the system assumed that every sample that was detected as malware by at least one antivirus was, indeed, malware. Then, the system evaluates the request rate of scoring each malware sample with respect to the complete malware dataset.𝑆𝐵
𝑖=
𝑅𝑃
𝑖𝑇𝐴
Where is
𝑅𝑃
𝑖the number of samples detected by i-th malware and TA is the total number of application samples.3.3
Feature Selection With and Without
Actually, the count 134 android system permissions according to android 4.3 Jelly Bean with API level-18 considering all of android permissions as a feature set will produce an enormous feature vector for each application. So it is required to reduce the number of the application features, where the high -dimension data makes testing and training of general classification methods complicated.
The goal of data reduction is to find a minimum set of features such that the resulting probability distribution of the data classes is as close as possible to the original distribution obtained using all features. Using the reduced set of features has additional benefits. It reduces the number of features appearing in the discovered patterns, helping to make the patterns easier to be understood.
3.4
Characterization
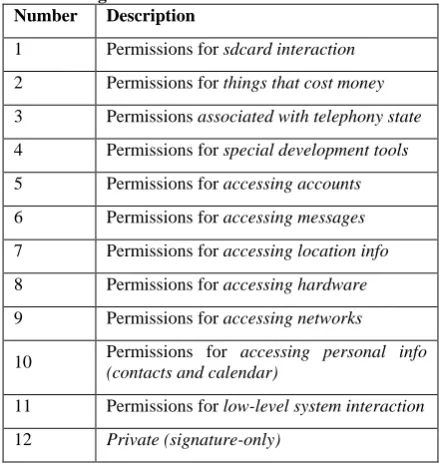
[image:3.595.318.538.526.758.2]Categorizing and classifying mobile applications according to their potential for privacy invasion provides detailed information about what is being put at risk by installing and agreeing to various permission and privilege requests by mobile applications. This categorization is based on the permissions requested by an application as a detail description in below.
Table 3. Categories of Permission Characterization Number Description
1 Permissions for sdcard interaction 2 Permissions for things that cost money 3 Permissions associated with telephony state 4 Permissions for special development tools 5 Permissions for accessing accounts 6 Permissions for accessing messages 7 Permissions for accessing location info 8 Permissions for accessing hardware 9 Permissions for accessing networks 10 Permissions for accessing personal info
(contacts and calendar)
11 Permissions for low-level system interaction 12 Private (signature-only)
Calculate Feature Score iteratively with different threshold
Accept & Extract Android Application Package
Extract Features from Manifest File
Select Features with High Score Score-Based Feature Selection
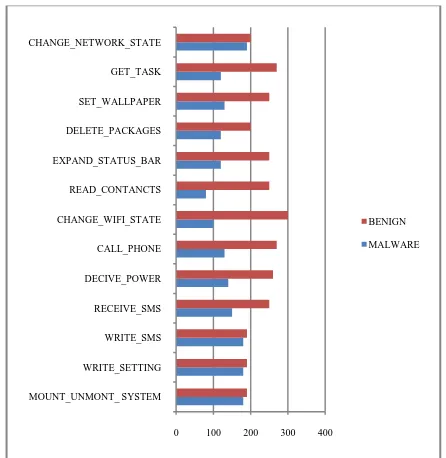
The Cantagio samples in our experiment comprised 12 different families as shown in Table 3 containing 1000 Android malware samples, but only 250 were used. The machine learning process had three phases: (1) data collection, which captured permission; (2) feature selection and extraction; and (3) the machine learning classifier. For the normal dataset, Application is selecting the top 20 free applications from Google Play as express in Figure 3.
[image:4.595.54.294.534.682.2]Fig 3. Top most request permissions for the applications
Figure 4 shows the top 20 permissions requested and required by both malicious and benign applications. Compare the results against their statistics, the top three requested permissions are the same. For malicious applications, the top three requested permissions are INTERNET, READ CONTACTS, and ACCESS NETWORK STATE. For benign applications, the top three requested permissions are CALL_PHONE, CHANGE_WIFI_STATE, and READ_PHONE_STATE. Although the number of malicious applications, the system evaluated is less than, the ranks of request permissions are similar.
Fig 4. Compare the accuracy result using 250 applications
Figure 4 shows the value of malware applications requesting certain number of permissions, respectively. It shows that the best result in Escofpriv of malware application requesting certain number of Risky3 permissions. It can be easily seen that lowest level of Escofpriv malware application at Risky1. Compare the categories of Risky2 level as the almost same
level of Risky3 malware detection characterization. Trajan, InfoSt, PreSMS and RootEx malware characterization are the low value of permits in usage level.
3.4.1
Categorization of Risky Permission
Permissions have different danger levels depending on the functions they allow the application to perform and are consequently classified in protection level groups. Likewise, through this attribute, it is possible to determine which applications have access to the permission:
Risk1: They pose a risky1 factor and typically only affect the application‟s scope. Risk1 permissions are granted by the system automatically without explicit approval of the user.
Risk2: They are risky2 permitted that allow costly access to services. The permissions can be granted by the user during installation. If the permit request is denied, then the application is not installed.
Risk3: They are risky3 permissions are only granted if the requesting application is signed by the same developer that defined the permissible. Risk3 permissions are useful for restricting component access to a small set of applications trusted and controlled by the developer.
3.4.2
Identification of Risky Permission
TROJAN pattern: ACCESS COARSE LOCATION, ACCESS FINE LOCATION, CALL PHONE, INTERNET, MOUNT UNMOUNT FILESYSTEMS, READ CONTACTS, READ PHONE STATE, SEND SMS, SET WALLPAPER, WRITE CONTACTS, WRITE EXTERNAL STORAGE.
The Trojan requests a rather distinct set of permissions, many of which are not often requested by legitimate applications. Using this pattern of the data set resulted in no hits from the legitimate markets, only the malicious data set.
ESCOFPRIV pattern: INTERNET, ACCESS NETWORK STATE, READ PHONE STATE, ACCESS WIFI STATE, WRITE EXTERNAL STORAGE, ACCESS COARSE LOCATION, ACCESS FINE LOCATION, RECEIVE SMS, SEND SMS, READ SMS, CALL PHONE, PROCESS OUTGOING CALLS, DELETE PACKAGES, INSTALL PACKAGES, RECEIVE BOOT COMPLETED.
This pattern returns only the Escofpriv samples malware from the malicious data set. Like the Trojan pattern, this pattern can almost uniquely identify Escofpriv infected applications. PREMSMS pattern: SEND SMS, READ SMS, WRITE SMS, RECEIVE SMS, DEVICE POWER, WRITE APN SETTINGS, ACCESS NETWORK STATE, BROADCAST PACKAGE REMOVED, ACCESS WIFI STATE, CHANGE WIFI STATE, WAKE LOCK, INTERNET, WRITE EXTERNAL STORAGE, READ PHONE STATE, KILL BACKGROUND PROCESSES.
PremSMS effectively mean that the malware can be uniquely identified based only on its permission set, this pattern is effective in determining the presence of this malware. INFOSTEAL pattern: READ CALENDAR, READ CONTACTS, READ USER DICTIONARY, WRITE CALENDAR, WRITE-CONTACTS, WRITE USER DICTIONARY, SET ALARM, READ HISTORY BOOKMARKS, WRITE HISTORY BOOKMARKS.
0 100 200 300 400
MOUNT_UNMONT_ SYSTEM WRITE_SETTING WRITE_SMS RECEIVE_SMS DECIVE_POWER CALL_PHONE CHANGE_WIFI_STATE READ_CONTANCTS EXPAND_STATUS_BAR DELETE_PACKAGES SET_WALLPAPER GET_TASK CHANGE_NETWORK_STATE
BENIGN
MALWARE
0 20 40 60 80 100
Trojan Esco InfoSt PreSMSRootEX
Usa
ge
Le
vel
Malware Dataset
Risky 1
Risky 2
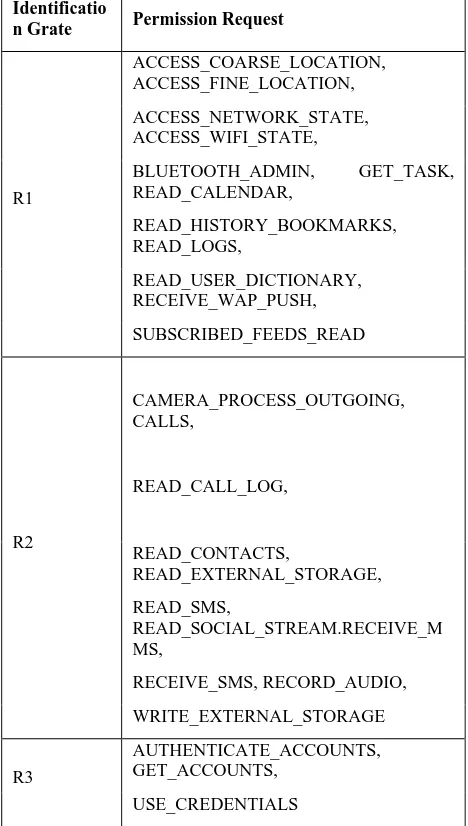
Table 4. Identification of Risky Assessment Identificatio
n Grate Permission Request
R1
ACCESS_COARSE_LOCATION, ACCESS_FINE_LOCATION, ACCESS_NETWORK_STATE, ACCESS_WIFI_STATE,
BLUETOOTH_ADMIN, GET_TASK, READ_CALENDAR,
READ_HISTORY_BOOKMARKS, READ_LOGS,
READ_USER_DICTIONARY, RECEIVE_WAP_PUSH, SUBSCRIBED_FEEDS_READ
R2
CAMERA_PROCESS_OUTGOING, CALLS,
READ_CALL_LOG,
READ_CONTACTS,
READ_EXTERNAL_STORAGE, READ_SMS,
READ_SOCIAL_STREAM.RECEIVE_M MS,
RECEIVE_SMS, RECORD_AUDIO, WRITE_EXTERNAL_STORAGE
R3
AUTHENTICATE_ACCOUNTS, GET_ACCOUNTS,
USE_CREDENTIALS
Infosteal pattern READ CONTACT PERMISSION, which means that it is install applications: Allows an application to read the user‟s contacts data.
ROOT EXPLOIT pattern: ACCESS NETWORK STATE, ACCESS WIFI STATE, BLUETOOTH, INTERNET, NFC, USE SIP, ACCOUNT MANAGER.
Using this pattern against the dataset resulted in 981 authorize applications identified as Root exploit.
For the purpose of these characterize, this system has not considered malicious applications caught by the pattern of another application as risky permission, as the intention is to find patterns which will catch as many malicious applications as possible.
Table 4 shows the requested permissions in the benign application and malware datasets. Risk level of identification grate R2: CAMERA has been the most frequently used permission by both the benign applications and malware. There are many reasons to request permission for picture access: some of the applications need to log in; some are designed to use the internet like browsers and email clients; some need to load an advertisement, etc.. As a result, Camera-related permissions, such as ACCESS NETWORK
STATE and ACCESS WIFI STATE, become very popular. Another set of widely used permissions is location related ones such as ACCESS FINE LOCATION and ACCESS COARSE LOCATION for location based services as defined on the grate level of R1, etc.
Table 5. Categorization of Permission Risky
Data Category
Data Usag e
Permission Request
Private Threat
R1 R
2 R 3
Sensor/L ocation
Loca tion
Audi o
Vide o
ACCESS_COARS E_LOCATION
ACCESS_FINE_L
OCATION
BLUETOOTH_A
DMIN
ACCESS_NETW
ORK_STATE
ACCESS_WIFI_S
TATE
READ_SOCIAL_
STREAM
RECORD_AUDIO
CAMERA
External Storage
WRITE_EXTENA
L_STORAGE
READ_EXTERN
AL_STORAGE
Commun SMS
MM
RECEIVE_SMS
[image:5.595.50.284.84.497.2]ication
S
Voic e
Wap Push
RECEIVE_MMS
PROCESS_OUTG
OING_CALLS
RECEIVE_WAP_
PUSH
Another observation is that some applications of permissions are requested by such malware applications in the Cantagio dataset. Malware is more favor of changing the settings and use money-related services such as short message service (SMS). Changing settings, especially changing the network settings, have generally been the first step before a malware performs any malicious activity. Sometimes malware even try to kill background processes, which could help them avoid being detected by anti-virus applications.
Characterization system can see that the usage pattern of SMS related permissions is quite different between the benign applications and the malware applications and many malware applications attempt to request SMS related permissions. SMS is also a risky permission of private threat (Risk3) that is more likely requested by malware applications. Describe the data usage of SMS include the data category of communication as shown in Table 5.
4.
CONCLUSION
Mobile malware performs malicious activities like stealing confidential information, sending messages, SMS, reading contacts and can even harm by exploiting the data. Malware is spreading around the world and infecting not only for end users, but also for large organizations and service providers. Malware classification is a vital component and works together with malware identification to prepare the right and effective malware antidote.
In this research, malware classification and analysis have been used to determine whether a program has malicious intent or not. In this study, collected Android applications have been classified using machine learning approaches, whether they are malware or benign. Static approach has been used to classify and detect malware. Several permission features from several manifest files have been extracted. A score-based feature selection approaches, which is only based on manifest file analysis have been proposed and evaluated as a lightweight approach for malware detection. And then, the selected malware is detected using different classifier. According to the experimented consequences, the proposed score-based feature selection has been performed similarly with existing feature selection methods. (Correlation-based and Information Gain). Moreover, by using static-based malware approach, it is more efficient and adaptable because the static approach has the advantages of less cost rather than a dynamic approach.
Therefore, the proposed approach using permissions are effective for malware detection, which achieved an average rate of malware detection accuracy. Not only malware classification, but also malware characterization is also important to inform the user and install the malware application, because the user is not aware to install several applications of their device. The Android application requires several permissions to work. An essential step to install an Android application into a mobile device is to allow all permissions requested by the application.
In this work, malware detection system has been provided a systematic study on the exploration of permission-induced risk in Android apps on a large-scale in three levels. First, the research has been focused on ranking all the individual permissions request by using three methods. Second, the research has been identified the subsets of top most permissions with sequential forward selection as well as with score-based. And then, the evaluation of this system has been employed several algorithms, BN, MLP, J48, KNN and RF, to detect malware applications based on the identified subsets of exploiting permissions. The design also constructs top most demand sets with feature ranking to detect malware applications with different characteristics. The large official application data set consisting of 1000 benign applications and 981 malware applications, as well as a third-party application set have been used for the evaluation.
The focus of this research is tantamount to design a simple and easy-to-evaluate framework for analyzing mobile privacy. Categorizing and classifying mobile applications according to their potential for privacy invasion provides detailed information about what is placed at risk by installing and agreeing to various permission and privilege requests by mobile applications. This categorization has been based on the permissions requested by an application. Malware detection has been discussed and analyzed in depth the effectiveness as well as the limitations on the detection of malware applications with only permission requests. While the permission requests characterized the behaviors of apps to a certain extent and the detection can be effective, only considering the permissions would have difficulties to improve the current detection accuracy, as the permission vectors are very sparse and binary number type. The results obtained from a user training, test using five selected classifiers to perform the experiments have been presented in Appendix A. The table showed the performance of each classifier in ten (100 and 1000 applications) experimental sets for malware detection. Classifier performance has been needed to be measured with five evaluation metrics, namely TPR, FPR, precision, recall and f-measure.
The results of the average error rates and accuracy of different feature sets with and without category information have been compared. The description has been observed that an increasing accuracy and decreasing error rates when larger numbers of features are utilized to train the classifier. It was also clear that by exploiting the category information; there was a clear improvement in the accuracy and error rates. Also, note that there was almost a difference of 86%, 95% in the performance using with and without feature sets indicating the importance of feature ranking based on the frequency of permission request.
only one difference permission of score-based on the ranking results was set in boldface.
According to the classification results, the classification of top most requests FSI uses 1000 applications has been demonstrated that the classifier Bayes network has been produced a higher FPR result with 0.39% compared to the k-nearest neighbor in 0.112%.This has been indicated that the Bayes network was less effective than other selected classifier for malware detection.
From the classification of top most requests FSII uses 1000 samples in the current result, the J48 classifier has been achieved 87% and RF has been achieved 92% detection rate accuracy. Whereas the highest detection rate attained in this research was 87% with the KNN classifier. Therefore, the observed results indicate the comprehensiveness and efficiency of this study.
5.
FUTURE WORK
The current work discusses and analyzes in depth the effectiveness as well as the limitations on the detection of malware applications with only permission requests. While the permission requests characterize the behaviors of applications to a certain extent and the detection can be effective, only considering the permissions would have difficulties to improve the current detection accuracy, as the permission vectors are very sparse and binary number. In the future work, there are exploring more relevant features that inherit in application in order to improve the detection accuracy of Android malware application.
6.
REFERENCES
[1] K. Allix, T. F. D. A. Bissyande, J. Klein, and Y. Le Traon, “Machine Learning-Based Malware Detection for Android Applications: History Matters!,” 2014.
[2] D. Arp, M. Spreitzenbarth, M. H¨ubner, H. Gascon, K. Rieck, and C. Siemens, “DREBIN: Effective and Explainable Detection of Android Malware in Your Pocket,” 2014.
[3] Z. Aung and W. Zaw, “Permission-based android malware detection,” International Journal Of Scientific & Technology Research, vol. 2, no. 3, 2013.
[4] G. Canfora, F. Mercaldo, and C. A. Visaggio, “A classifier of malicious android applications,” in Availability, Reliability and Security (ARES), 2013 Eighth International Conference on, pp. 607–614, IEEE, 2013.
[5] W. Enck, M. Ongtang, and P. McDaniel, “On lightweight mobile phone application certification,” in Proceedings of the 16th ACM conference on Computer and communications security, pp. 235–245, ACM, 2009. [6] L. Gomez and I. Neamtiu, “A Characterization of
Malicious Android Applications,” tech. rep., Technical report, University of California, Riverside, 2011. [7] M. Grace, Y. Zhou, Q. Zhang, S. Zou, and X. Jiang,
“Riskranker: scalable and accurate zero-day android malware detection,” in Proceedings of the 10th international conference on Mobile systems, applications, and services, pp. 281–294, ACM, 2012 [8] C.-Y. Huang, Y.-T. Tsai, and C.-H. Hsu, “Performance
Evaluation on Permission-Based Detection for Android Malware,” in Advances in Intelligent Systems and Applications-Springer, 2013.Volume 2, pp. 111–120
[9] T.M. Mitchell. Machine Learning. McGraw-Hill Series in Computer Science.McGraw-Hill, 1997.
[10]C. Orthacker, P. Teufl, S. Kraxberger, G. Lackner, M. Gissing, A. Marsalek, J. Leibetseder, and O. Prevenhueber, “Android security permissions–can we trust them?,” in Security and Privacy in Mobile Information and Communication Systems, pp. 40–51, Springer, 2012.
[11]B. Sanz, I. Santos, C. Laorden, X. Ugarte-Pedrero, and P. G. Bringas, “On the automatic categorization of android applications,” in Consumer Communications and Networking Conference (CCNC), 2012 IEEE, pp. 149– 153, IEEE, 2012.
[12]B. Sanz, I. Santos, C. Laorden, X. Ugarte-Pedrero, J. Nieves, P. G. Bringas, and G. A´ lvarez Maran˜o´n,“MAMA: Manifest Analysis for Malware Detection in Android,” Cybernetics and Systems, vol. 44,no. 6-7, pp. 469–488, 2013
[13]B. Sanz, I. Santos, C. Laorden, X. Ugarte-Pedrero, P. G. Bringas, and G. A´ lvarez, “Puma: Permission usage to detect malware in android,” in International Joint Conference CISIS12-ICEUTE´ 12-SOCO´12 Special Sessions, pp. 289–298, Springer, 2013.
[14]B.P. Sarma, N. Li, C. Gates, R. Potharaju, C. Nita-Rotaru, and I. Molloy, “Android permissions: a perspective combining risks and benefits,” in Proceedings of the 17th ACM symposium on Access Control Models and Technologies, pp. 13–22, ACM, 2012.
[15]R. Sato, D. Chiba, and S. Goto, “Detecting Android Malware by Analyzing Manifest Files,” Proceedings of the Asia-Pacific Advanced Network, vol. 36, pp. 23–31, 2013.
Appendix A
Description of Top Most Result Ranker from 100 Applications to 1000 Applications
(For FSI)
Classifier (100) BN ML
P J48
KN
N RF
TP Rate
Informati
on Gain 0.82 0.96 0.92 0.94 0.94
Score-Based 0.82 0.9 0.84 0.92 0.96
Correlatio
n-Based 0.82 0.96 0.92 0.94 0.96
FP Rate
Informati
on Gain 0.44 0.06 0.1 0.02 0.02
Score-Based 0.22 0 0.1 0 0.06
Correlatio
n-Based 0.44 0.06 0.08 0 0.04
Precisio n
Informati on Gain
0.65 1
0.94 1
0.90 2
0.97 9
0.97 9
Score-Based
0.78
8 1
0.89
4 1
0.94 1
n-Based 1 1
Recall
Informati
on Gain 0.82 0.96 0.92 0.94 0.94
Score-Based 0.82 0.9 0.84 0.92 0.96
Correlatio
n-Based 0.82 0.96 0.92 0.94 0.96
F-Measur e Informati on Gain 0.72 6 0.95
0.91 1 0.95 9 0.95 9 Score-Based 0.80 4 0.94 7 0.86 6 0.95 8 0.95
Correlatio n-Based
0.72
6 0.95 0.92 0.96 9 0.96
Accura cy %
Informati
on Gain 69 95 91 96 96
Score-Based 80 95 87 96 95
Correlatio
n-Based 69 95 92 97 96
Classifier (1000) BN ML
P J48
KN
N RF
TP Rate Information Gain 0.8 28 0.6 96 0.8 4 0.8 18 0.8 74
Score-Based 0.5
58 0.8 04 0.8 16 0.8 64 0.8 96 Correlation-Based 0.8 28 0.7 72 0.8 4 0.8 18 0.8 72 FP Rate Information Gain 0.6 74 0.1 72 0.3 36 0.2
0.2 6
Score-Based 0.3
9 0.1 72 0.2 12 0.1 12 0.1 44 Correlation-Based 0.6 74 0.2 7 0.3 36 0.2
0.2 58 Precisio n Information Gain 0.5 51 0.8 02 0.7 14 0.8 04 0.7 71
Score-Based 0.5
89 0.8 24 0.7 94 0.8 85 0.8 62 Correlation-Based 0.5 51 0.7 41 0.7 14 0.8 04 0.7 72 Recall Information Gain 0.8 28 0.6 96 0.8 4 0.8 18 0.8 74
Score-Based 0.5
58 0.8 04 0.8 16 0.8 64 0.8 96 Correlation-Based 0.8 28 0.7 72 0.8 4 0.8 18 0.8 72 F-Measure Information Gain 0.6 62 0.7 45 0.7 72 0.8 11 0.8 19
Score-Based 0.5
73 0.8 14 0.8 05 0.8 74 0.8 78 Correlation-Based 0.6 62 0.7 56 0.7 72 0.8 11 0.8 19 Accurac y % Information
Gain 57 76 75 80 80
Score-Based 58 82 80 88 88
Correlation-Based 57 75 75 80 80
Description of Top Most Result Ranker from 100 Applications to 1000 Applications
(For FSII)
Classifier (100) BN ML
P J48
KN
N RF
TP Rate Information Gain 0.8 2 0.9 4 0.9 2 0.9 4 0.9 4
Score-Based 0.8
8 0.9 6 0.9 6 0.9 8 0.9 8 Correlation-Based 0.8 2 0.9 8 0.9 2 0.9 6 0.9 8 FP Rate Information Gain 0.4 4 0.0 6 0.0 8 0.0 2 0.0 4
Score-Based 0.3 0.0 4
0.0
4 0 0
Correlation-Based 0.4 4 0.0 2 0.0 6 0
0.0 4 Precisio n Information Gain 0.6 51 0.9 4 0.9 2 0.9 79 0.9 59
Score-Based 0.7
46 0.9 6
0.9
6 1 1
Correlation-Based 0.6 51 0.9 8 0.9 39 1
0.9 61 Recall Information Gain 0.8 2 0.9 4 0.9 2 0.9 4 0.9 4
Score-Based 0.8
8 0.9 6 0.9 6 0.9 8 0.9 8 Correlation-Based 0.8 2 0.9 8 0.9 2 0.9 6 0.9 8 F-Measure Information Gain 0.7 26 0.9 4 0.9 2 0.9 59 0.9 49
Score-Based 0.8
07 0.9 6 0.9 6 0.9 9 0.9 9 Correlation-Based 0.7 26 0.9 8 0.9 29 0.9 8 0.9 7 Accurac y % Information
Gain 69 94 92 96 95
Score-Based 79 96 96 99 99
Classifier (1000) BN ML
P J48
KN
N RF
TP Rate Informati on Gain 0.82 8 0.95 8 0.88
0.91 6 0.94 2 Score-Based 0.82 8 0.91 8 0.89 4 0.89 2 0.94 2 Correlatio n-Based 0.82 8 0.93 6 0.83 4 0.89 8 0.93
FP Rate Informati on Gain 0.67 4 0.11 2 0.16
0.04 6 0.07 4 Score-Based 0.67 4 0.08 4 0.14 8 0.04 8 0.09 8 Correlatio n-Based 0.67 4 0.09 8 0.14
0.10 2 0.08 2 Precisio n Informati on Gain 0.55 1 0.89 5 0.84 6 0.95 2 0.92 7 Score-Based 0.55 1 0.91 6 0.85 8 0.94 9 0.90 6 Correlatio n-Based 0.55 1 0.93 6 0.85 6 0.90 3 0.91 9 Recall Informati on Gain 0.82 8 0.95 8 0.88
0.91 6 0.94 2 Score-Based 0.82 8 0.91 8 0.89 4 0.89 2 0.94 2 Correlatio n-Based 0.82 8 0.93 6 0.83 4 0.95 2 0.93
F-Measur e Informati on Gain 0.66 2 0.92 6 0.86 3 0.93 4 0.93 5 Score-Based 0.66 2 0.91 7 0.87 6 0.92
0.92 4
Correlatio n-Based
0.66 2 0.92
0.84 5 0.92 7 0.92 4 Accura cy % Informati
on Gain 57 92 86 93 93
Score-Based 58 92 87 92 92
Correlatio
n-Based 57 91 84 92 92
Description of Top Most Result Ranker from 100 Applications to 1000 Applications
(For FSIII)
Classifier (100) B
N ML
P J48
KN
N RF
TP Rate Informati on Gain 0. 82 0.9 6 0.9 4 0.9 4 0.94
Score-Based 0. 76 0.9 8 0.9 8 0.9 8 0.98
Correlatio n-Based 0. 82 0.9 8 0.9 2 0.9 8 0.98
FP Rate Informati on Gain 0. 44 0.0 6 0.0 8 0.0 2 0.04
Score-Based 0. 16 0.0 4 0.0 4 0.0 4 0.04
Correlatio n-Based 0. 44 0.0 2 0.0
6 0 0.02
Precisi on Informati on Gain 0. 65 1 0.9 41 0.9 22 0.9 79 0.95 9 Score-Based 0. 82 6 0.9 61 0.9 61 0.9 61 0.96 1 Correlatio n-Based 0. 65 1 0.9 8 0.9
39 1 0.98
Recall Informati on Gain 0. 82 0.9 6 0.9 4 0.9 4 0.94
Score-Based 0. 76 0.9 8 0.9 8 0.9 8 0.98
Correlatio n-Based 0. 82 0.9 8 0.9 2 0.9 8 0.98
F-Measu re Informati on Gain 0. 72 6 0.9 5 0.9 31 0.9 59 0.94 9 Score-Based 0. 76 0.9 7 0.9 7 0.9 7 0.97
Correlatio n-Based 0. 72 6 0.9 8 0.9 29 0.9 9 0.98
Accura cy %
Informati
on Gain 69 95 93 96 95
Score-Based 80 97 97 97 97
Correlatio
n-Based 69 98 93 99 98
Classifier (1000) BN MLP J48 K N N R F TP Rate Information
Gain 0.828 0.98 0.896
0. 94 8 0. 96 6
Score-Based 0.828 0.918 0.894 0. 89 2 0. 94 2
Correlation-Based 0.828 0.966 0.912
0. 93 8 0. 97 4 FP Rate Information
Gain 0.674 0.066 0.132
0. 03
0. 04 8
Score-Based 0.674 0.084 0.148 0. 04 8 0. 09 8
Correlation-Based 0.674 0.062 0.15
0. 03 0. 07 Precision Information
Gain 0.551 0.937 0.872
0. 96 9 0. 95 3
Score-Based 0.551 0.916 0.858 0. 94 9 0. 90 6
9 3
Recall
Information
Gain 0.828 0.98 0.896
0. 94 8 0. 96 6
Score-Based 0.828 0.918 0.894 0. 89 2 0. 94 2
Correlation-Based 0.828 0.966 0.912
0. 93 8 0. 97 4 F-Measure Information
Gain 0.662 0.958 0.884
0. 95 9 0. 95 9
Score-Based 0.662 0.917 0.876 0. 92
0. 92 4
Correlation-Based 0.662 0.953 0.885
0. 95 3 0. 95 3 Accuracy % Information
Gain 57 95 88 95 95 Score-Based 58 92 87 87 92
Correlation-Based 57 95 88 95 95
Description of Top Most Result Ranker from 100 Applications to 1000 Applications
(For Score-Based)
Classifier (100) BN ML
P J48
KN
N RF
TP Rate
Informati
on Gain 0.82 0.94 0.96 0.94 0.94
Score-Based 0.84 0.96 0.98 1 1
Correlatio
n-Based 0.82 0.98 0.94 0.98 0.98
FP Rate
Informati
on Gain 0.44 0.04 0.1 0.02 0.04
Score-Based 0.24 0.02 0.06 0.02 0.02
Correlatio
n-Based 0.18 0.02 0.08 0 0.02
Precisio n Informati on Gain 0.65 1 0.95 9 0.90 6 0.97 9 0.95 9 Score-Based 0.77 8 0.98
0.94
2 0.98 0.98
Correlatio n-Based
0.75 7 0.98
0.92
2 1 0.98
Recall
Informati
on Gain 0.82 0.94 0.96 0.94 0.94
Score-Based 0.84 0.96 0.98 1 1
Correlatio
n-Based 0.56 0.98 0.94 0.98 0.98
F-Measur e Informati on Gain 0.72 6 0.94 9 0.93 2 0.95 9 0.94 9 Score-Based 0.80 8 0.97
0.96
1 0.99 0.99
Correlatio n-Based
0.64 4 0.98
0.93
1 0.99 0.98
Accura cy %
Informati
on Gain 69 95 93 96 95
Score-Based 80 97 97 99 99
Correlatio
n-Based 69 98 93 99 98
Classifier (1000) BN ML
P J48
KN
N RF
TP Rate Information Gain 0.8 28 0.9 78 0.8 92 0.9 48 0.9 48
Score-Based 0.8
28 0.9 88 0.8 7 0.9 54 0.9 74 Correlation-Based 0.8 42 0.8 72 0.9 64 1
0.9 12 FP Rate Information Gain 0.6 74 0.0 52 0.0 82 0.0 06 0.0 06
Score-Based 0.6
74 0.0 48 0.1 04 0.0 1 0.0 32 Correlation-Based 0.1 82 0.0 7 0.1 94 0.1 98 0.1 1 Precisio n Information Gain 0.5 51 0.9 5 0.9 16 0.9 94 0.9 94
Score-Based 0.5
51 0.9 54 0.8 93 0.9 9 0.9 68 Correlation-Based 0.8 22 0.9 26 0.8 32 0.8 35 0.8 92 Recall Information Gain 0.8 28 0.9 78 0.8 92 0.9 48 0.9 48
Score-Based 0.8
28 0.9 88 0.8 7 0.9 54 0.9 74 Correlation-Based 0.8 42 0.8 72 0.9 64 1
0.9 12 F-Measure Information Gain 0.6 62 0.9 64 0.9 04 0.9 7 0.9 7
Score-Based 0.6
62 0.9 71 0.8 81 0.9 71 0.9 71 Correlation-Based 0.8 32 0.8 98 0.8 93 0.9 1 0.9 02 Accurac y % Information
Gain 57 96 90 97 97
Score-Based 57 97 88 97 97
Description of Accuracy Results of FSI and FSII (Compare 100 to 1000 Application)
100
Inform
ation
Ga
in
Score
-Based
Corre
lation
-Bas
ed
100
Inform
ation
Ga
in
Score
-Based
Corre
lation
-Bas
ed
BN 69 80 69 BN 69 79 69
MLP 95 95 95 MLP 94 96 98
J48 91 87 92 J48 92 96 93
KN
N 96 96 97
KN
N 96 99 98
RF 96 95 96 RF 95 99 97
100
0
Informati
on
G
ai
n
Score
-Ba
se
d
Correl
at
ion
-Ba
sed
100
0
Informati
on
G
ai
n
Score
-Ba
se
d
Correl
at
ion
-Ba
sed
BN
57
58
57
BN
57
58
57
ML
P
76
82
75
ML
P
92
92
91
J48
75
80
75
J48
86
87
84
KN
N
80
88
80
KN
N
93
92
92
RF
80
88
80
RF
93
92
92
Description of Accuracy Results of FSIII and Score-Based (Compare 100 to 1000 Application)
100
Inform
ation
Ga
in
Score
-Based
Corre
lation
-Bas
ed
100
Inform
ation
Ga
in
Score
-Based
Corre
lation
-Bas
ed
BN 69 80 69 BN 69 80 69
MLP 95 97 98 MLP 95 97 98
J48 93 97 93 J48 93 97 93
KN
N 96 97 99
KN
N 96 99 99
RF 95 97 98 RF 95 99 93