Munich Personal RePEc Archive
Eurasia Integration Index
Gharleghi, Behrooz
DOC Research Institute
2 May 2019
1
May 2019
Eurasia Integration Index
Behrooz Gharleghi
Dialogue of Civilizations Research Institute, Berlin, Germany Email: [email protected]
1. Introduction
Economic integration is a process that aims to reduce barriers that exist in economic, social, and
cultural affairs between countries. Integration in its current format has risen significantly since the
1980s, when several trade agreements were made to facilitate collaboration between developed
and developing countries. However, there is a need to measure outcomes and understand the
phenomena of integration in various respects besides the economic perspective.
The idea of tighter economic integration in Eurasia is gaining attraction, largely based on the
experiences of other regional economic integration projects, such as NAFTA, the EU, CEMAC,
and ASEAN. The economic integration of Eurasian states has been an issue for policymakers over
the last two decades. Efforts have been made to promote initiatives to integrate these countries
through creating a custom union and facilitating labour and capital mobility, but so far there has
not been any attempt to coordinate the monetary policies. The region of Eurasia which is going to
be analysed in this project includes thirteen states: Armenia, Azerbaijan, Belarus, Georgia,
Kazakhstan, Kyrgyzstan, Moldova, Mongolia, Russia, Tajikistan, Turkmenistan, Ukraine, and
Uzbekistan. This definition of Eurasia is very similar to the definition of OECD’s classification of
Eurasia1.
The treaty on the establishment of the Eurasian Economic Union (EAEU) was signed in 2000. A
customs union was initiated in 2010 and the Single Economic Space between Russia, Belarus, and
Kazakhstan was established in 2012. In January 2015, the Eurasia Economic Union came into
force. Expansion in the EAEU paves the way for a better policy coordination among the members.
Individual countries are vulnerable to the external shocks while an economic union could tolerate
2
the shocks with less fluctuations in the economy. In the case of the EAEU, so far there is no
monetary policy coordination among the member states that could be the next plan of action for
closer integration to look into the possibilities of monetary policy coordination. One of the most
important aspects of monetary integration is that the resulting monetary policies can better manage
aggregate demand and promote investment throughout the region. Coordinated monetary policies
promote trade and investment in the region (Mundell, 1961). In this research project, some aspects
of monetary integration will be investigated through macroeconomic shocks.
From the perspective of monetary integration, EAEU member states might be vulnerable to
external shocks – global and regional – and hence could face severe fluctuations in the value of
their currencies during global economic downturns. Therefore, a highly integrated region would
be better able to withstand crisis as the size of the economy will be bigger. In addition, the Eurasian
region has the potential to be the world’s leading supplier of raw materials, goods, and services,
and also a transit corridor for ‘China-Europe’. Defining an index of integration would there help
to show how close these economies are in reality and what should be the next step for further
integration.
The core idea of this project is to assess the level of integration among the members of the Eurasia
region. The integration index of the EAEU members will also be calculated to see the outcomes
of having economic ties on the overall index. In the current global order, multilateralism is a focal
point for (mostly) non-Western countries, meaning that the integration of economies seems
inevitable. The rise of China is an opportunity for neighbouring countries to be economically and
politically linked to China. Linking smaller economies – such as former Soviet states – to the
Chinese economy could lead to a bigger role for them in the new world order. Hence, besides the
main objective of the research, which is to define an integration index, a supplementary goal is
also to measure how integrated the Chinese economy is with this region.
However, developing an index for such a diverse group of economies – which vary in terms of
size, economic systems, political orientation, and level of development – poses a challenge. Based
on the outcomes and procedures of the previously developed indices, we adopt similar dimensions
3
The dimensions for the Eurasia Regional Economic Integration (ERII) used in this study are listed
below and some of them have been similarly used in other indices such as Integration Index for
Latin America and the Caribbean (IINTALC) and Asia-Pacific Regional Cooperation and
Integration Index (ARCII):
i) Institutional integration
ii) Social integration
iii) Trade and investment integration
iv) Monetary and macroeconomic integration
v) Infrastructure integration
Many efforts have been made to facilitate the integration issues within the Eurasian region. The
formation of the EAEU, the Eurasia Economic Commission (EEC), the Eurasian Development
Bank (EADB), and the Single Economic Space (SES) are some examples that have facilitated the
collaboration process since the 1990s. Many scholars have studied this region, mostly from a
political perspective, and to some extent from a socio-economic perspective. The ERII index
would be the first attempt to measure the level of real cooperation among these economies by
providing evidence that helps: (i) to see how successful previous integration efforts have been; and
(ii) to suggest the strengths and weaknesses of the integration process in the region. Previous
studies have mainly addressed Russia as the regional power in the formation of the Eurasian
Economic Union and have raised concerns that the sovereignty of smaller economies could be
affected by Russia, but this seems not to be the case, as other regional economies, such as China
and India, are also increasing their economic ties with neighbouring countries2. The idea of the
Eurasian Economic Union seems to be a platform that facilitates and enhances regional
cooperation among all countries in the region.
The integration of Eurasian (EA) economies seems inevitable. With the rapid economic expansion
of China and India, there is a growing demand to improve connections between Europe and Asia.
The current status quo of the rising world in the East provides an opportunity for EA countries to
2
4
emerge as a hub for finance, goods, and services, in order to help them achieve rates of higher
economic growth.
There have been some attempts to review the level of integration among these economies,
including efforts by the Eurasian Development Bank research group (EABR, 2017). However,
previous reviews have not established an index that is able to cover the major elements of
integration among these countries such as, institutional integration, social integration,
macroeconomic integration, trade and investment integration, and infrastructure integration. This
research project would therefore represent a benchmark tool for integration in this region. This
benchmark would then be helpful to measuring the level of integration with other neighbouring
countries such as China, India, and Turkey.
Regional cooperation is a dynamic process that fosters collaboration in different economic and
social areas, which eventually leads to shared prosperity and economic growth. The Eurasian
Economic Commission (EEC) is a regional platform to scale up the level of connectivity and
cooperation among the member states. The main purpose of the EEC is to ensure that the region
will be further integrated.
The Eurasia Regional Economic Integration (ERII) is an attempt to quantify the level of regional
integration and cooperation in terms of five socioeconomic dimensions, from trade to
infrastructure, with an objective to identify triggers, drivers, and policy measures to augment the
cooperation process. The ERII index aims to provide a scale for both private and public
stakeholders, including policymakers and decision-makers, in order to assess the state of
integration in each area, identify gaps, and suggest measures for a targeted strategy or an action
plan to foster the regional cooperation process among Eurasian countries. Despite the constraints
involved in constructing an index of this kind, the ERII provides dynamic analysis of five
dimensions: institutional, social, macroeconomic, trade & investment, and infrastructure. It does
this for each of the Eurasian countries for the period from 1991 to 2018. Regional integration is
not an objective per se, but a tool to achieve economic development and reduce poverty. The ERII
will add values, focus on the Eurasian countries, and will improve regional cooperation by
introducing a set of dimensions and indicators that reflect the evolution of the state of EA
5
to identify weak areas that need attention from policymakers. In constructing the index, size and
scale asymmetries between EA countries require different treatment for crisis-vulnerable and
landlocked countries in the region.
2. Scope of project
Regional integration and cooperation play a vital role in alleviating poverty, fostering economic
growth, raising productivity, boosting employment in various sectors, increasing efficiency, and
creating investment opportunities. This is shown by previous examples of regional integration
indices, which have been developed by different institutions for different regions. One of these is
the Asia Pacific Regional Cooperation and Integration Index (ACRII), which was developed by
the Asian Development Bank Institute for 2016 and 2018; Africa Regional Integration Index
(ARII) 2016, and Integration Index for Latin America and the Caribbean (IINTALC) 2016.
The Africa Regional Integration Index (ARII) was developed by the African Union Commission
(AUC) and the African Development Bank (AfDB), of which the latest issue was in 2016. The
index is comprised of five dimensions: regional infrastructure; Trade integration; productive
integration; free movement of people; and financial and macroeconomic integration. An
integration index for Latin America and the Caribbean has been developed by the Latin American
and Caribbean Economic System (SELA, 2016) and is comprised of five dimensions: a political
dimension with six indicators; an environmental dimension with four indicators; a cultural
dimension with six indicators; a social dimension with thirteen indicators; and an economic
dimension with eleven indicators.
Another example is the Five Connectivity Index from the Belt and Road Initiative (2019). This
index has mainly focused on the five connectivity elements of policy coordination, facilities
connectivity, unimpeded trade, financial integration, and people-to-people bonds. The coverage of
this index includes Southeast Asia, South Asia, Central Asia, West Asia, North Africa, Europe,
and Oceania, which covers 94 countries along the ‘Belt and Road’ in total. This index ranges
between 0 and 100, divided into five categories; namely “countries of smooth
cooperation” (scoring 70 and above); “connected countries” (scoring 60 to 69); “countries of good
6
“countries of weak cooperation” (scoring below 40). This index ranks countries based on their connectivity to the Belt and Road from 1 to 94. Based on the results, Russia ranked first and Syria
and Yemen ranked last. However, the average connectivity score is 55.25, which actually indicates
“good cooperation”.
The European example of such index is called EU-25 Index that has the following dimensions and
indicators;
No Dimensions Indicators
1 Single market EU openness
o Trade in goods (sum of intra-European imports and exports of goods in %GDP)
o Trade in services (sum of intra-European imports and exports of services in %GDP)
o Capital movement (sum of intra-European stocks (inward and outward) of FDI in %GDP)
o Labor migration (European employees in % of total employment (ILO definition).
EU importance
o Trade in goods (sum of intra-European imports and exports of goods in % of total trade in goods)
o Trade in services (sum of intra-European imports and exports of services in % of total trade in services)
o Capital movement (sum of intra-European stocks (inward and outward) of FDI in % of total FDI
o Labor migration (European employees in % of total foreign employees – ILO definition).
2 EU
Homogeneity
o Per capita income (PPP GDP per capita in relation to the respective EU average)
o Purchasing power standard
o Labor cost (labor cost per hour (wage cost and payroll cost for
manufacturing sector and for companies with 10 or more employees, in PPP)
o Long-term interest rate (according to the Maastricht (10-year government bond) in relation to the respective EU average.
o Public debt ratio (gross gov. debt in %GDP in relation to the respective EU average)
o Consumer tax rate (implicit tax rate on consumption (consumption tax revenue in relation to private consumption spending) in relation to the respective EU average
o Capital tax rate (implicit tax rate on capital (tax rate on private property and company profits in relation to total profit and investment income of private households and companies) in relation to the respective EU average. 3 EU Symmetry o Economic growth(real GDP at current prices (2005=100), %change to the
previous quarter, trend and seasonally adjusted, in pairwise correlation to the respective EU quarterly average
o Inflation (Harmonized CPI, %change to the previous quarter, trend and seasonally adjusted, in pairwise correlation to the respective EU quarterly average)
o Change in unemployment (unemployment rate (ILO), %change to the previous quarter, trend and seasonally adjusted, in pairwise correlation, to the respective EU quarterly average.
7
4 Institutional Conformity
EU participation
o EMU membership (EMU members=100, ERM II = 50, flexible EXR towards EMU =0).
o Schengen participation EU compliance
o Infringement proceedings
o ECJ verdict: Single Market
o ECJ verdict: Environment and consumer protection
o ECJ verdict: Other sectors Source: http://www.eu-index.uni-goettingen.de/?page_id=231
Following the earlier reports on regional integration, this study tries to utilise various techniques
to produce a Regional Integration Index for Eurasia for the first time. This region operates as a
gateway for Asia to the European market and also for European firms to access Asian customers.
The project proposed here will analyse the five aspects of integration using different statistical
tools. For example, in terms of monetary and financial integration, the correlation of supply shocks
will be utilised using a vector autoregressive model. Additional technical analyses –Impulse
Response Function, and Variance Decomposition analysis – will be carried out to identify the size
and root cause of the variability in monetary and financial factors in order to gain insight for further
integration. These two tests are good enough to measure monetary and financial integration within
these countries. This would mainly be done based on long-term co-integration among macro
variables within the context of Eurasian countries. In this regard, we mainly focus on the output
levels of these economies, which can provide evidence of any possible long-term correlation
between economies.
The financial crisis of 2014 in Russia, in addition to the 1998 crisis, has encouraged regional
cooperation among the countries of Eurasia. Possible monetary coordination among these
countries could lead to an increase in trade and investment. Such an increase will have two
dynamic effects: first, it will lead to higher GDP; and second, the business cycle of member states
will become more synchronised (Baldwin and Seghezza, 1996). The expansion of trade also makes
it easier to pursue a common monetary policy. It is also concluded in the literature that the close
correlation of business cycles in Russia, Kazakhstan, and Tajikistan reduces the cost of a single
8 3. Methodology
This research is motivated by the formation of other regional indices such as ARCII (2018),
IINTALC (2016), ARII (2016); and the Five Connectivity Index of the Belt and Road Initiative
(2019).
The ARCII countries are: Armenia, Azerbaijan, Georgia, Kazakhstan, the Kyrgyz Republic,
Tajikistan, Turkmenistan, Uzbekistan (eight economies of Central Asia); Hong Kong, China,
Japan, the Republic of Korea, Mongolia, Taiwan (six economies of East Asia); Brunei Darussalam,
Cambodia, Indonesia, Lao PDR, Malaysia, Myanmar, Philippines, Singapore, Thailand, Vietnam
(ten economies of Southeast Asia); Afghanistan, Bangladesh, Bhutan, India, the Maldives, Nepal,
Pakistan, Sri Lanka (eight economies of South Asia); the Cook Islands, Fiji, Kiribati, the Marshall
Islands, the Federated States of Micronesia, Nauru, Palau, Papua New Guinea, Samoa, the
Solomon Islands, Timor-Leste, Tonga, Tuvalu, Vanuatu (14 economies of the Pacific); and
Australia and New Zealand (two economies of Oceania).
The five connectivity Index comprises of 94 countries across several continents.
The Eurasia Regional Integration Index (ERII) will consider the twelve economies of Eurasia (all
thirteen members except of Afghanistan due to data availability) and Russia based on the OECD’s
classification of Eurasia: Armenia, Azerbaijan, Belarus, Georgia, Kazakhstan, Kyrgyzstan,
Moldova, Mongolia, Tajikistan, Turkmenistan, Ukraine, and Uzbekistan, along with Russia.
The idea behind the composite index is to measure the degree of regional cooperation in the
Eurasian region. The Eurasia Regional Integration Index will basically gauge the magnitude of
these economies’ integration with one another by identifying their strengths and weaknesses. As
mentioned earlier, the data is not available for Afghanistan, but our research has taken steps to
collect all the other necessary data for the index to be constructed so as to ensure that the index
reflects the potential of all the economies within the scope of the project.
The ERII is being developed to measure the integration of the regional economies in Eurasia based
9
be able to demonstrate dynamics within the respective national economies. Another advantage of
panel data is that it enables a dynamic analysis of composite indices across different time periods.
Higher index values depict a rise in interdependence and therefore better integration.
3.1 Dimension weights and aggregation
This report formulates an index that estimates the progress of various integration mechanisms in
Eurasia. The index is a weighted indicator that measures the degree of integration among Eurasian
countries. More specifically, ERII aims to quantify the degree of convergence between Eurasian
countries through institutional, social, trade and investment, macroeconomic, and
infrastructure-related dimensions. In this regard, the index will offer an outlook on the current status quo of each
economy with regards to their pairs, which would eventually contribute to the design of public
policies. Economic integration in this context does not refer only to bilateral trade agreements, but
also to society, institutions, and infrastructure.
The most critical part of the composite index development is assigning weights to each dimension
and all the associated indicators. This is done to identify the importance and contribution of each
of the indicators and dimensions that eventually constructs the index. This research employs
Principal Component Analysis (PCA) to assign weights; however, rather than a subjective or
non-parametric analysis, this paper takes into account the contribution of each dimension to PPP GDP
per capita. This means that we add up all the dimensions and then divide it by GDP per capita, as
this represents better benchmarking than just a subjective analysis. PCA was introduced by
Pearson (1901) and later developed by Hotelling (1933) and it transforms the original variables
into principal components that are orthogonal to each other in a way that each and every PC is a
linear combination of all indicators included. Besides this, Common Factor Analysis (CFA) also
will be employed.
This study employs a two-stage PCA approach; step one is to determine the indicator weights and
step two will determine the weights for the dimensions. For each indicator, PCA will identify the
components with maximum variability to be considered for the value constructed. Once each
10
the overall weighted index. The weights are assigned to dimensions based on their relative
contribution to the variation of that dimension. PCA identifies the first few components that
explain most of the variability of that dimension and then the number of variables will be adjusted
accordingly. At the end, these six dimensions will then be aggregated to generate an index ranging
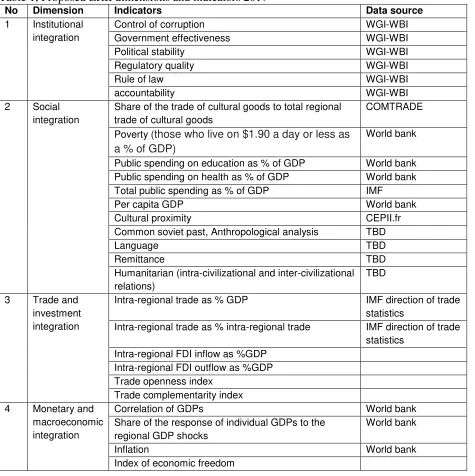
from 0 to 1 to exhibit the status of cooperation and integration within the Eurasian region. Table 1
[image:11.612.73.548.225.701.2]depicts the dimensions and their related indicators;
Table 1, Proposed ERII dimensions and indicators 2017*
No Dimension Indicators Data source
1 Institutional integration
Control of corruption WGI-WBI Government effectiveness WGI-WBI Political stability WGI-WBI Regulatory quality WGI-WBI Rule of law WGI-WBI accountability WGI-WBI 2 Social
integration
Share of the trade of cultural goods to total regional trade of cultural goods
COMTRADE
Poverty (those who live on $1.90 a day or less as a % of GDP)
World bank
Public spending on education as % of GDP World bank Public spending on health as % of GDP World bank Total public spending as % of GDP IMF Per capita GDP World bank Cultural proximity CEPII.fr Common soviet past, Anthropological analysis TBD
Language TBD
Remittance TBD Humanitarian (intra-civilizational and inter-civilizational relations)
TBD
3 Trade and investment integration
Intra-regional trade as % GDP IMF direction of trade statistics
Intra-regional trade as % intra-regional trade IMF direction of trade statistics
Intra-regional FDI inflow as %GDP Intra-regional FDI outflow as %GDP Trade openness index
Trade complementarity index 4 Monetary and
macroeconomic integration
Correlation of GDPs World bank Share of the response of individual GDPs to the
regional GDP shocks
World bank
11
Response of exchange rate to the regional supply shocks
World bank
5 Infrastructure integration
Employment in industry as % total employment World bank Total factor Productivity in Industry World bank Share of TFP in industry in total factor productivity World bank Common road and railroad
* Possible changes apply.
4. Ideas for policy implications
1. In terms of institutional capacity for integration, transparency, regulatory, and government role
are crucial elements. The proportionate size of the shadow economy is important in designing
regional policies. In some Central Asian countries, the shadow economy contributes to a large
informal sector which could adversely affect policy coordination. It is important to derive policies
that could help in having a better institutional quality.
2. In the integrated societies, people will move across borders and have shared cultural
backgrounds. But there are various factors contributing to this movement, such as education,
income, health, trade in cultural goods, etc. that need to be measured to show whether these
societies are actually socially integrated.
3. The pattern of regional trade has changed since the 1990s, i.e., there is less trade with Europe
and more with China and other countries in the region. This is probably explained by the fact that
former Soviet republics, after experiencing the collapse of trade with the former Soviet Union,
were less and still are less involved in international trade than other countries of the same size and
level of development. Former Soviet republics are building up their foreign trade from scratch,
and, like in many other cases, building anew turns out to be easier than restructuring. This report
will therefore determine the level of trade integration after efforts have been made in trade
restructuring and will additionally suggest policies regarding trade and investment flows.
4. From the perspective of monetary and macroeconomic integration, there are some prerequisites
12
monetary policy; hence, ERII would recommend the feasibility of such arrangements through
investigating the symmetries in the disturbances of the output among these economies.
5. With regards to the infrastructure, the region needs to focus on a specific industrial policy. The
goal of industrial policy in the region should be to support potentially competitive export-oriented
industrial enterprises and to facilitate the reallocation of labour and capital from less competitive
sectors to more competitive industry. This would be translated into a higher total factor
productivity in the economies under concern. Another crucial element related to the infrastructure
is the “Belt and Road Initiative” and its impact on regional development. Currently, some Central
Asian countries are connected to the Belt and Road (Kazakhstan, Kyrgyzstan, and Uzbekistan).
ERII would offer crucial insight into infrastructure connectivity in the region.
In conclusion, from the perspective of policy coordination, ERII would recommend further steps
that need to be taken in order to have more policies coordinated for the above mentioned
dimensions.
5. References
Baldwin, R. E., and Seghezza, E. (1996). Trade-induced investment-led growth (No. w5582). National Bureau of Economic Research.
EABR, 2017, Eurasian Economic Integration, https://eabr.org/en/analytics/integration-research/cii-reports/eurasian-economic-integration-2017/
Hotelling, H. (1933). Analysis of a complex of statistical variables into principal components. Journal of educational psychology, 24(6), 417.
Karaganov, S. (2018). The new Cold War and the emerging Greater Eurasia. Journal of Eurasian studies, 9(2), 85-93.
Mundell, R. A. (1961). A theory of optimum currency areas. The American economic review, 51(4), 657-665.
13
Pearson, K. (1901). LIII. On lines and planes of closest fit to systems of points in space. The London, Edinburgh, and Dublin Philosophical Magazine and Journal of Science, 2(11), 559-572.
Vinokurov, E., Demidenko, M., Korshunov, D., & Kovacs, M. (2017). Customs unions, currency crises, and monetary policy coordination: The case of the Eurasian Economic Union. Russian Journal of Economics, 3(3), 280-295.
Acknowledgement