614 | P a g e
DETECTION OF MICROANEURYSMS IN RETINAL
IMAGES THROUGH LOCAL BINARY PATTERNS
Ritika¹, Ashavani kumar²
Department of Physics, NIT Kurukshetra, Haryana
ABSTRACT
Diabetic retinopathy (DR) is the most frequent cause of new cases of blindness. Since the presence of
microaneurysms is first sign of DR. As the disordered patients perceive no symptoms until the disease is at late
stage. So early detection and proper treatment has to be ensured. To serve this purpose automated system has
been designed to recognize and detect microaneurysms (MA) in the fundus images. For this purpose, the performance of Local Binary Patterns (LBP) as a texture descriptor for retinal images has been explored. The
preprocessing techniques such as Contrast Limited Adaptive Histogram Equalization (CLAHE) are used to
enhance the contrast of the input image. The candidate extractors such as Circular Hough Transform are
utilized to improve the red lesion detection. The results suggest that the method presented in this paper is a
robust algorithm for describing retina texture and can be useful in a diagnosis aid system for retinal disease
screening.
Keywords- Age-related Macular Degeneration, AMD, Diabetic Retionopathy, Fundus Image,
Local Binary Patterns, Microaneurysms.
I. INTRODUCTION
The World Health Organization (WHO) estimates that in 2010 there were 285 million people visually impaired
around the world. About 65% of all people who are visually impaired are aged 50 and older, while this age
group comprises about 20% of the world's population In spite of the fact that the number of blindness cases has
been significantly reduced in recent years, it is estimated that 80% of the cases of visual impairment are
preventable or treatable [1].
Fundus images are the main resource used by ophthalmologists for screening of diabetic retinopathy severity.
Effective treatment is available if the condition is detected early, before visual symptoms occur.
Microaneurysms are earliest signs and most characteristics lesions. Thus, their detection is highly relevant for
the diagnose of diabetic retinopathy. In pathological sense, microaneurysms are blood-filled dilations of
capillary walls. In accordance with general concept, small circular shaped dark lesions, whose diameter is
smaller than 125 µm are considered to be microaneurysms [3]. Manual lesion segmentation is time consuming
and requires a heavy workload for trained experts in the analysis of anomalous patterns of each disease which,
added to the at-risk population increase, makes these campaigns economically infeasible. Therefore, the need for
615 | P a g e
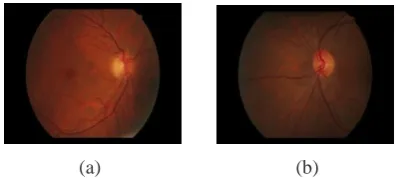
(a) (b)
Fig. 1. Fundus images (a) Healthy (b) With MA
Our research focuses discrimination capabilities in the texture of fundus images to differentiate between
pathological and healthy images. Since computer analysis cannot replace the clinician, the system aims at
identifying fundus images with suspected lesions and at sorting them by severity. Automatic system can help to
reduce the specialist’s burden and examination time, with the additional advantages of objectivity and
reproducibility. Moreover, it can help to rapidly identify the most severe cases and to focus clinical resources on
the cases that need urgent and specific attention [4].
II. REVIEW OF AVAILABLE METHODS
Several methods have been developed for the automatic detection of red lesions in colour fundus images.. In
Mookiah et al abnormal signs were extracted from fundus images to detect normal fundus and two DR stages.
Thirteen features, such as area of hard exudates, area of blood vessels, bifurcation points, texture and entropies,
fed three different classifiers, Decision tree C4.5 and support vector machine(SVM). In more recent work of
Mookiah et al., a different methodology for AMD characterization is done through local configuration patterns
(LCP) rather than by LBP. Linear configuration coefficients and pattern occurrence features are extracted and a
linear SVM is used after feature selection [5]. Krishnan and Laude combine LBP with entropies and invariant
moments to generate an integrated index for diabetic retionopathy diagnosis. Garnier et al deal with the AMD
detection using LBP. The texture information on several on several scales is analysed through a wavelet
coefficients. Linear discriminant Analysis (LDA) is used for feature dimension reduction using values of the
entire LBP histogram as input features. Mookiah et al. require the segmentation of exudates in addition to segmentation of main structures for feature and although three different classes are identified, they only focus on
DR detection.
III. PROPOSED TECHNIQUE
The proposed method takes as input a color fundus image. An algorithm for retina image classification without
the need for prior segmentation of suspicious lesions was developed. Manual lesion segmentation is time
consuming and automatic segmentation algorithms might not be accurate, thus removing the need for lesion
segmentation can make the classification more robust. All the images of resulting dataset must comply with
certain quality criteria.
Images with serve artefacts, for example bright and circular spots produced by some dust in the camera
lens.
Images affected by a relative large amount of implusive noise (salt and pepper noise).
616 | P a g e
3
.1 Pre processing
The proposed technique does not require complicated preprocessing steps. Due to the fact that the images under
study belong to different databases, the size of images varies. As the LBP and VAR values depends on the
radius of the neighbourhood, the images must be resized to a standardized size to obtain comparable texture
descriptors. If the image is larger than a previously fixed size, it is going to be resized. The original ratio and
quality of the image is preserved during this step by using bicubic interpolation for resampling the source image.
Bicubic interpolation is used for the output pixel value is a weighted average of pixels in the nearest 4-by-4
neighbourhood. Before feature extraction, a median filter for noise reduction
is
performed using a 3-by-3neighbourhood. Only the pixels of the retina background are considered significant for the texture analysis [6].
Thus the main structures of the fundus, which are not related to disease unde study, should not be taken in to
account when fundus texture is analysed.
3.2 Local Binary Patterns
Local Binary Pattern is a very efficient operator that is used to obtain features which are used for classification
in computer vision. The most important properties of LBP features are its tolerance against illumination
variations and also its computational simplicity. The first step in LBP is to produce label for each pixel in the
image where the label is found based on the local neighbourhood of the pixel which is defined by a radius, R,
and a number of points, P. The neighbouring pixels are thresholded with respect to the grey value of the central
pixel of the neighbourhood generating a binary string or, in other words, a binary pattern. The value of a LBP
label is obtained for every pixel by summing the binary string weighted with powers of two as follows:
LBPP,R= (gp-gc).2 p
,
(1)
where gP and gC are the grey values of the neighbourhood and central pixel, respectively. P represents the
number of samples on the symmetric circular neighbourhood of radius R. The gp values are interpolated to fit
with a given R and P. The values of the labels depend on the size of the neighbourhood (P). 2P different binary
patterns can be generated in each neighbourhood. However, the bits of these patterns must be rotated to the
minimum value to achieve a rotation invariant pattern. In the case of P = 8, only 36 of the 2P possible patterns
are rotation invariant, i.e., LBP8,R can have 36 different values [7]. When LBP are used for texture description, it
is common to include a contrast measure by defining the rotational invariant local variance as follows:
VAR
P,R=
(g
p-µ)
2, µ=
g
p(2)
The LBP and VAR measures are complementary and are combined to enhance the performance of the LBP
operator.
3.3 Feature Extraction and Classification
The LBP and VAR operators described above are used to characterize the texture of the retina background.
They are calculated for each pixel of the RGB images using P = 8 and different values of R (R = {1,2,3,5}). The
617 | P a g e
considered. The red, green and blue components of each image are independently analysed. One example of theaspect of the LBP and VAR.
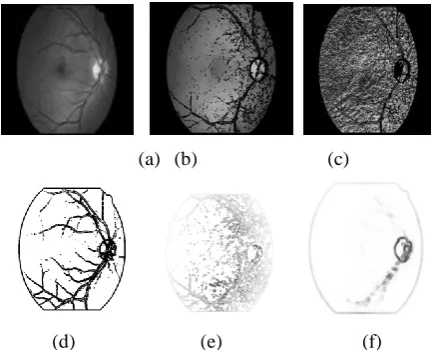
(a) (b) (c)
(d) (e) (f)
Fig. 2. (a) Median filtered image (b) Vessel removed image (c) LBP feature extracted image (d) Vessel mask
image (e) Variance feature image (Red channel)
(e) Variance feature image (Blue channel)
The resulting LBP and VAR images provide a description of the image texture. After masking the optic disc
and vessel segments, the LBP and VAR values within the external mask of the fundus are collected into
histograms, one for each color (RGB).
Table- I Comparisons on Different Databases
TPR TNR Features Classifier Validation
Garnier et al. 0.913 0.955 Wavelet transform
and LBP
LDA Leave-one-out
Mookiah et al. 0.980 0.975 LCP SVM 10-fold CV
Proposed method 1.00 0.998 LBP SVM 10-fold external CV
Different statistical information is extracted from these histograms to use it as features in the classification stage.
Concretely, the calculated statistical values are: mean, standard deviation, median, entropy, skewness and
kurtosis. To sum up, 6 statistical values are calculated from each LBP and VAR histogram, giving place to 12
features for each radius used. Consequently, the total number of features is equal to 144 (12 features x 4 radius x
3 components).
TABLE- II ANALYSIS OF RGB INFLUENCE
TPR TNR
Red component 1.000 0.979
Green
component
0.979 1.000
Blue
component
0.990 0.959
618 | P a g e
methodOnce the preprocessing, two tasks are carried out: data normalization and data resampling. The method used for
optic disc detection is mainly based on principal component analysis along with mathematical morphology
operations. The algorithm used for vessel segmentation is by the use of basic mathematical morphology
operation. The external mask is directly obtained by thresholding after masking the optic disc and vessel
segments, LBP and VAR within.
IV. CONCLUSION
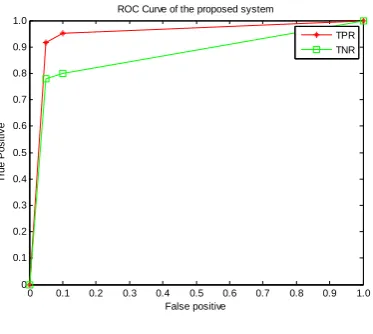
To evaluate the performance of the proposed method, different classifiers were tested. The performance of the
algorithms was evaluated based on two concpets: sensitivity or true positive rate (TPR) and specificity or true
negative rate (TNR). Sensitivity and specificity measure the proportion of negative and positive cases which are
correctly identified. Finally obtained result with proposed method is compared to Quantization Phase Local
method for texture descriptor.
0 0.1 0.2 0.3 0.4 0.5 0.6 0.7 0.8 0.9 1.0 0
0.1 0.2 0.3 0.4 0.5 0.6 0.7 0.8 0.9 1.0
ROC Curve of the proposed system
False positive
Tr
u
e
P
o
s
it
iv
e
TPR TNR
Fig 3. ROC Curve
REFERENCES
[1] World Health Organization (WHO), “Universal eye health: a global action plan 2014-2019,” 2013.
[2] S. Zabihi, M. Delgir, and H.-R. Pourreza, “Retinal vessel segmentation using color image morphology
and local binary patterns,” in Machine Vision and Image Processing (MVIP), 6th Iranian, 2010.
[3] M. Mookiah, U. R. Acharya, R. J. Martis, C. K. Chua, C. Lim, E. Ng, and A. Laude, “Evolutionary
algorithm based classifier parameter tuning for automatic diabetic retinopathy grading: A hybrid feature extraction approach,” Knowledge-Based Systems, vol. 39, no. 0, pp. 9 – 22, 2013.
[4] M. Garnier, T. Hurtut, H. Ben Tahar, and F. Cheriet, “Automatic multiresolution age-related macular
degeneration detection from fundus images,” in SPIE, Proceedings, vol. 9035, 2014, pp. 903532–
903532–7.
[5] M. R. K. Mookiah, U. R. Acharya, H. Fujita, J. E. Koh, J. H. Tan, K. Noronha, S. V. Bhandary, C. K.
619 | P a g e
degeneration characterization and classification,” Computers in Biology and Medicine, vol. 63, pp. 208 –218, 2015.
[6] S. Morales, V. Naranjo, J. Angulo, J. J. Fuertes, and M. Alca˜niz, “Segmentation and analysis of retinal
vascular tree from fundus images processing,” in International Conference on Bio-inspired Systems and
Signal Processing (BIOSIGNALS 2012), 2012, pp. 321 – 324.
[7] T. Ojala, M. PietikaÈ inen, T. MaÈenpaÈa, “Multiresolution grayscale and rotation invariant texture
classification with local binary patterns,” IEEE Trans. Pattern Anal. Machine Intelligence, vol. 24, no. 7,
2002.
[8] S. Morales, V. Naranjo, J. Angulo, and M. Alca˜niz, “Automatic detection of optic disc based on pca and
mathematical morphology,” Medical Imaging, IEEE Transactions on, vol. 32, no. 4, pp. 786–796, April
2013.
[9] N. V. Chawla, K. W. Bowyer, L. O. Hall, and W. P. Kegelmeyer, “SMOTE: Synthetic minority
over-sampling technique,” Artificial Intelligence Research, Journal of, vol. 16, pp. 321–357, 2002.
[10] T. Scheffer, “Error estimation and model selection,” Ph.D. dissertation, Technischen Universitt Berlin,
School of Computer Science, 1999.
[11] S. Dudoit and M. J. van der Laan, “Asymptotics of cross-validated risk estimation in estimator selection
and performance assessment,” Statistical Methodology, vol. 2, no. 2, pp. 131 – 154, 2005.
[12] R. Kohavi and G. H. John, “Wrappers for feature subset selection,” Artificial Intelligence, vol. 97, no. 12,
pp. 273 – 324, 1997.
[13] M. Hall, E. Frank, G. Holmes, B. Pfahringer, P. Reutemann, and I. H. Witten, “The weka data mining
software: An update,” SIGKDD Explor. Newsl., vol. 11, no. 1, pp. 10–18, Nov. 2009.
[14] L. S. Cessie and J. C. van Houwelingen, “Ridge Estimators in Logistic Regression,” Applied Statistics,
vol. 41(1), pp. 191–201, 1992.
[16] C. C. Chang and C. J. Lin, “LIBSVM: A library for support vector machines,” Intelligent Systems and